XM Institute has been tracking the sentiment of U.S. consumers as part of our ongoing consumer studies for more than a decade. To understand the overall quality of life of the U.S. population, we created the well-being index (WBi), which is the average of three measurements representing the percentage of American adults (18 and older) who agree with these statements:
- I am typically happy
- I am healthy
- I am financially secure
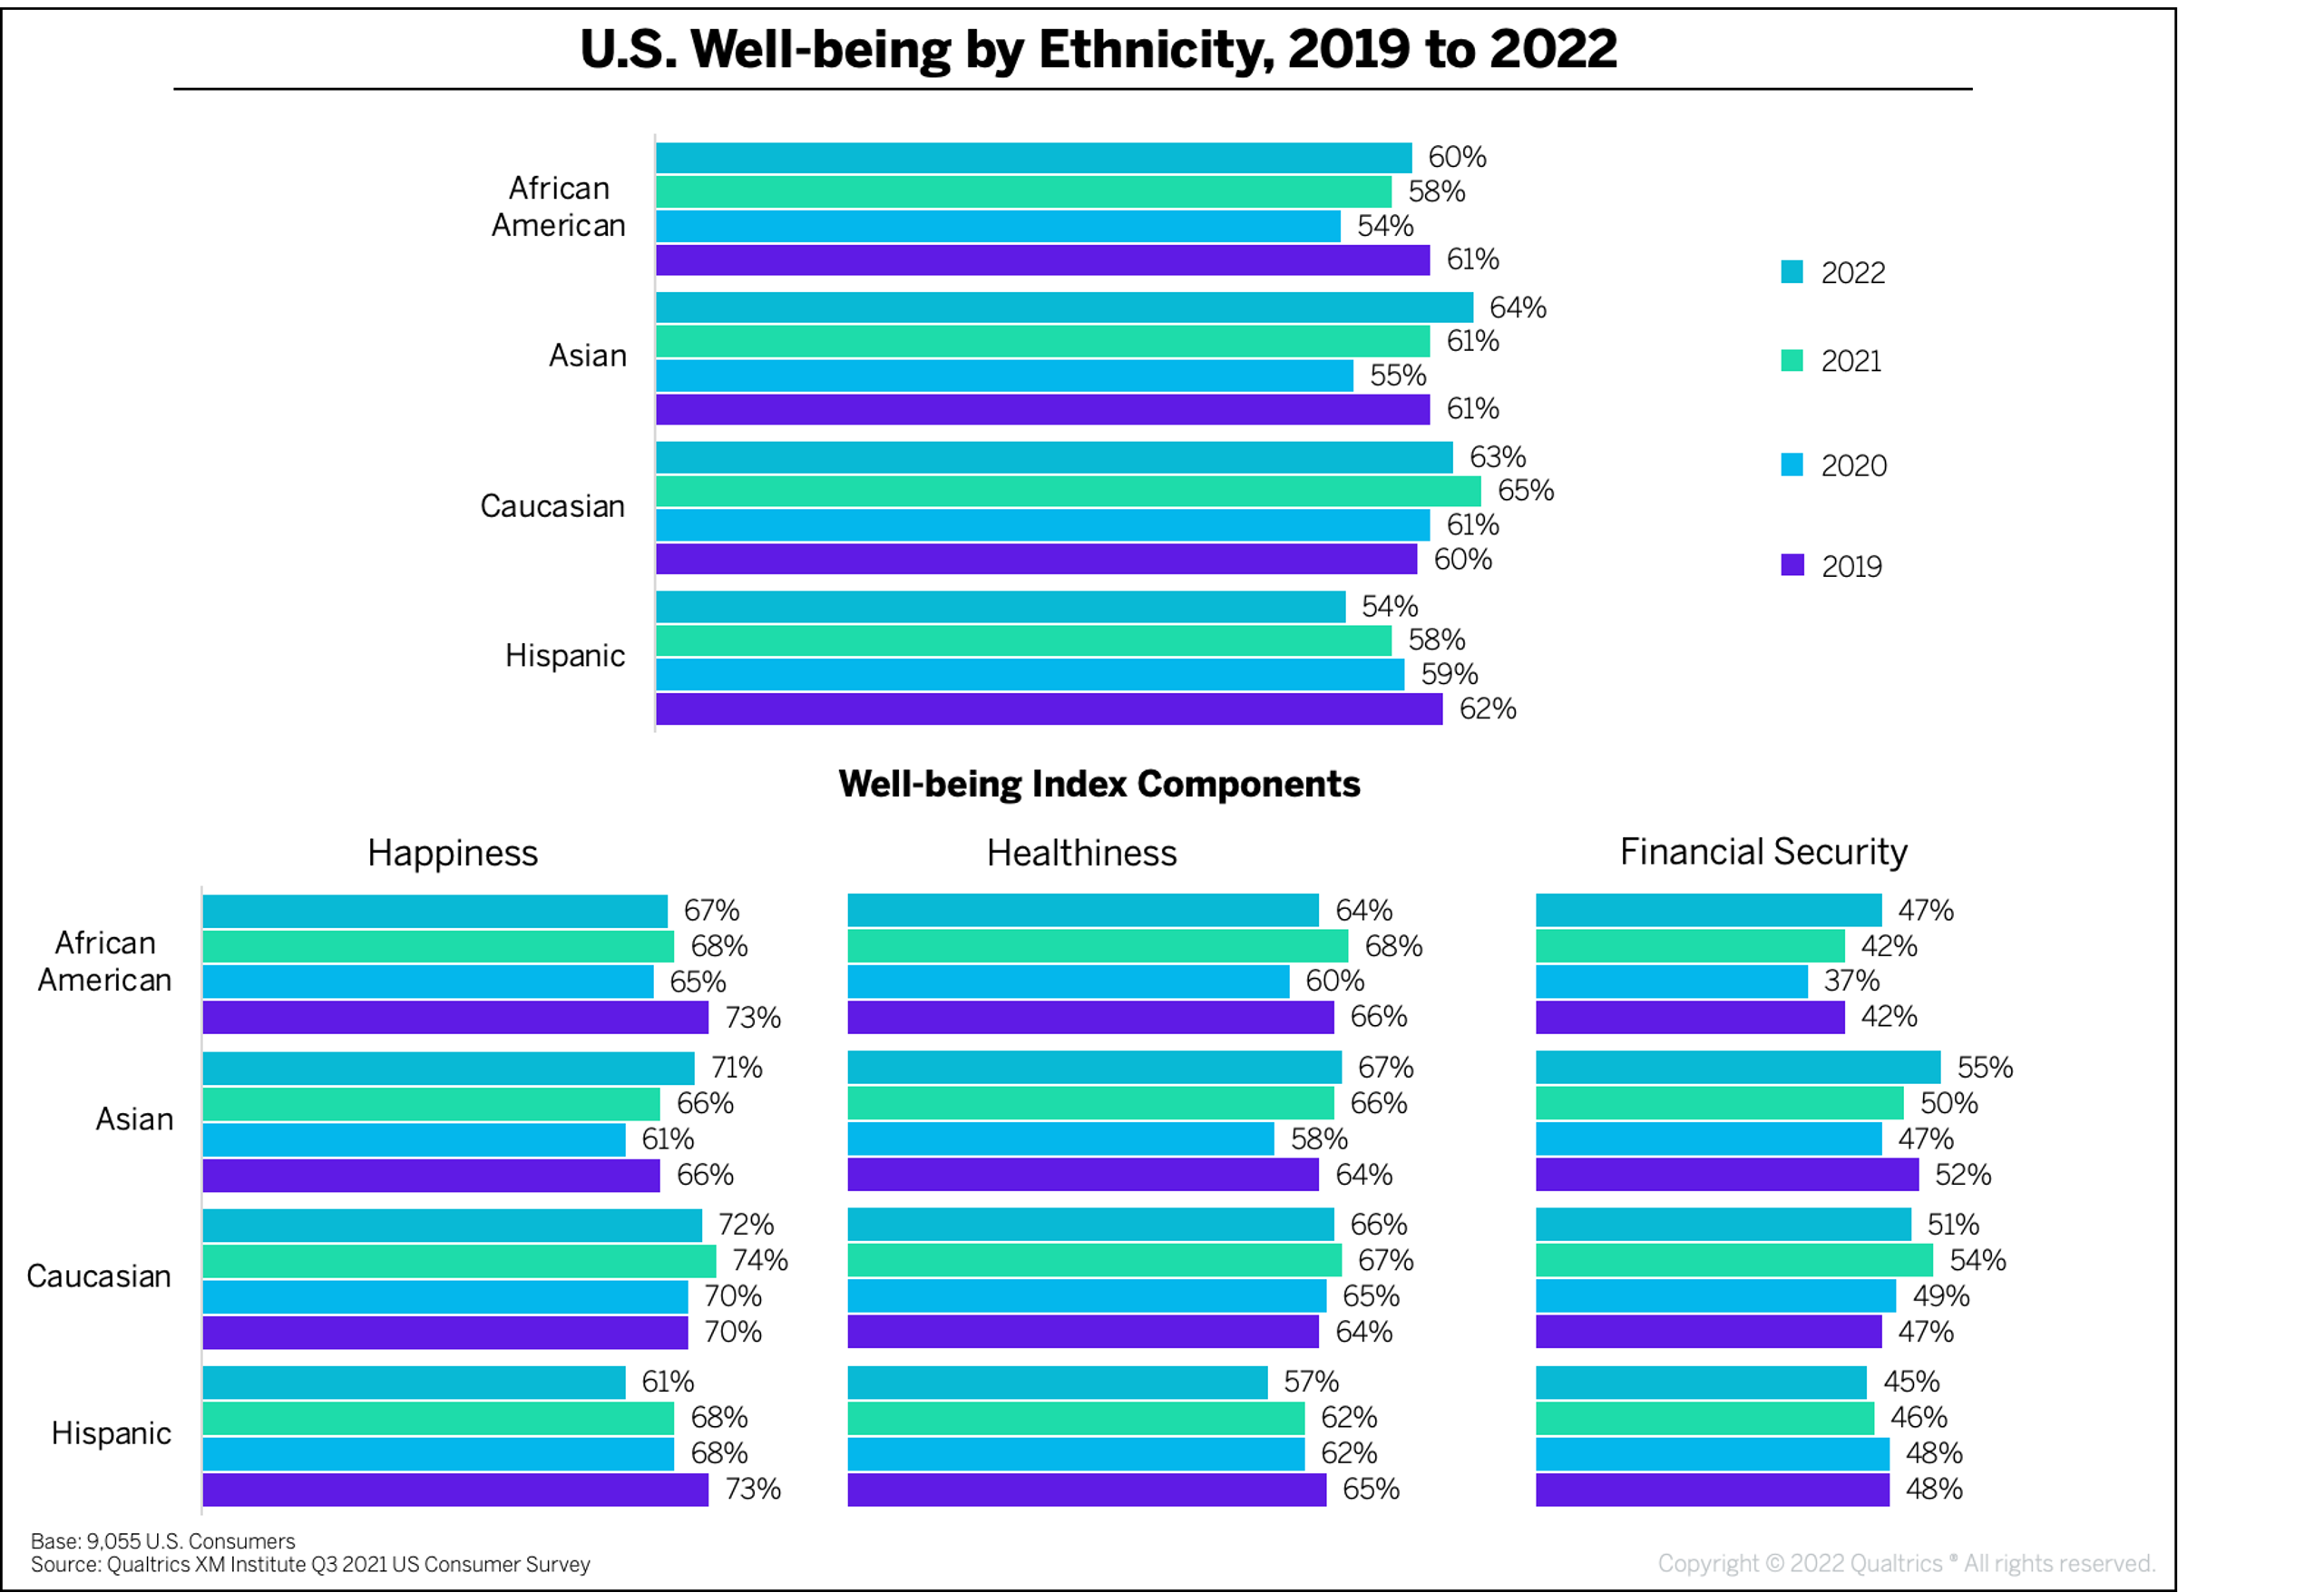
When we examined WBi scores across different groupings of people in the U.S., we found that quality of life varies widely for different demographics this year. We also learned that some divergent trends we spotted last year have continued into 2022, while others have reversed course. For example:
- Well-being continues to fall for Hispanics. Hispanic well-being is down by 8 points compared to their 2019 well-being index score, from 62% to 54%. Hispanics are the only demographic group with a smaller percentage of financially secure people in 2022 than in 2019, dropping 3 percentage-points. The 4-point difference in their WBi scores from 2021 to 2022 represents the largest single-year drop in Hispanic well-being since 2019.
- Asian well-being is up compared to 2019. Asians and Caucasians are the only demographic groups whose 2022 WBi score is above that of 2019 – a difference of +3 points each. Asians report being happier, healthier, and more financially secure than in 2019 by at least 3 points across each component.
- Caucasians remain the happiest population. Though they trail Asians in both the health and financial security components, Caucasians are still the happiest racial group, with a score of 72%. However, this score is down from its high in 2021, when Caucasians were 2 points happier.
- African-Americans are more financially secure than in 2021. Forty-seven percent of African-Americans say they are financially secure, 5 points higher than in 2021. Only two groups, Asians and Caucasians, report financial security for more than 50% of their populations.
- Health has declined for all except Asians. All racial groups experienced a decline in their population health since 2021, ranging from a drop of 5 points among Hispanics to a drop of 1 point for Caucasians, except for Asians, who report an increase in health by 1 point.
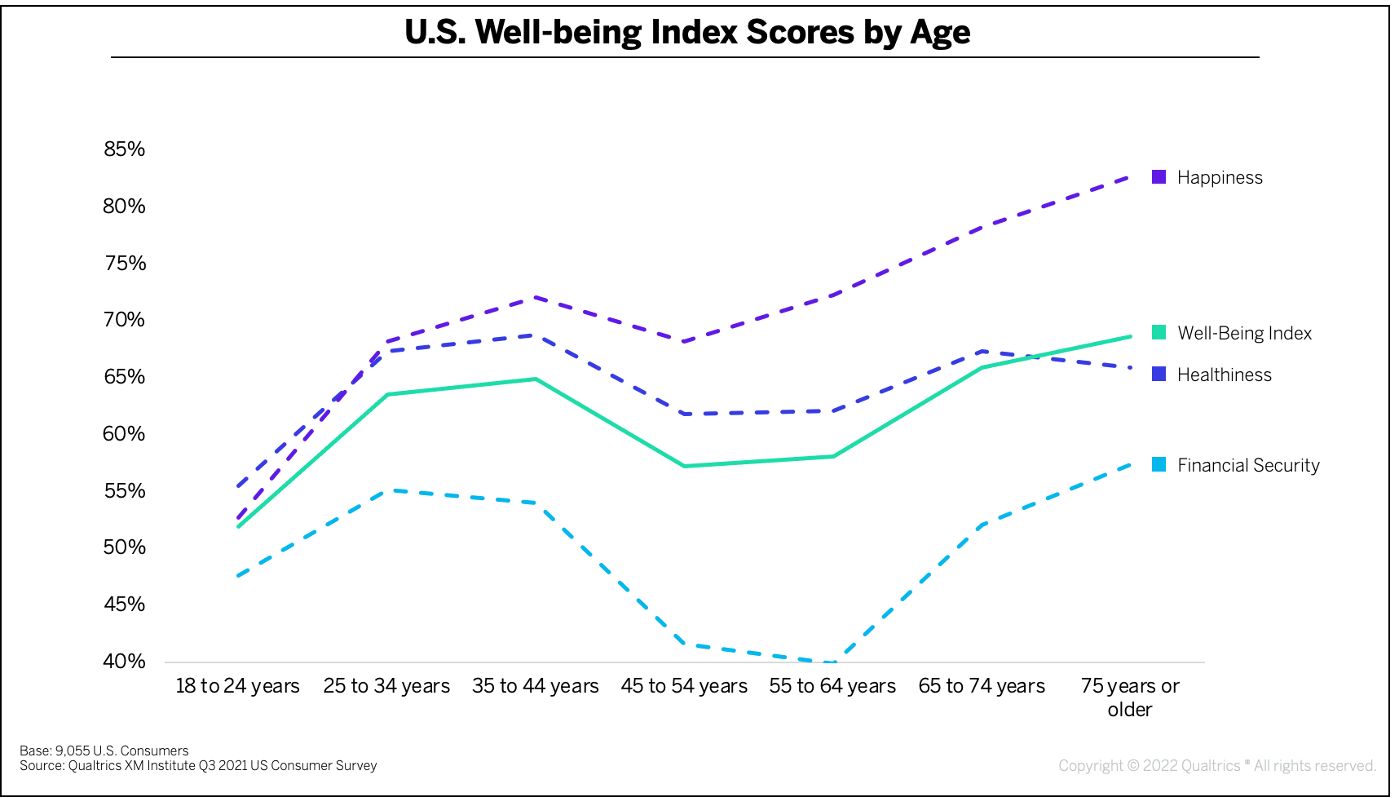
We also track our WBi across different age groups in 2022 and see that although quality of life trends upwards for older generations, the middle-aged US population (ages 45 to 64) reports a diminished sense of well-being in comparison to both their younger and older peers. Looking further into the data, we found that:
- Happiness is highest among the oldest population. Eighty-three percent of people 75 years or older say that they are typically happy. Happiness is least prevalent for the youngest adults, among whom just 53% of respondents say they are happy.
- Well-being is lowest for the youngest population. 18 to 24-year-olds are least likely to say they are healthy and typically happy compared to older generations, resulting in the lowest WBi score of all age groups, at 52%.
- People ages 45 to 64 are the least financially secure. Under forty-five percent of people ages 45 to 64 say they are financially secure, over 10 points lower than the age groups directly preceding and succeeding them. 18 to 24-year-olds also report higher levels of financial security than this age group.
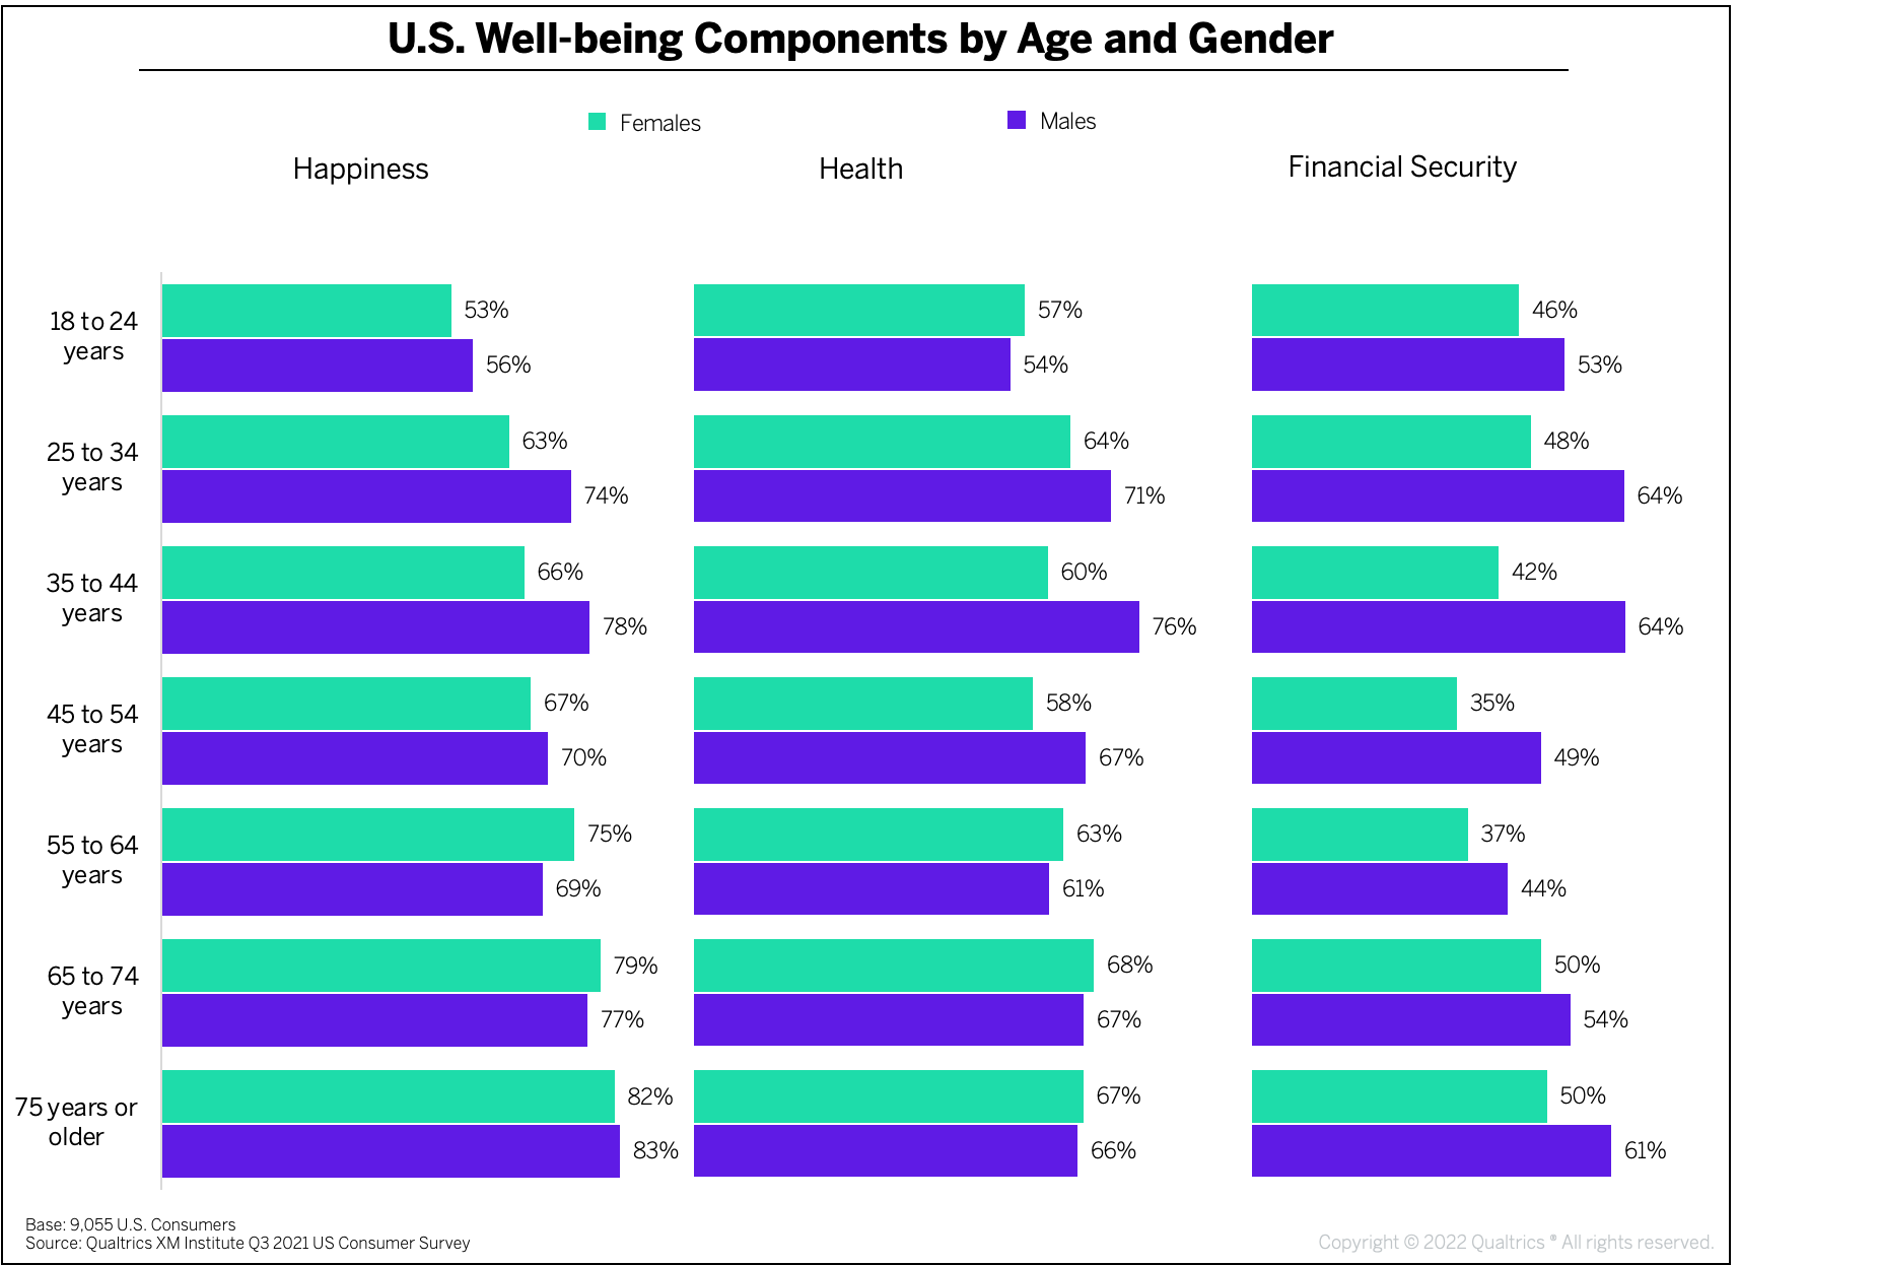
When examining the well-being gaps between both age and gender, we found that men under 55 and over 65 enjoy a higher well-being index score than women of the same age. On average across all age groups, men experience a WBi score 6 points higher than women. Delving further, we learned that:
- Men under 55 are happier than women. Younger men say they are typically happy more frequently than younger women. This gap is smallest at 3 points for people ages 45 to 54 and largest for those 35 to 44, at 12 points. Older women are happier than men, however, with 75% saying they are typically happy at ages 55 to 64, compared to men’s 69%.
- Men of all ages are more financially secure than women. The difference is most pronounced for 35 to 44-year-olds – just 42% of women this age say they are financially secure compared to 64% of men, a gap of 21 points.
- Women ages under 25 and over 55 are healthier than their male peers. While males ages 25 to 54 report being healthy more frequently than women, women under 25 and over the age of 55 are more likely to say they are healthy than men of the same age.
The bottom line: We hope to see well-being improve for all in next year’s post.
Bruce Temkin, XMP, CCXP, is the Head of Qualtrics XM Institute
Moira Dorsey, XMP is a Principal XM Catalyst with Qualtrics XM Institute
Talia Quaadgras is a Senior Research Associate with Qualtrics XM Institute