Last year, XM Institute published 29 different pieces of content sharing key findings from our employee, consumer, executive, and practitioner quantitative research studies. These studies included over 140,000 respondents from dozens of countries and a variety of different backgrounds. We could never summarize all the insights into one lone infographic, but we can play favorites! In this infographic, we highlight some of the data points we’ve found most noteworthy over the last year.
We look forward to sharing our new research findings in 2024!
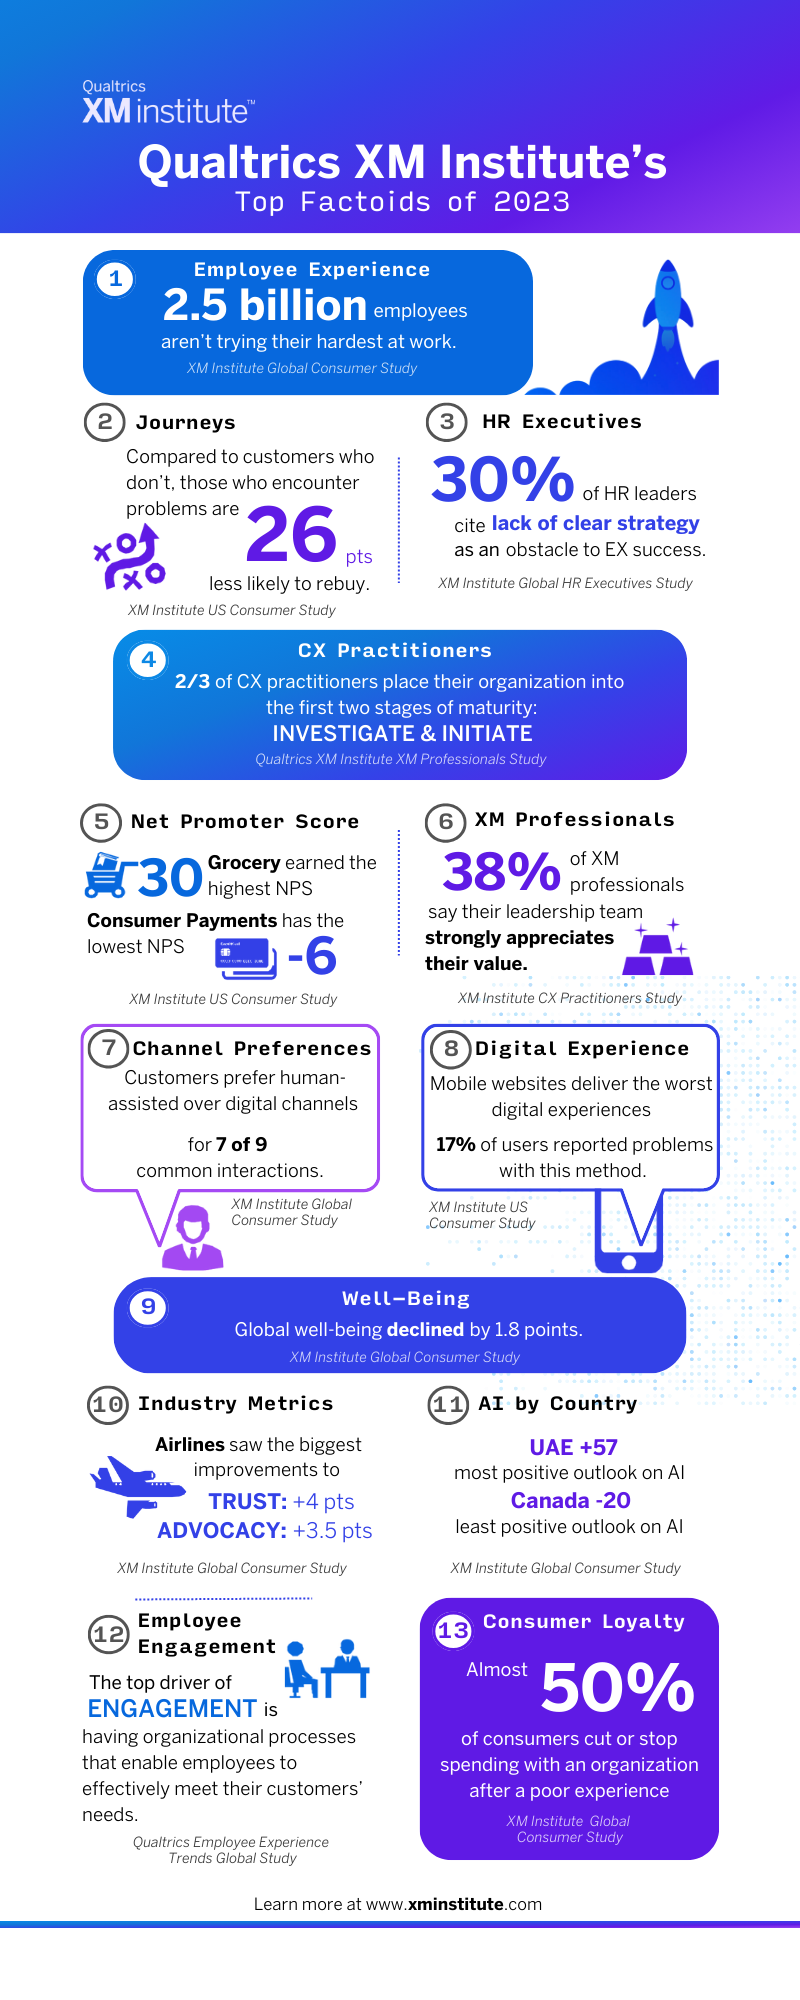
Find additional topical insights and details on methodology for each factoid in the following publications:
- 2.5 Billion Employees Aren’t Trying Their Hardest
- U.S. Consumer Journeys Needing Improvement Across 22 Industries, 2023
- Global Study: HR Executives and XM
- The State of CX Maturity, 2023
- XMI Customer Ratings – Consumer NPS, 2023 (by Industry)
- State of the XM Profession, 2023
- Customers Prefer Human Interaction Channels
- The Humanized Digital Experience Ratings
- Global Well-Being Declines from 2021
- Global Study: Consumer Satisfaction and Loyalty, 2024
- Global Study: Consumer and Employee Attitudes Toward AI
- 2024 Employee Experience Trends
- How Consumers Cut Spending Across 20 Industries After Poor Experiences, 2023
4 x 11 in Infographic


