Key Takeaways
As part of Qualtrics’ global employee study, employees from 32 countries/regions rated their current work experiences across several components. From this study, we analyzed the five key performance indicators (Engagement, Inclusion, Well-Being, Intent to Stay, and Experience v Expectations) for employee experience as well as the top seven drivers of Engagement in each country. In this snapshot, we share the metrics from Asia-Pacific and Japan. We found that:
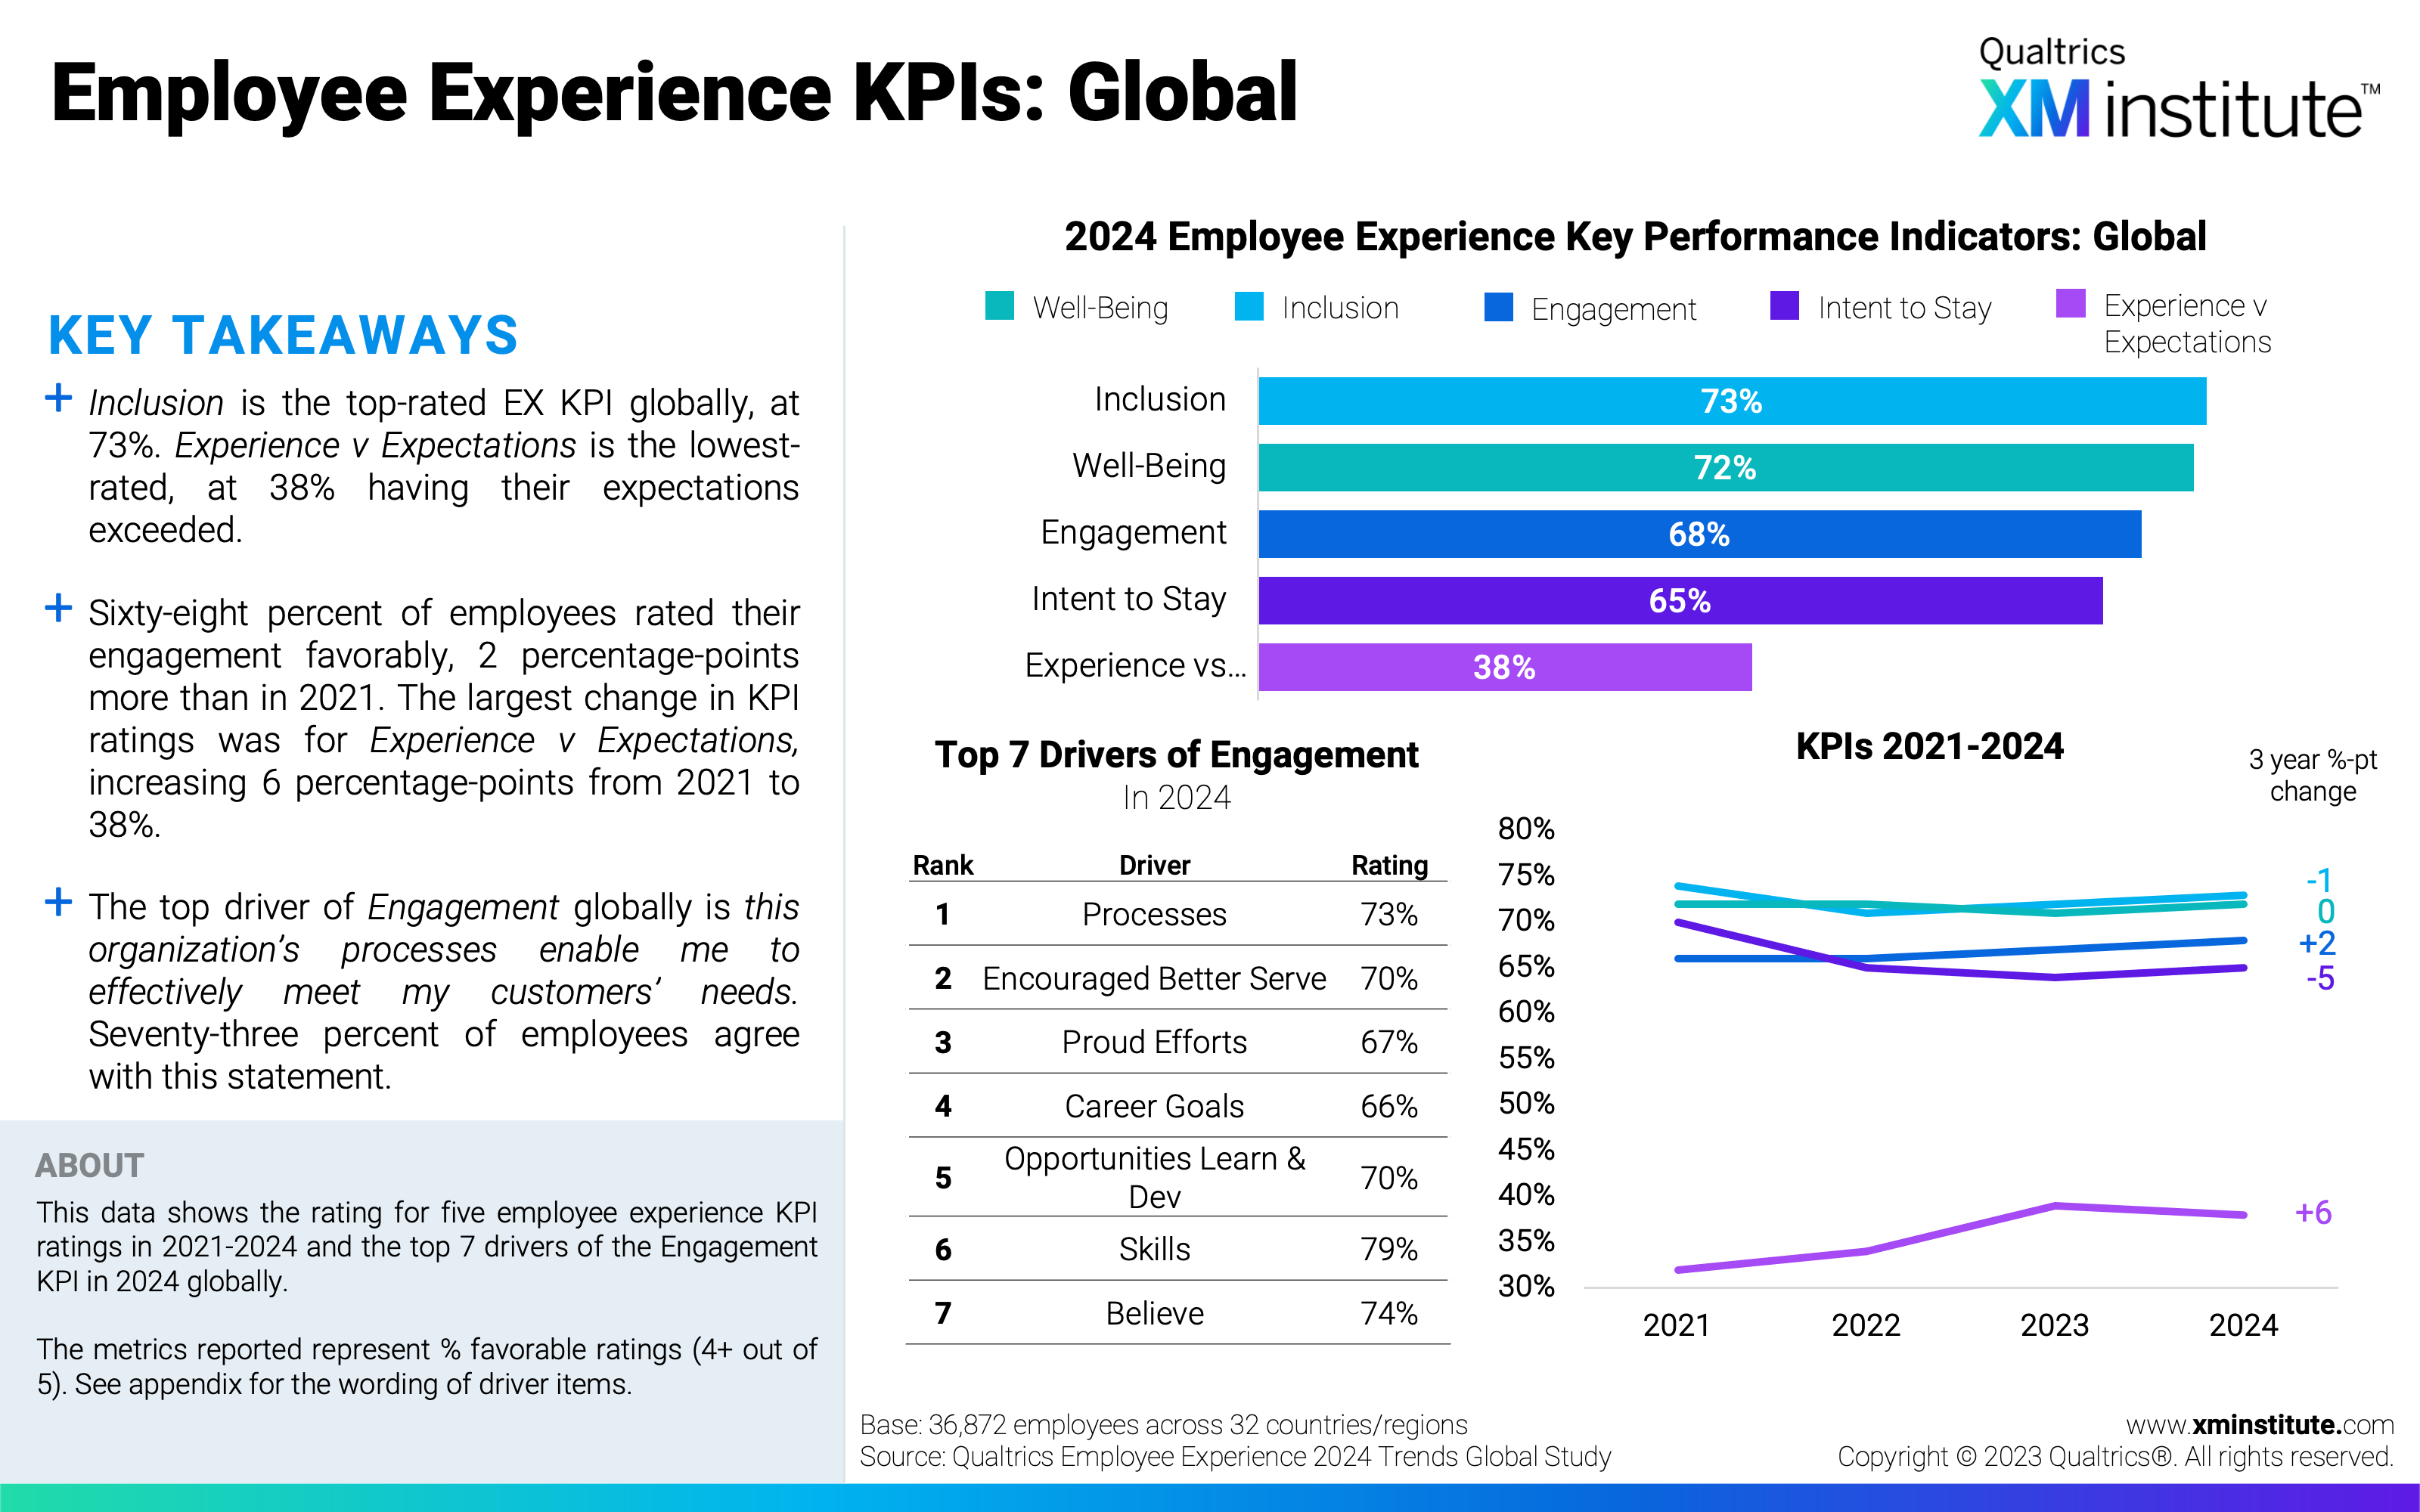
- KPI ratings vary by country. Engagement ratings span 51 percentage points in this region, the greatest variation of all KPIs. Intent to Stay ratings have the smallest gap, spanning 28 percentage-points across the thirteen countries measured in this region.
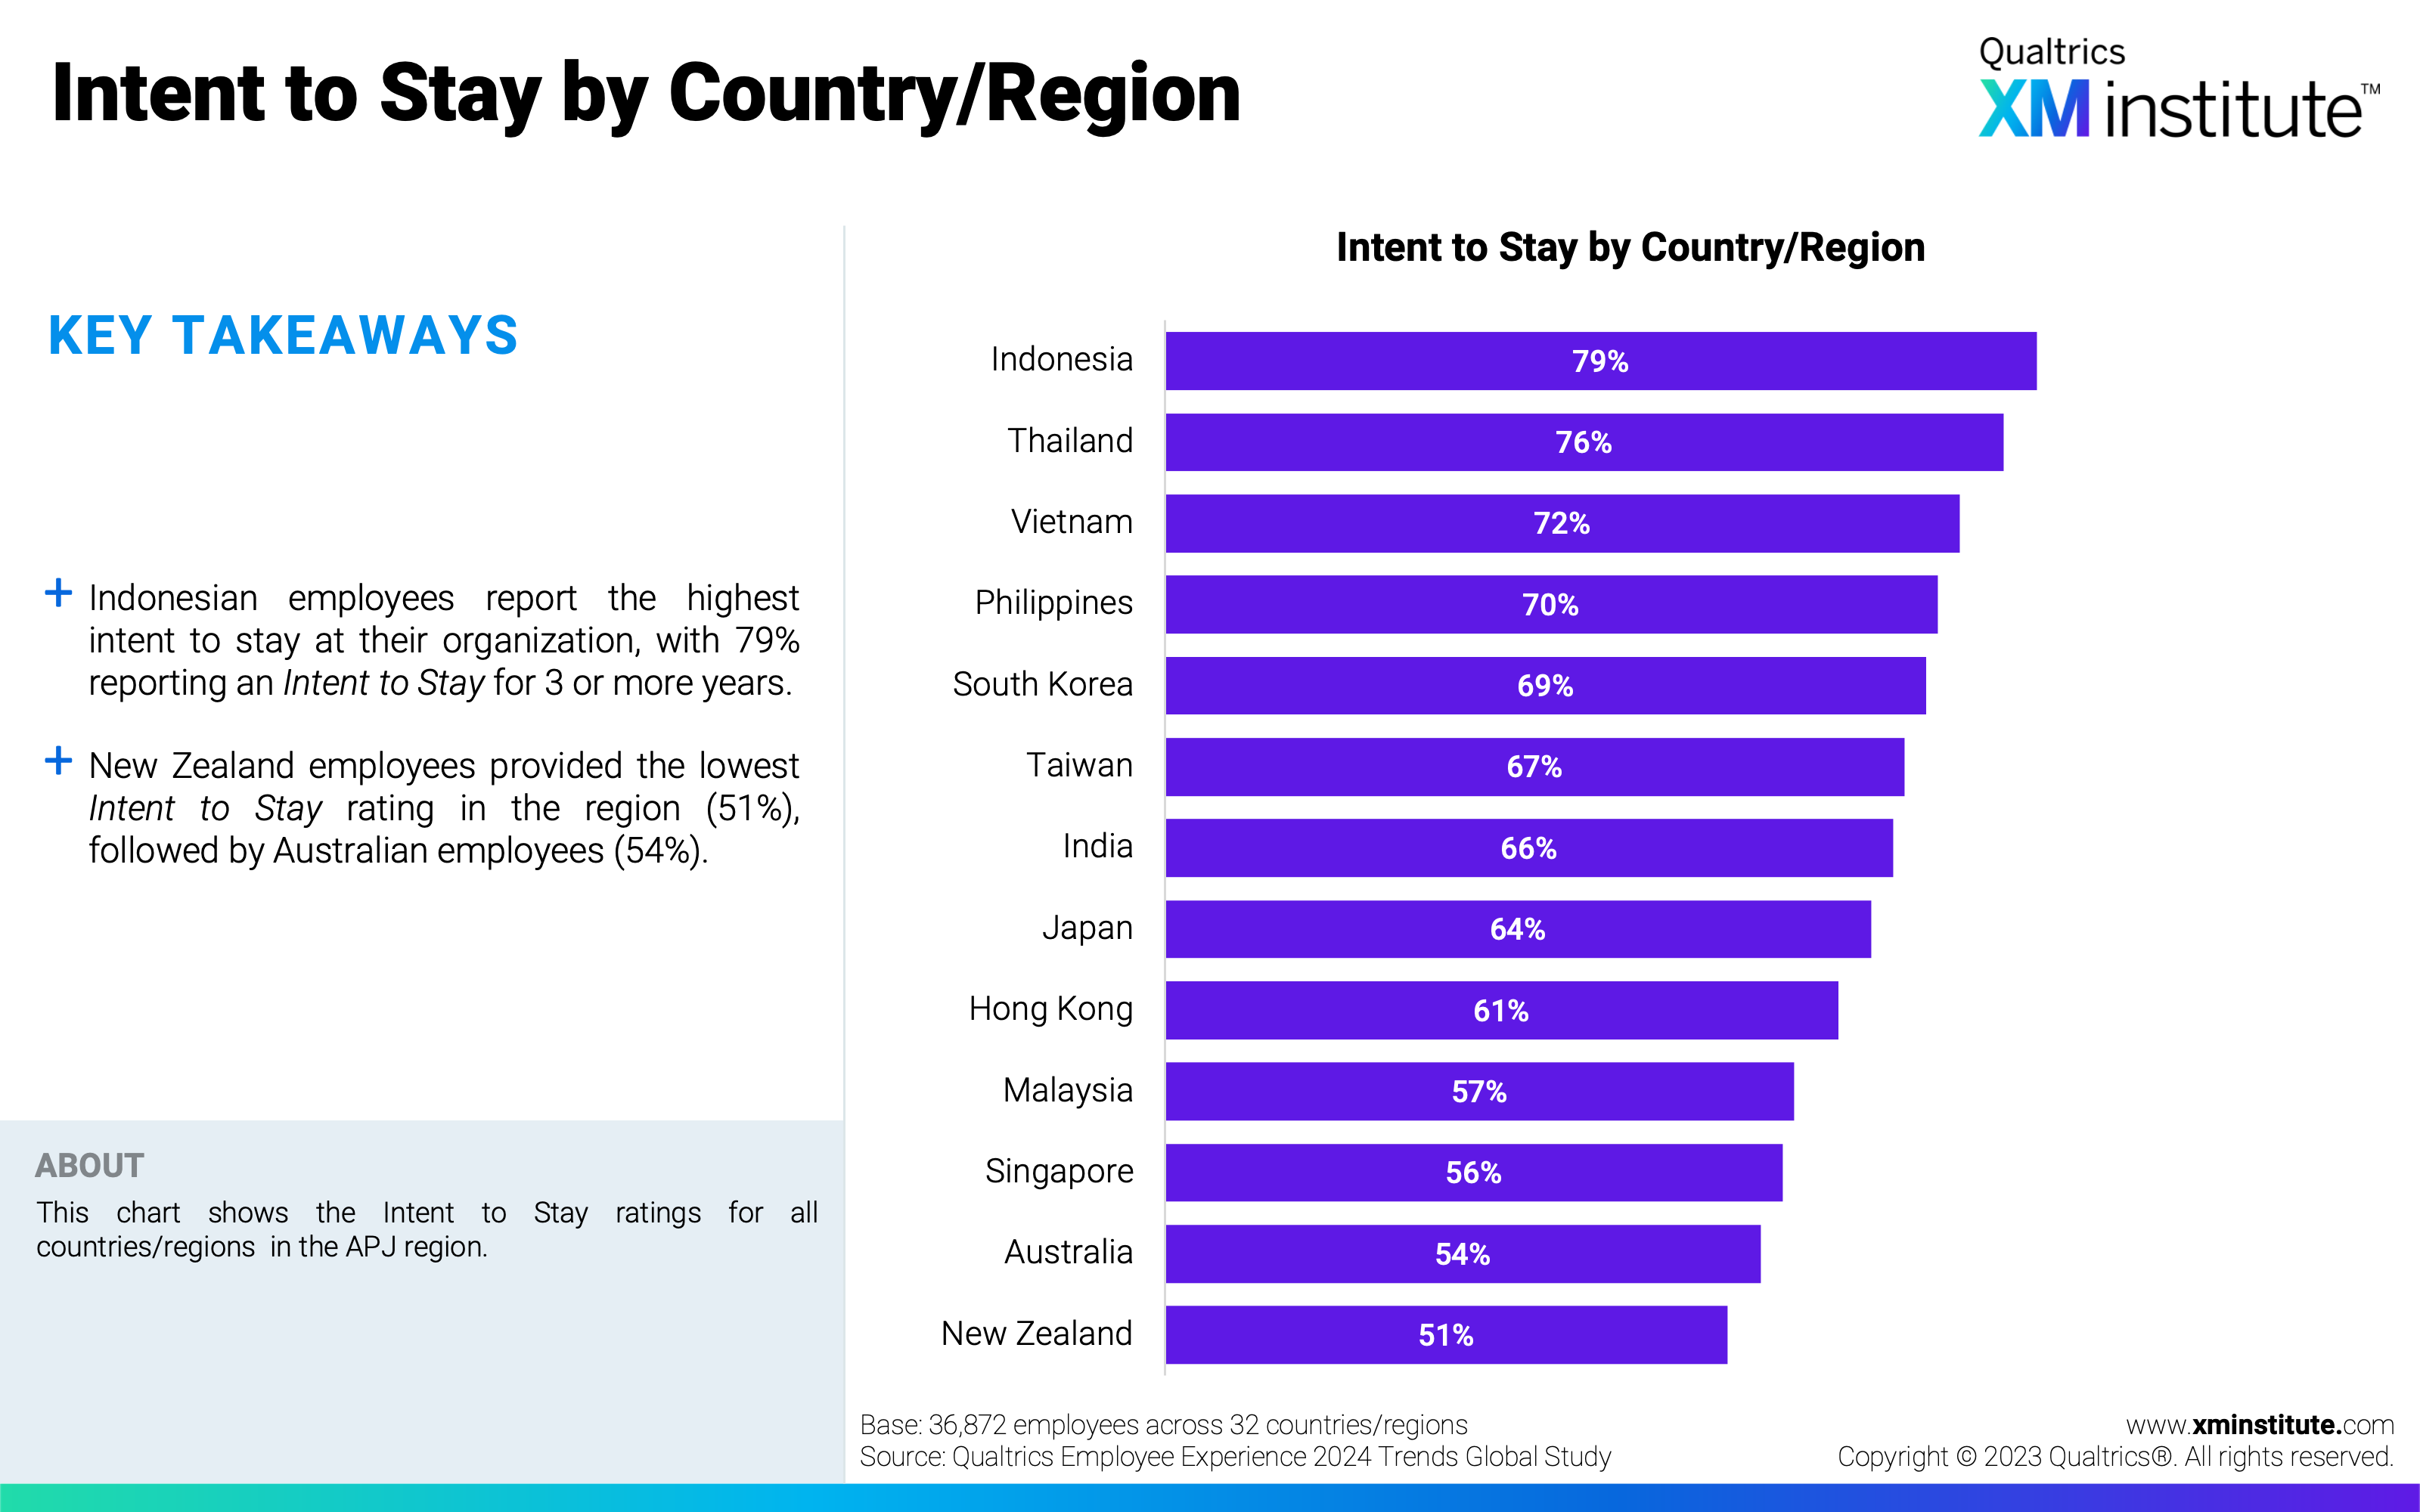
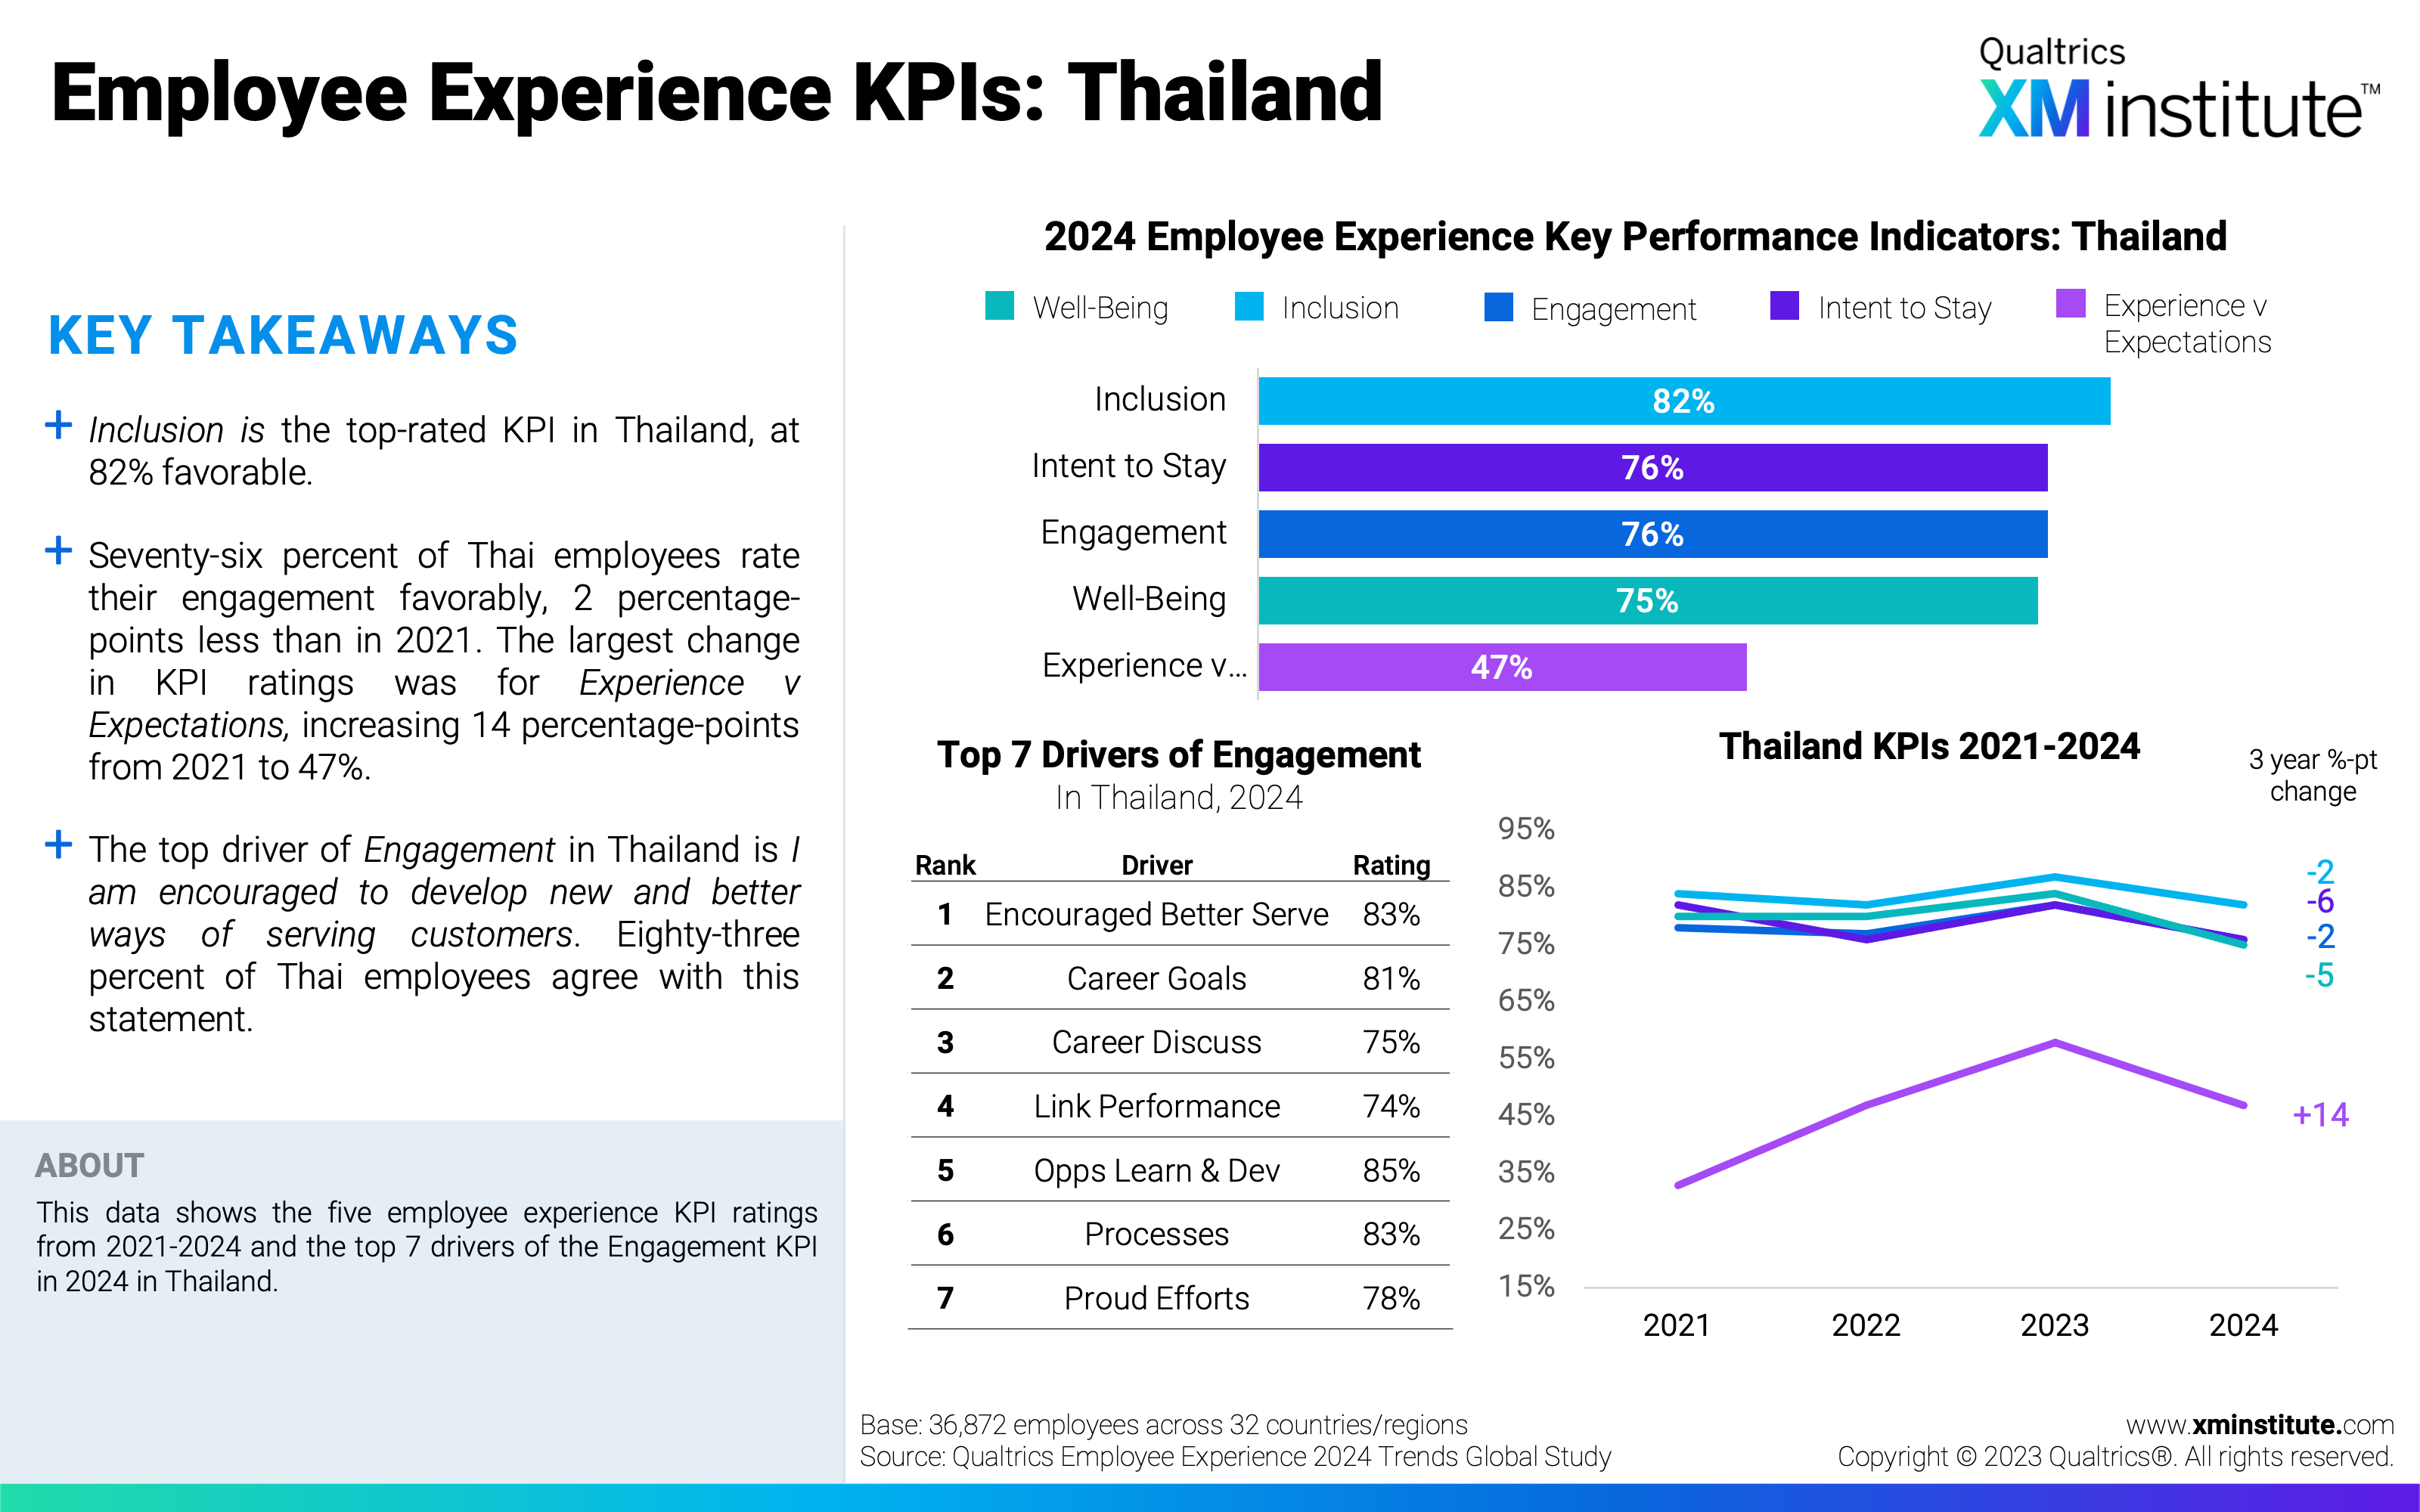
- Indonesian and Thai employees report the highest Intent to Stay. The majority of Indonesian and Thai employees (>75%) expressed an intention to stay working with their employer for 3 years or more. Employers in Australia and New Zealand should expect the most turnover as a little over half of employees in these countries report their Intent to Stay with their current employer for at least 3 years.
- Japanese employees report the greatest change in employee experience since 2021. Since 2021, Japan’s five KPI metrics have changed on average by over 10 percentage points, the most of any country in this region. The ratings New Zealander employees provide have changed the least from 2021, shifting by just over one percentage point.
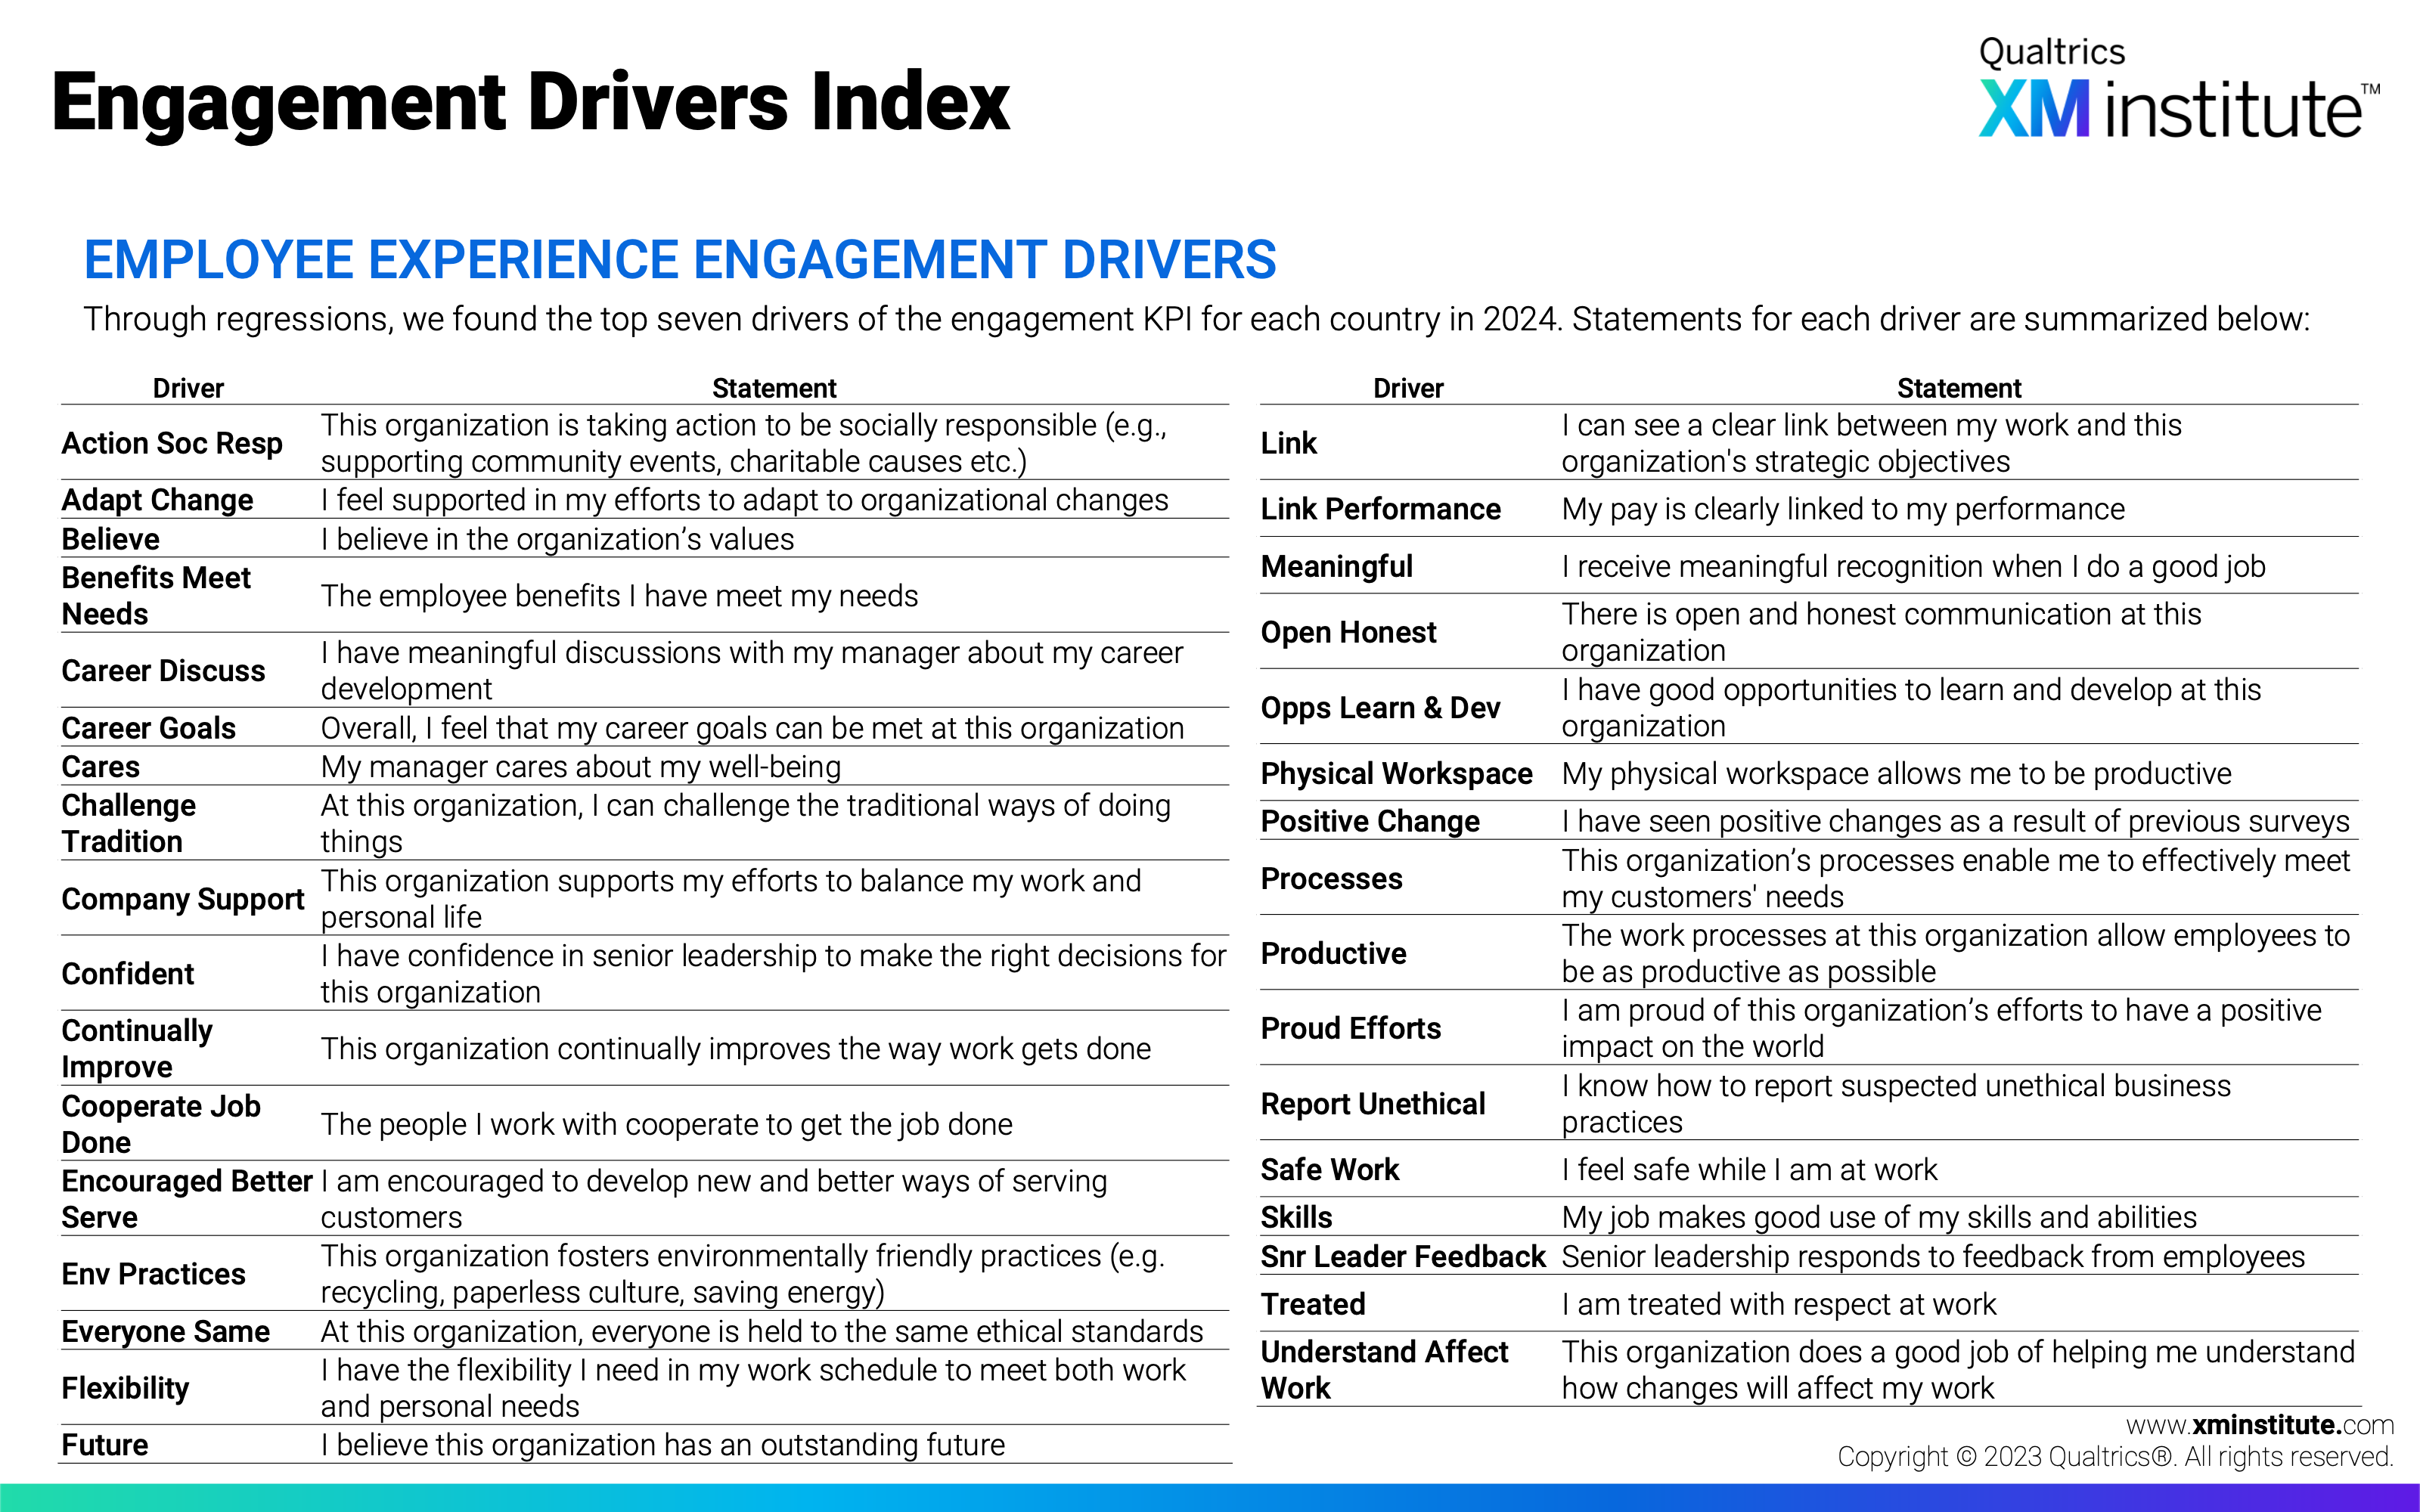
- Professional development is a top driver of employee engagement. Twelve of thirteen APJ countries in this study selected I feel that my career goals can be met at this organization as a top driver of employee engagement. I am proud of this organization’s efforts to have a positive impact on the world is also a top driver of Engagement in 10 of 13 countries.
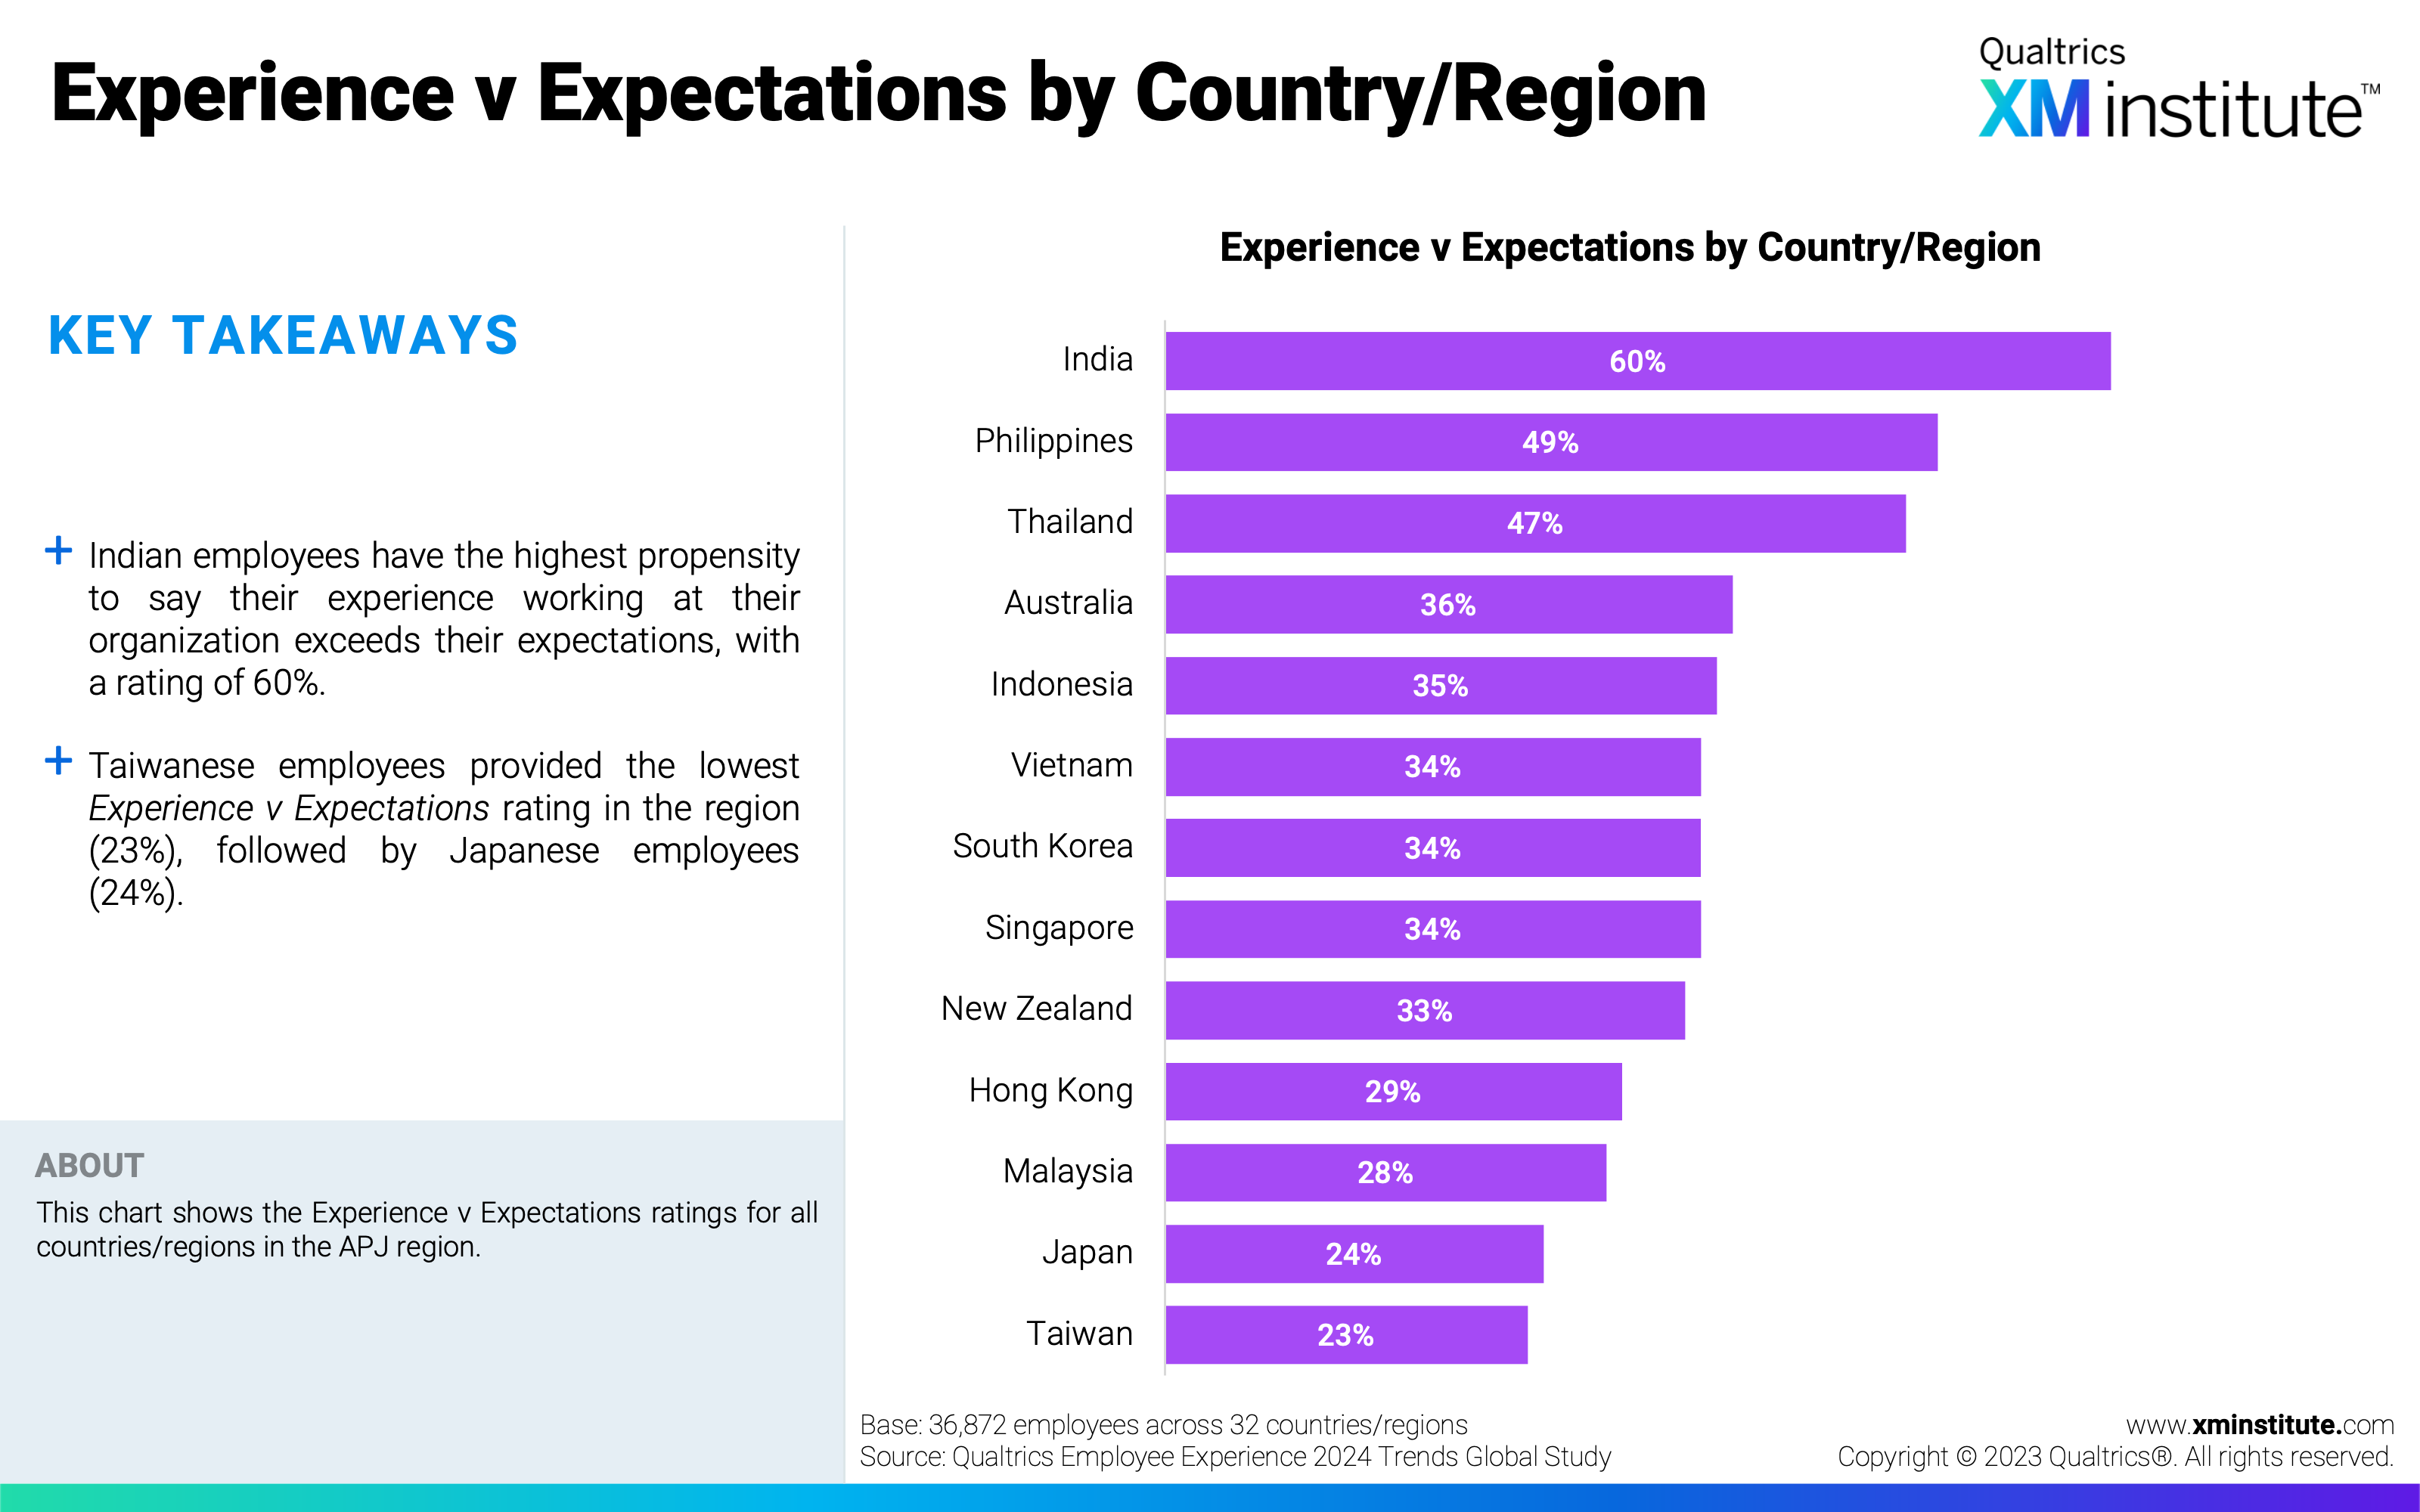
- APJ employees changed their Experience v Expectations ratings the most since 2021. Of the five KPIs, Experience v Expectations saw the biggest ratings change since 2021, shifting by an average of 10.5 percentage points in the countries included in both studies. Inclusion ratings stayed the most stable over the same period in this region, with an average change of just 2.8 percentage-points.
Figures
Here are the figures in this Data Snapshot:
- KPI Questions
- Employee Experience KPIs: Global
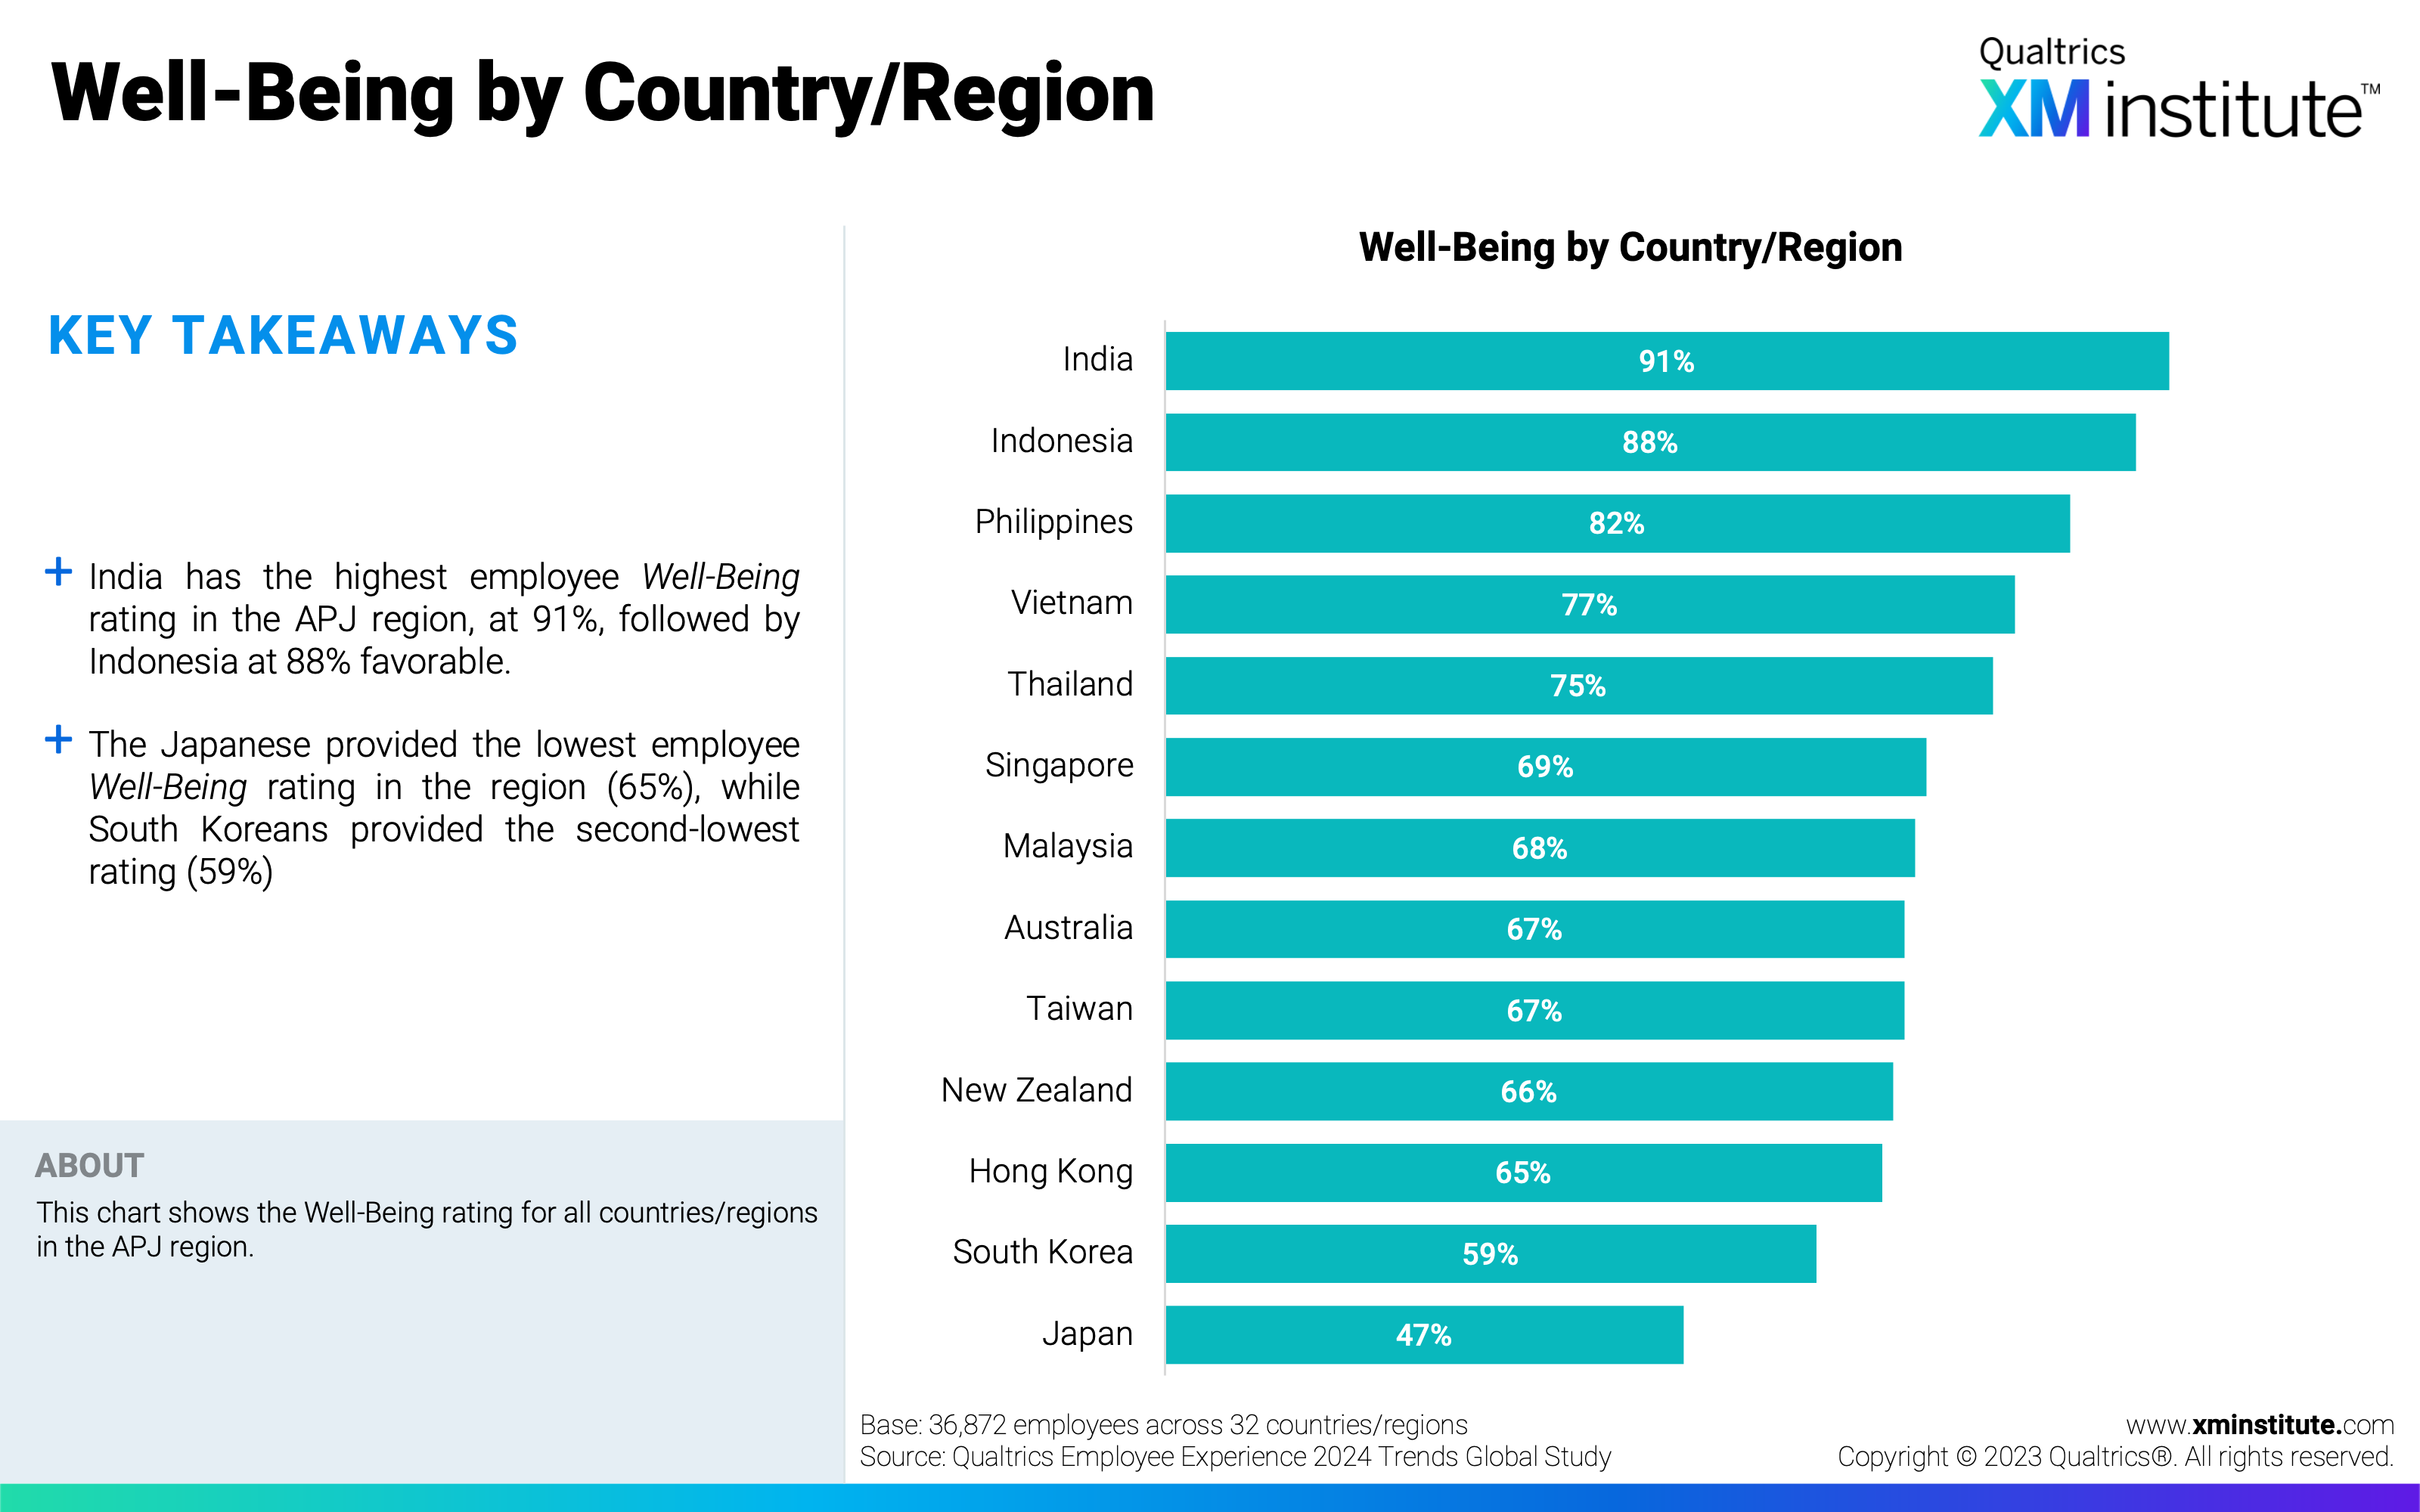
- Well-Being by Country/Region
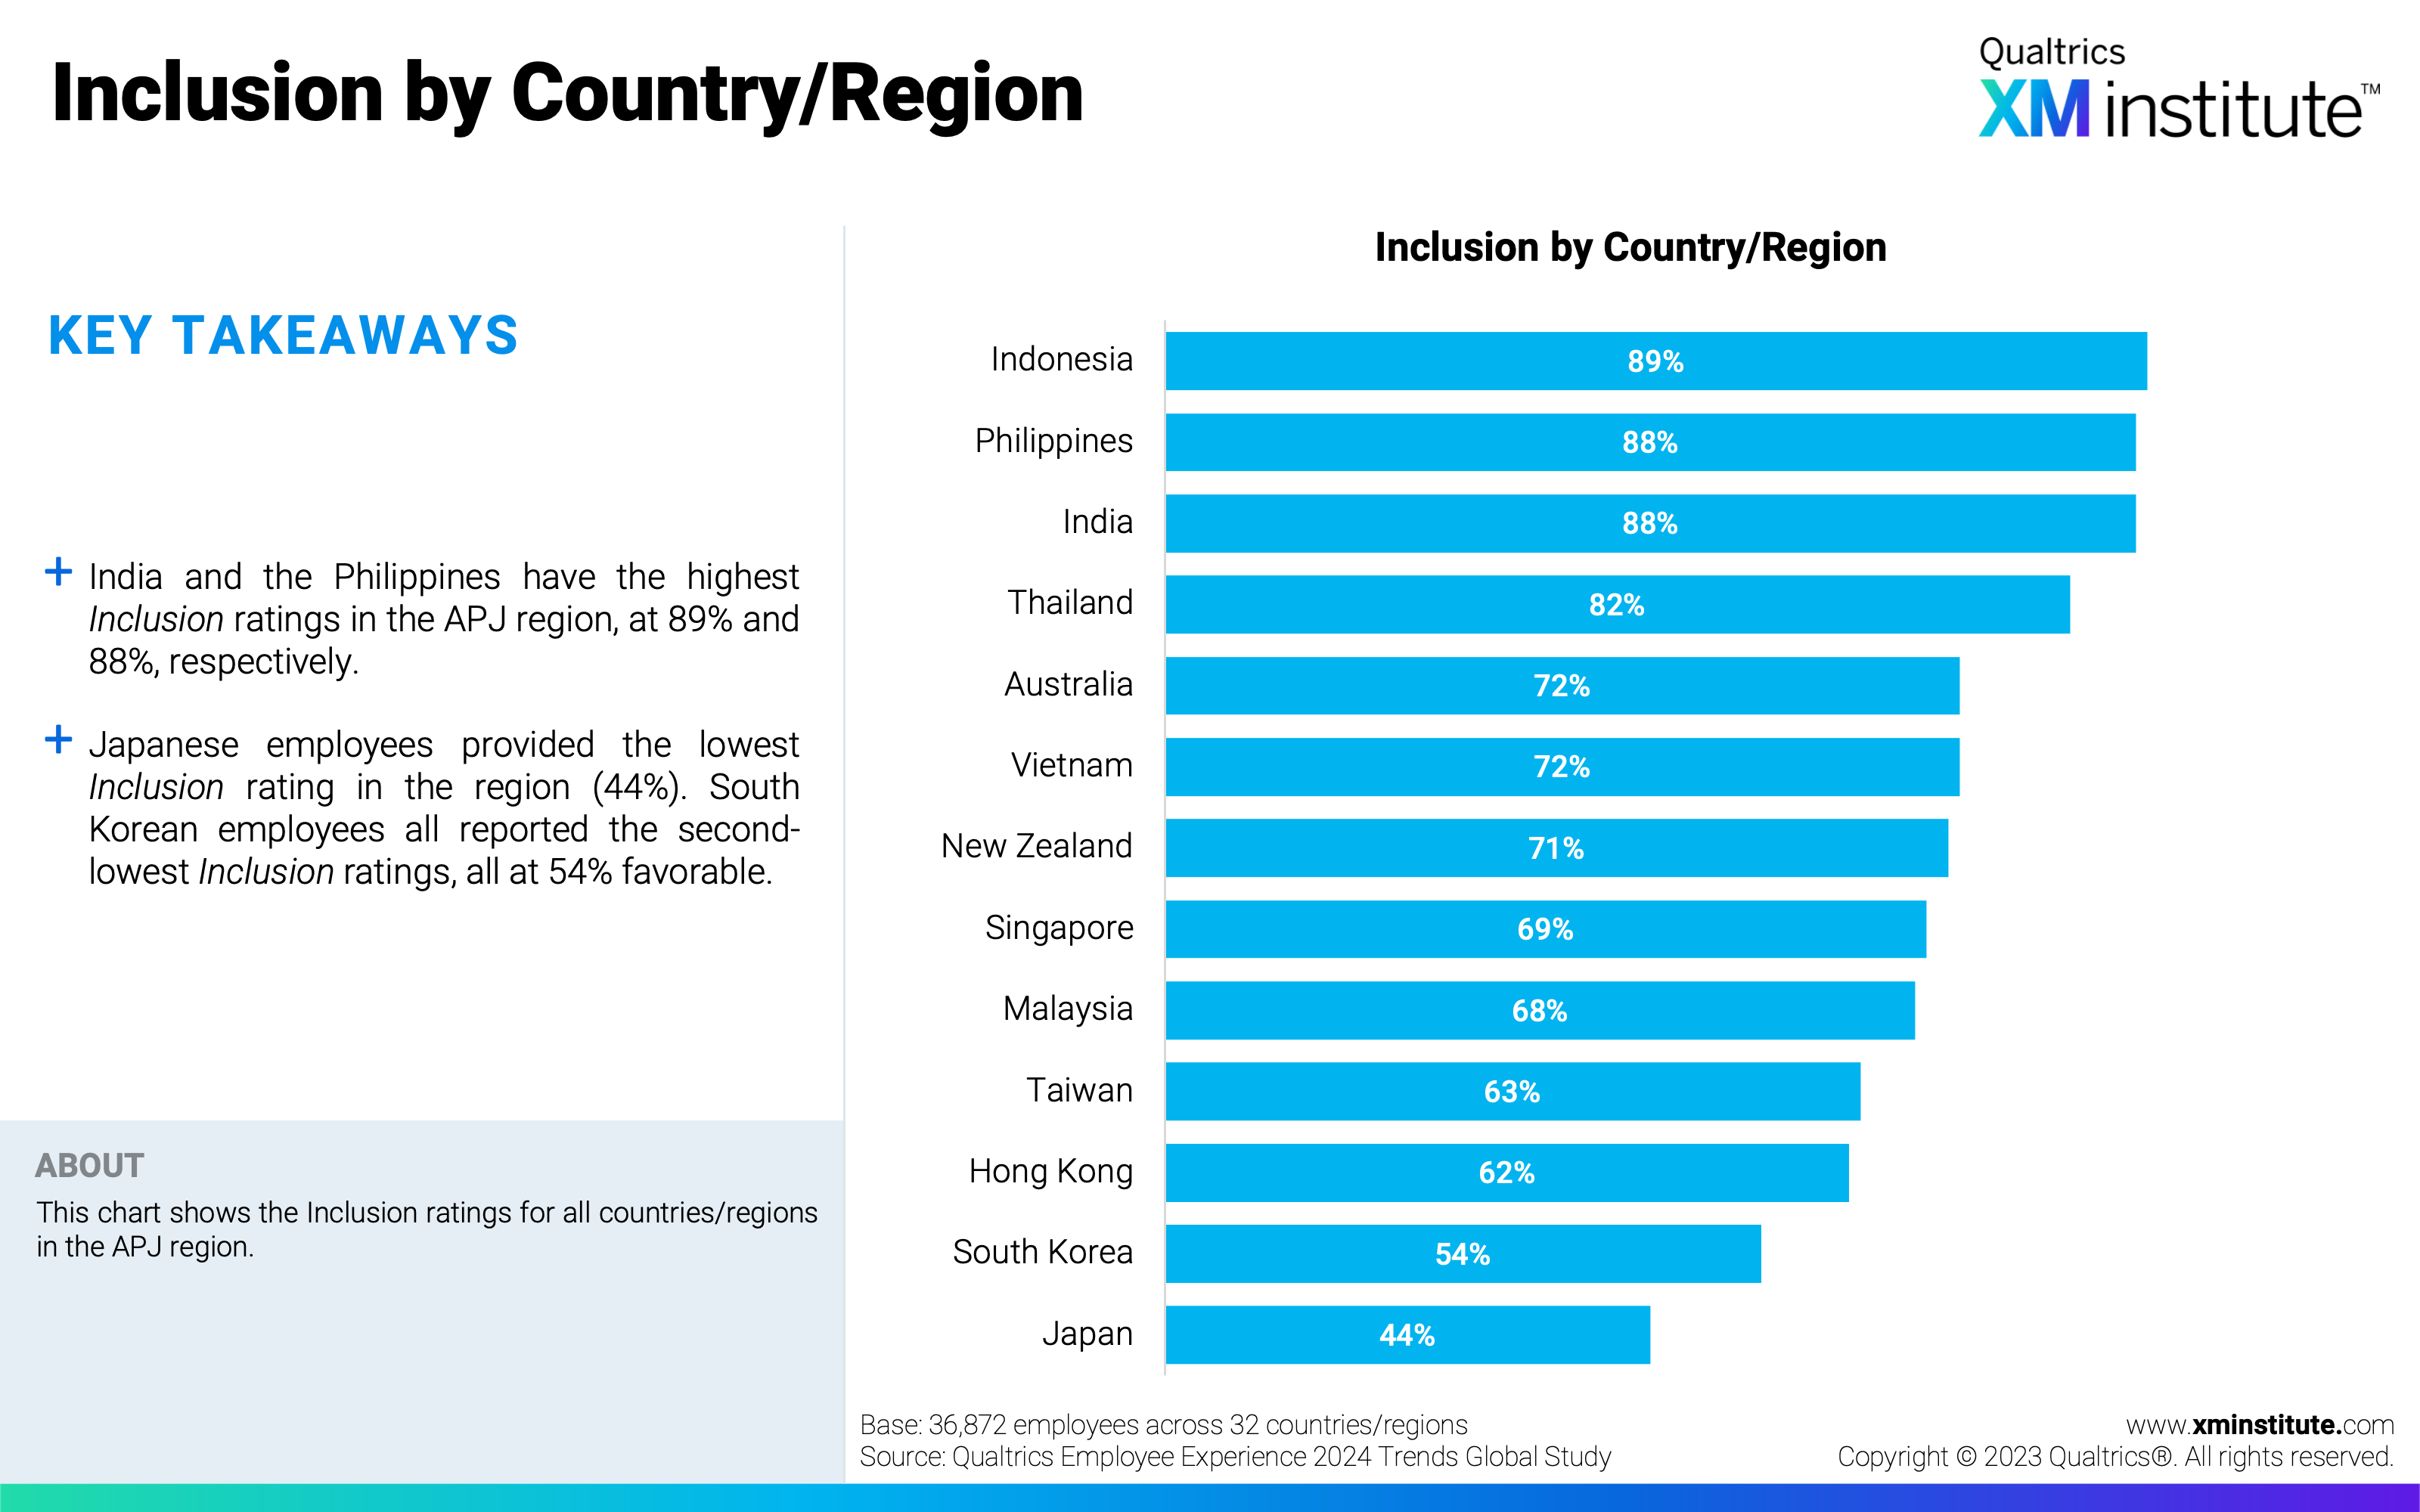
- Inclusion by Country/Region
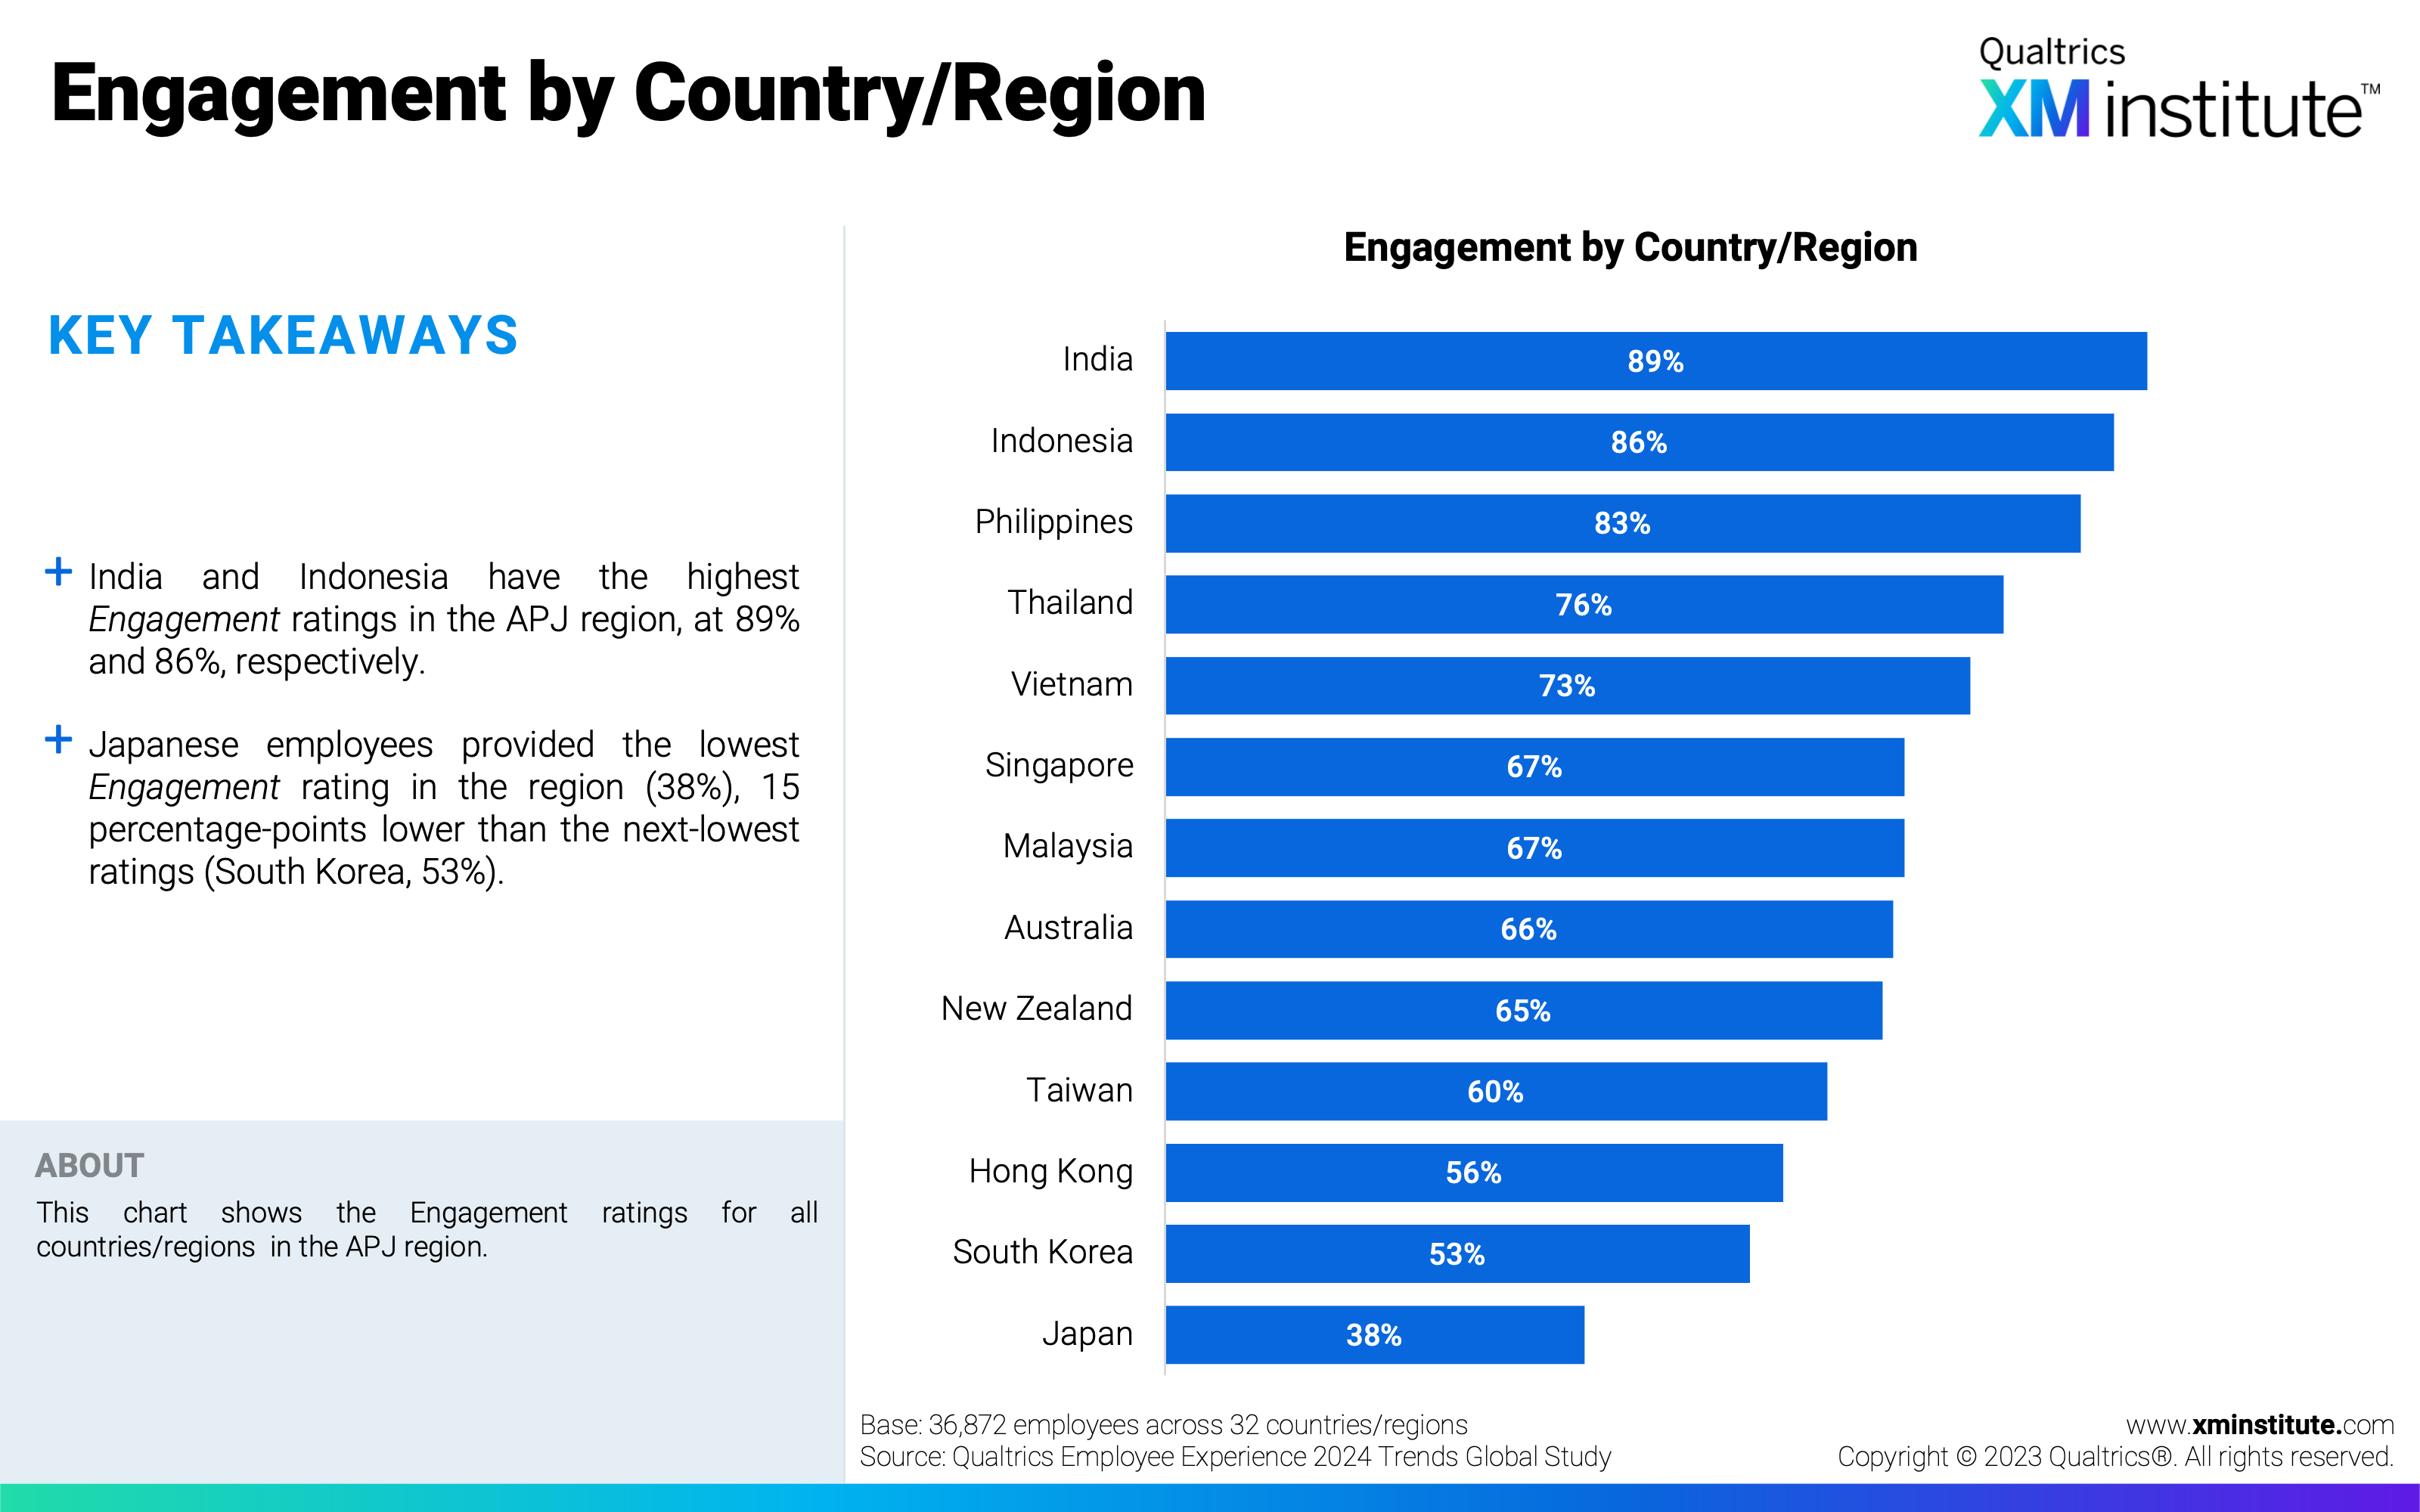
- Engagement by Country/Region
- Intent to Stay by Country/Region
- Experience v Expectations by Country/Region
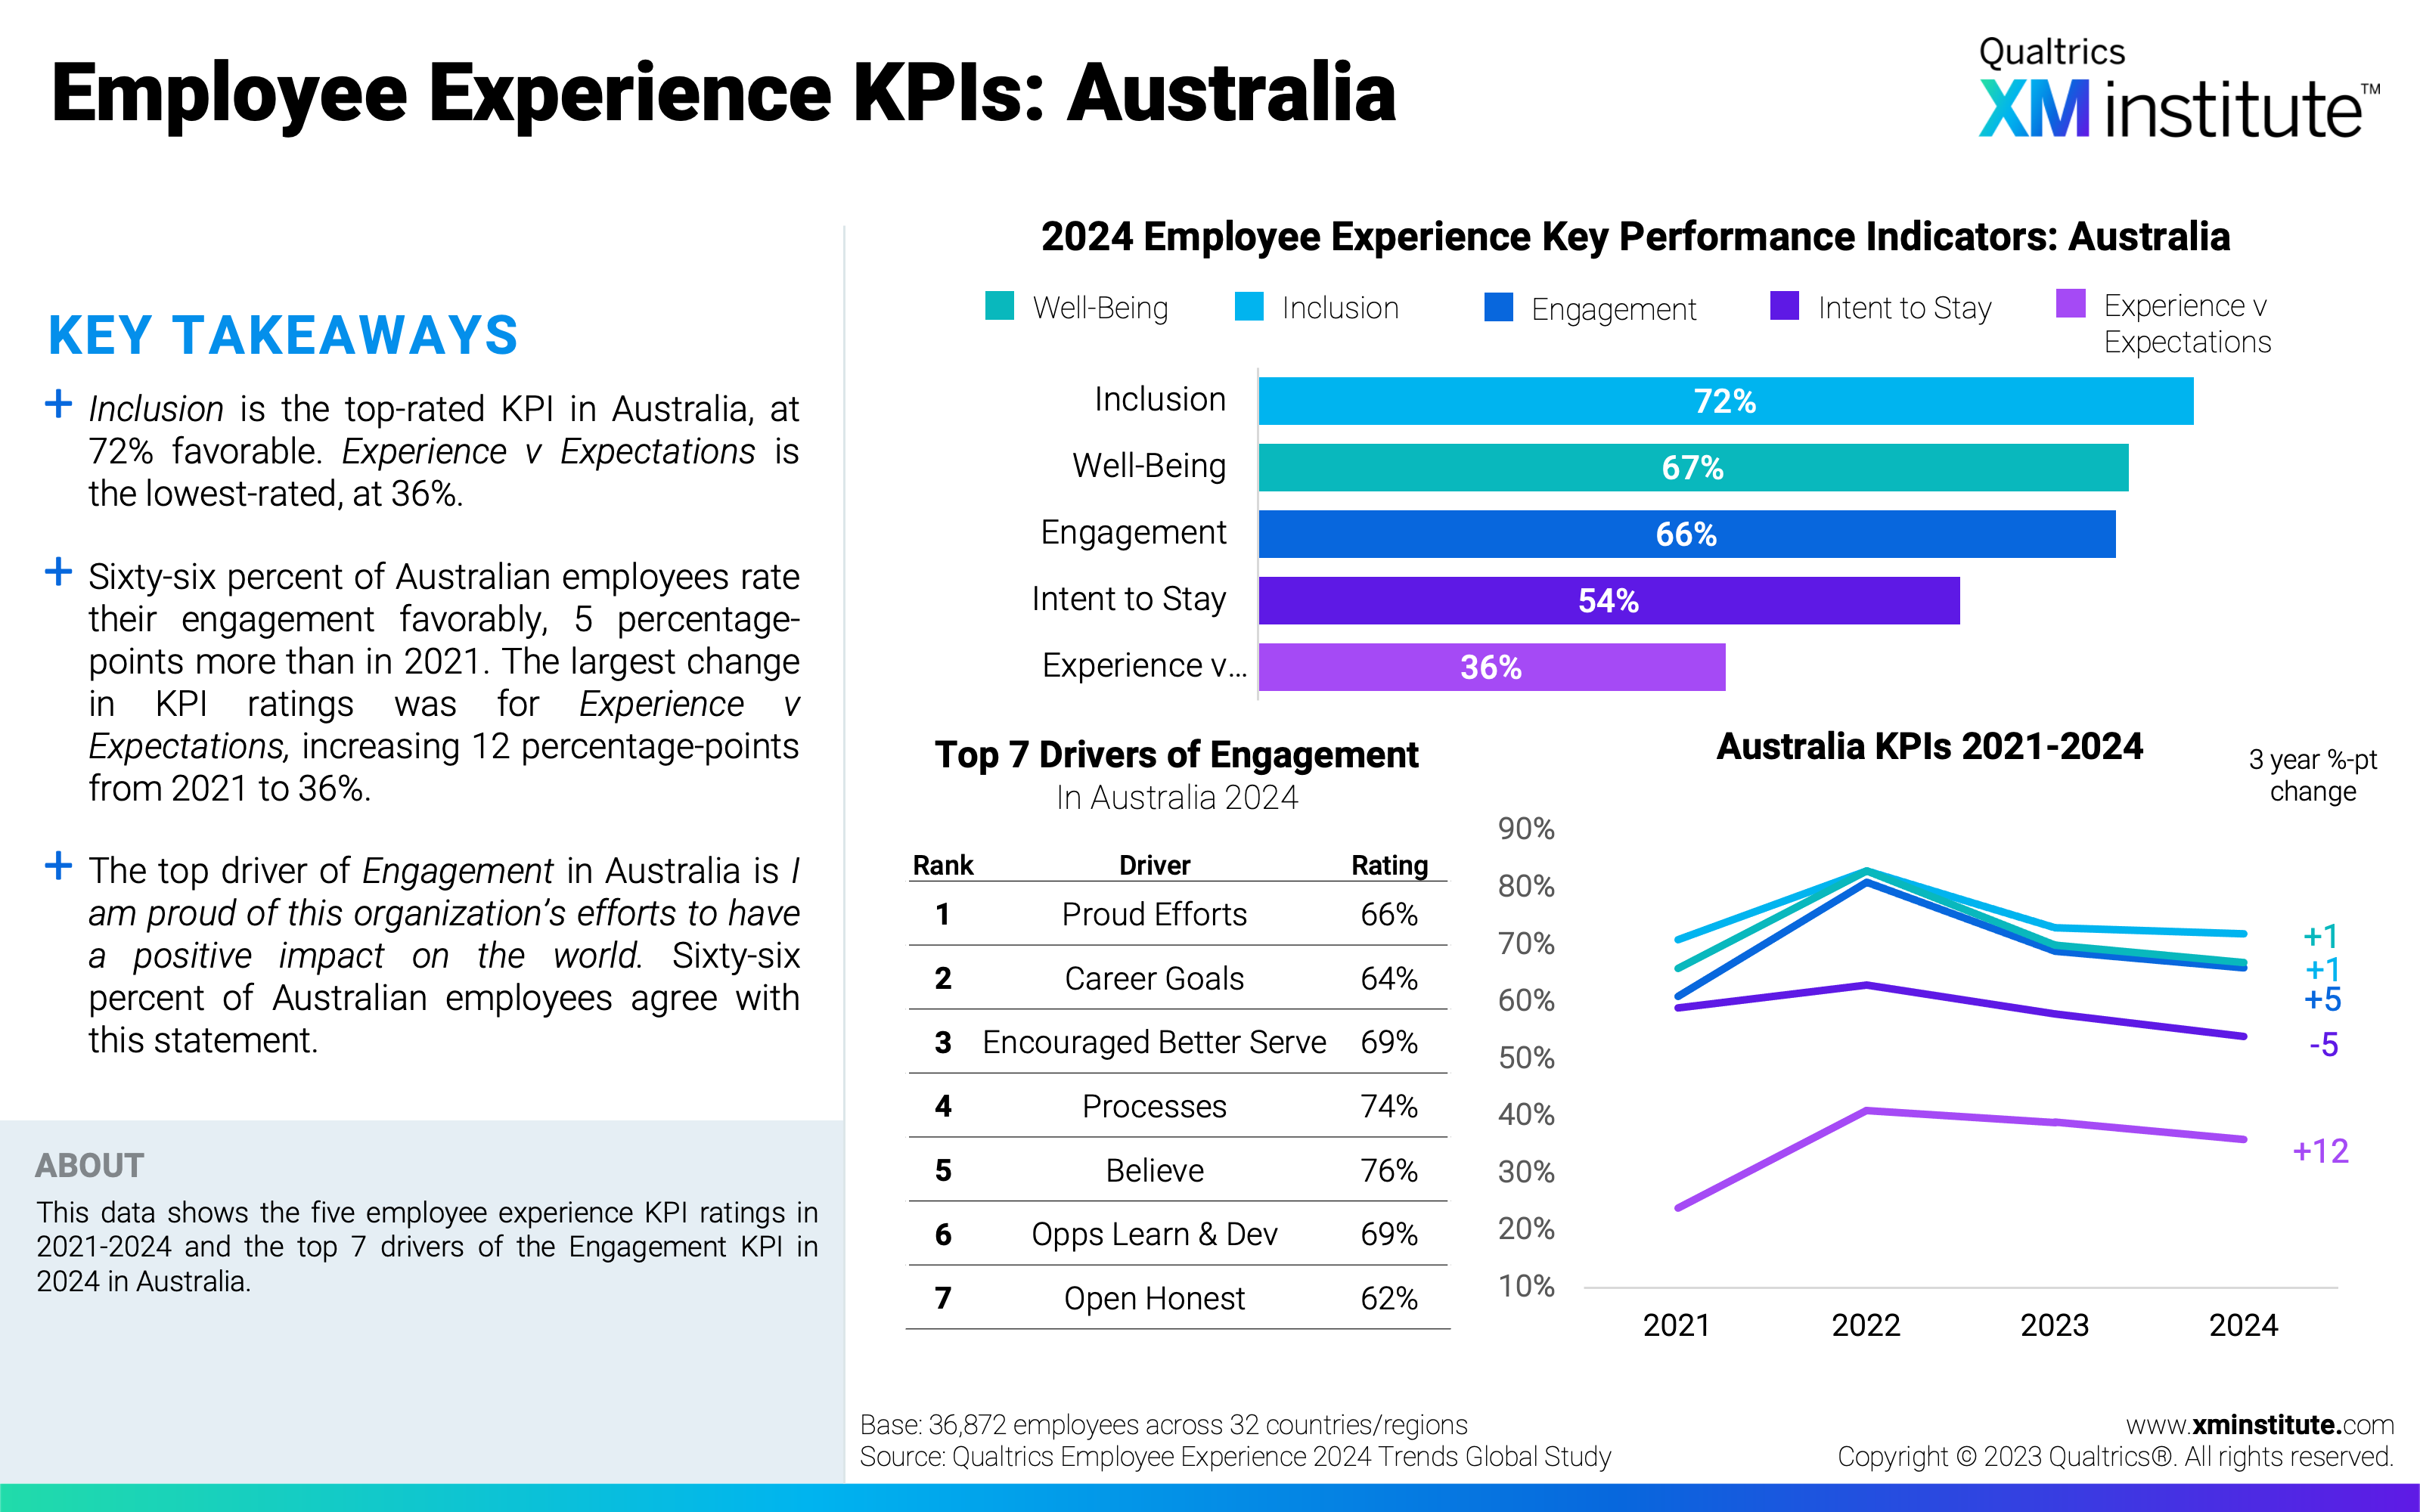
- Employee Experience KPIs: Australia
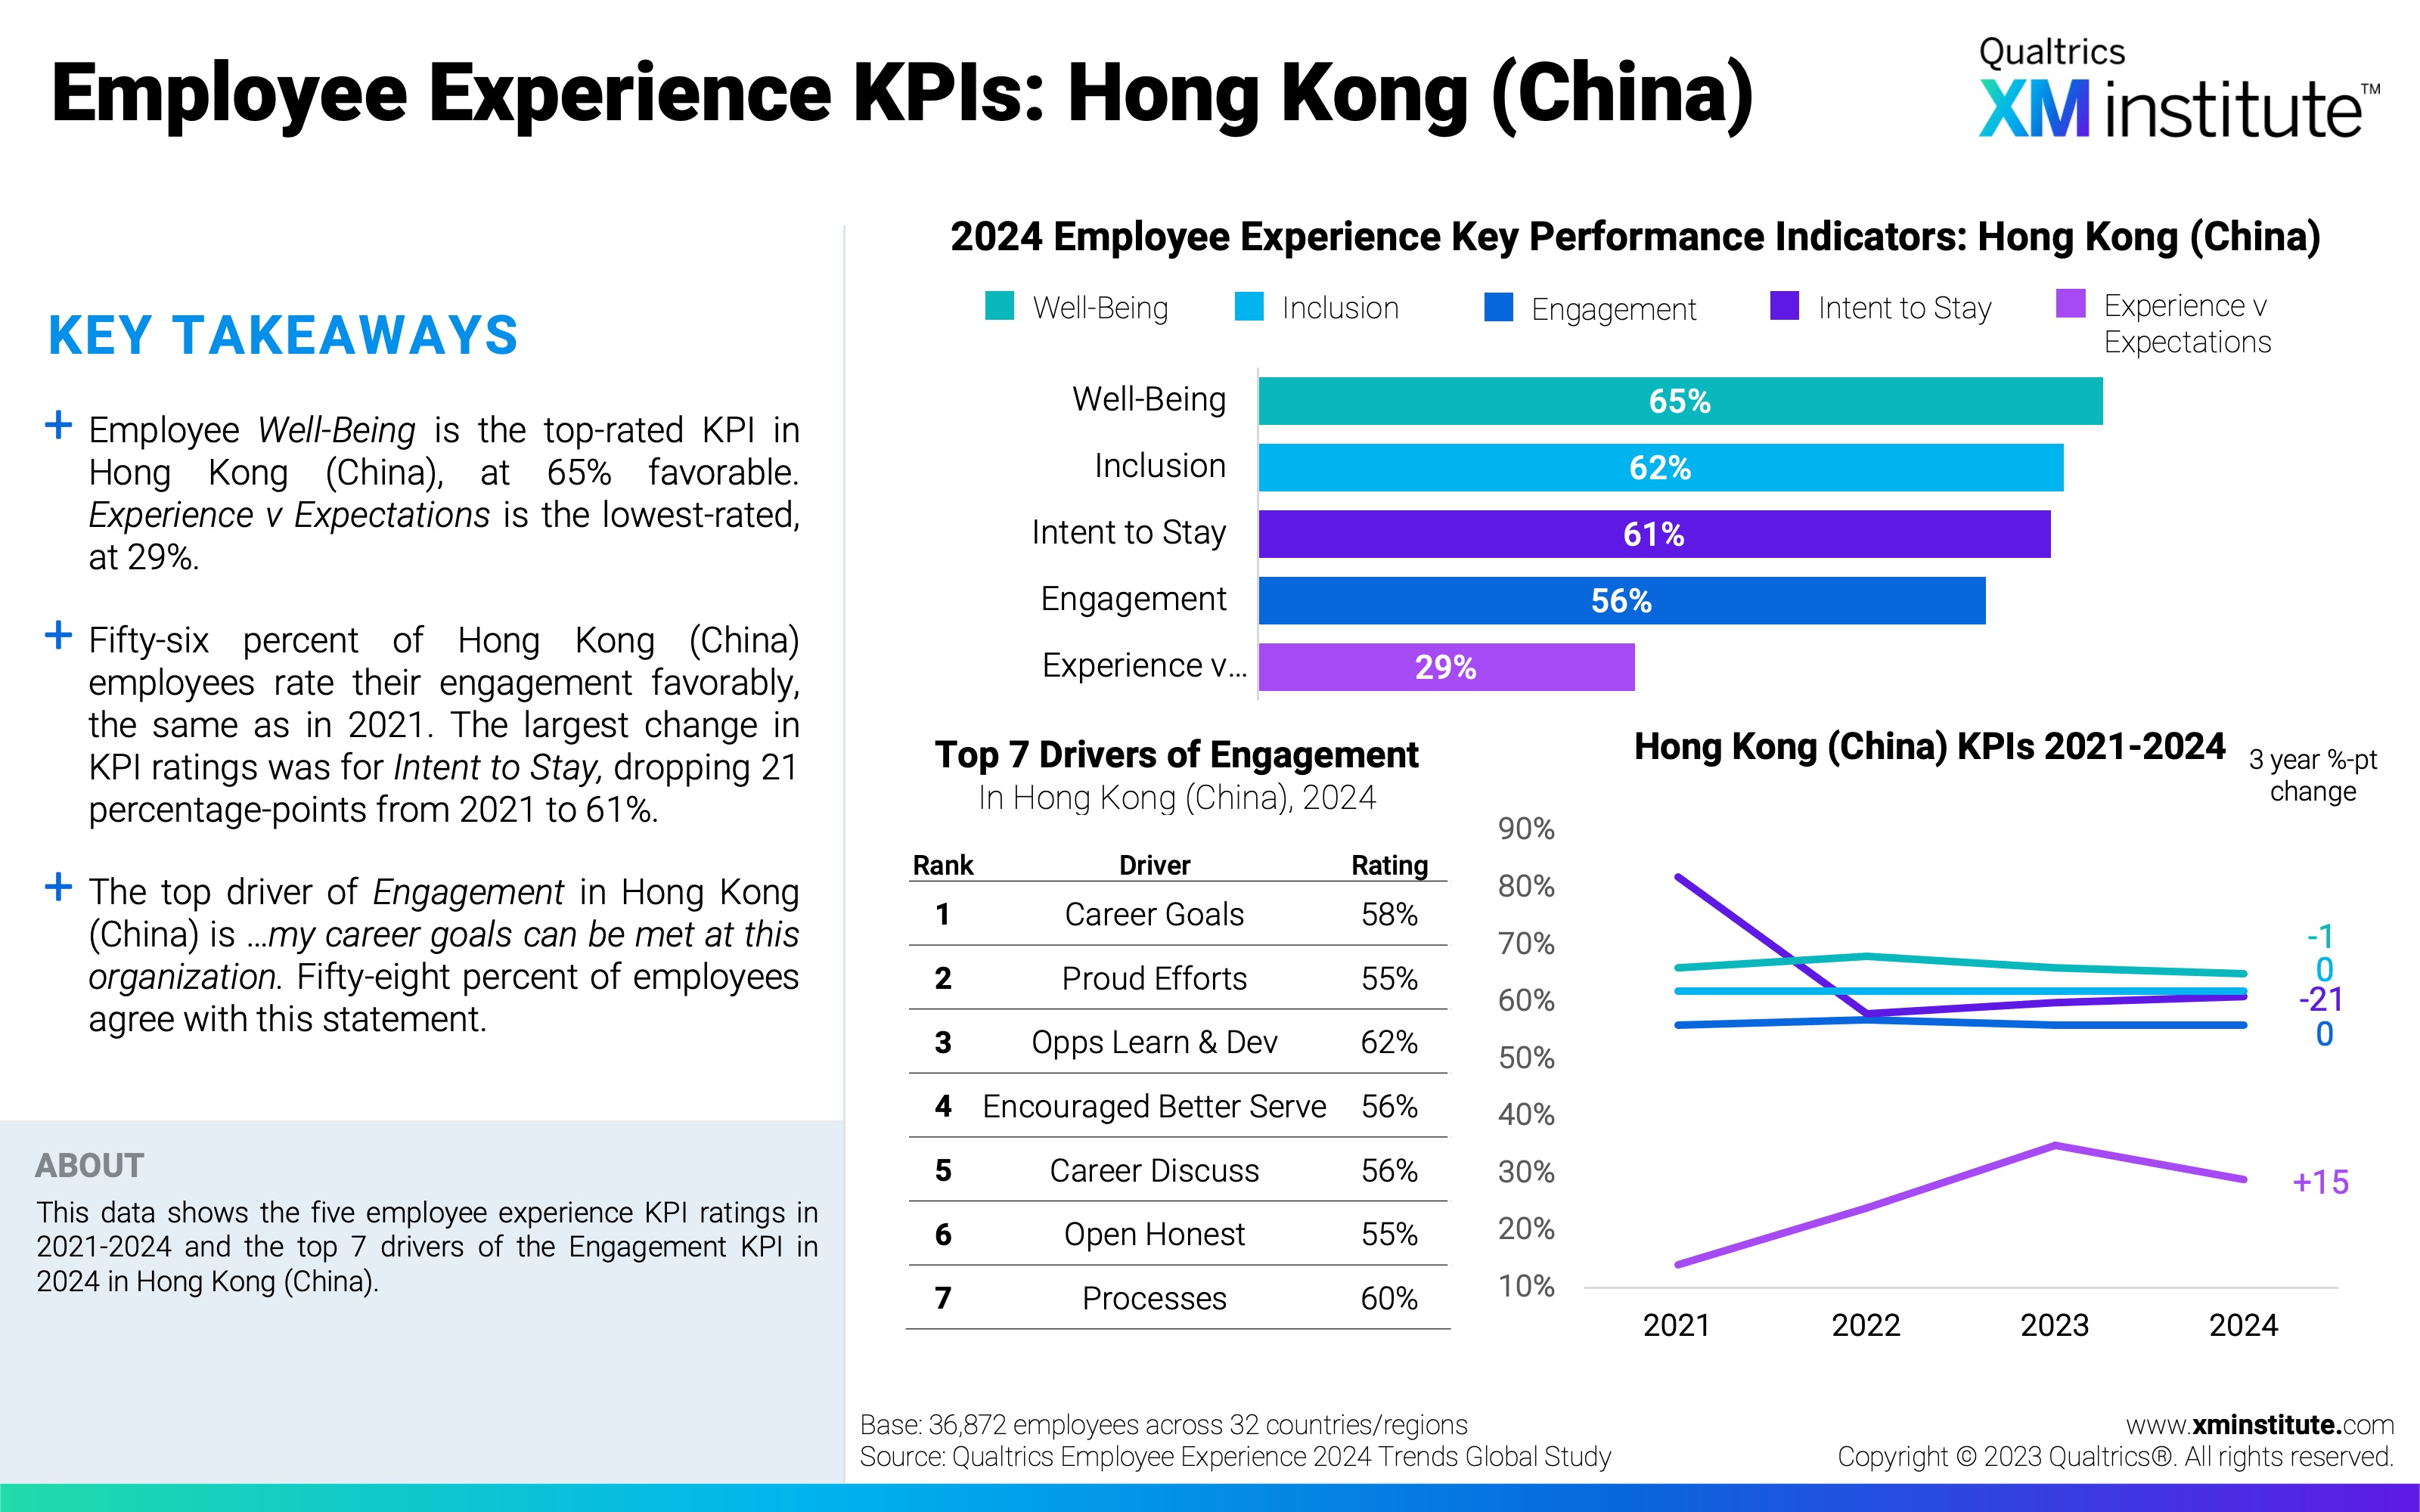
- Employee Experience KPIs: Hong Kong (China)
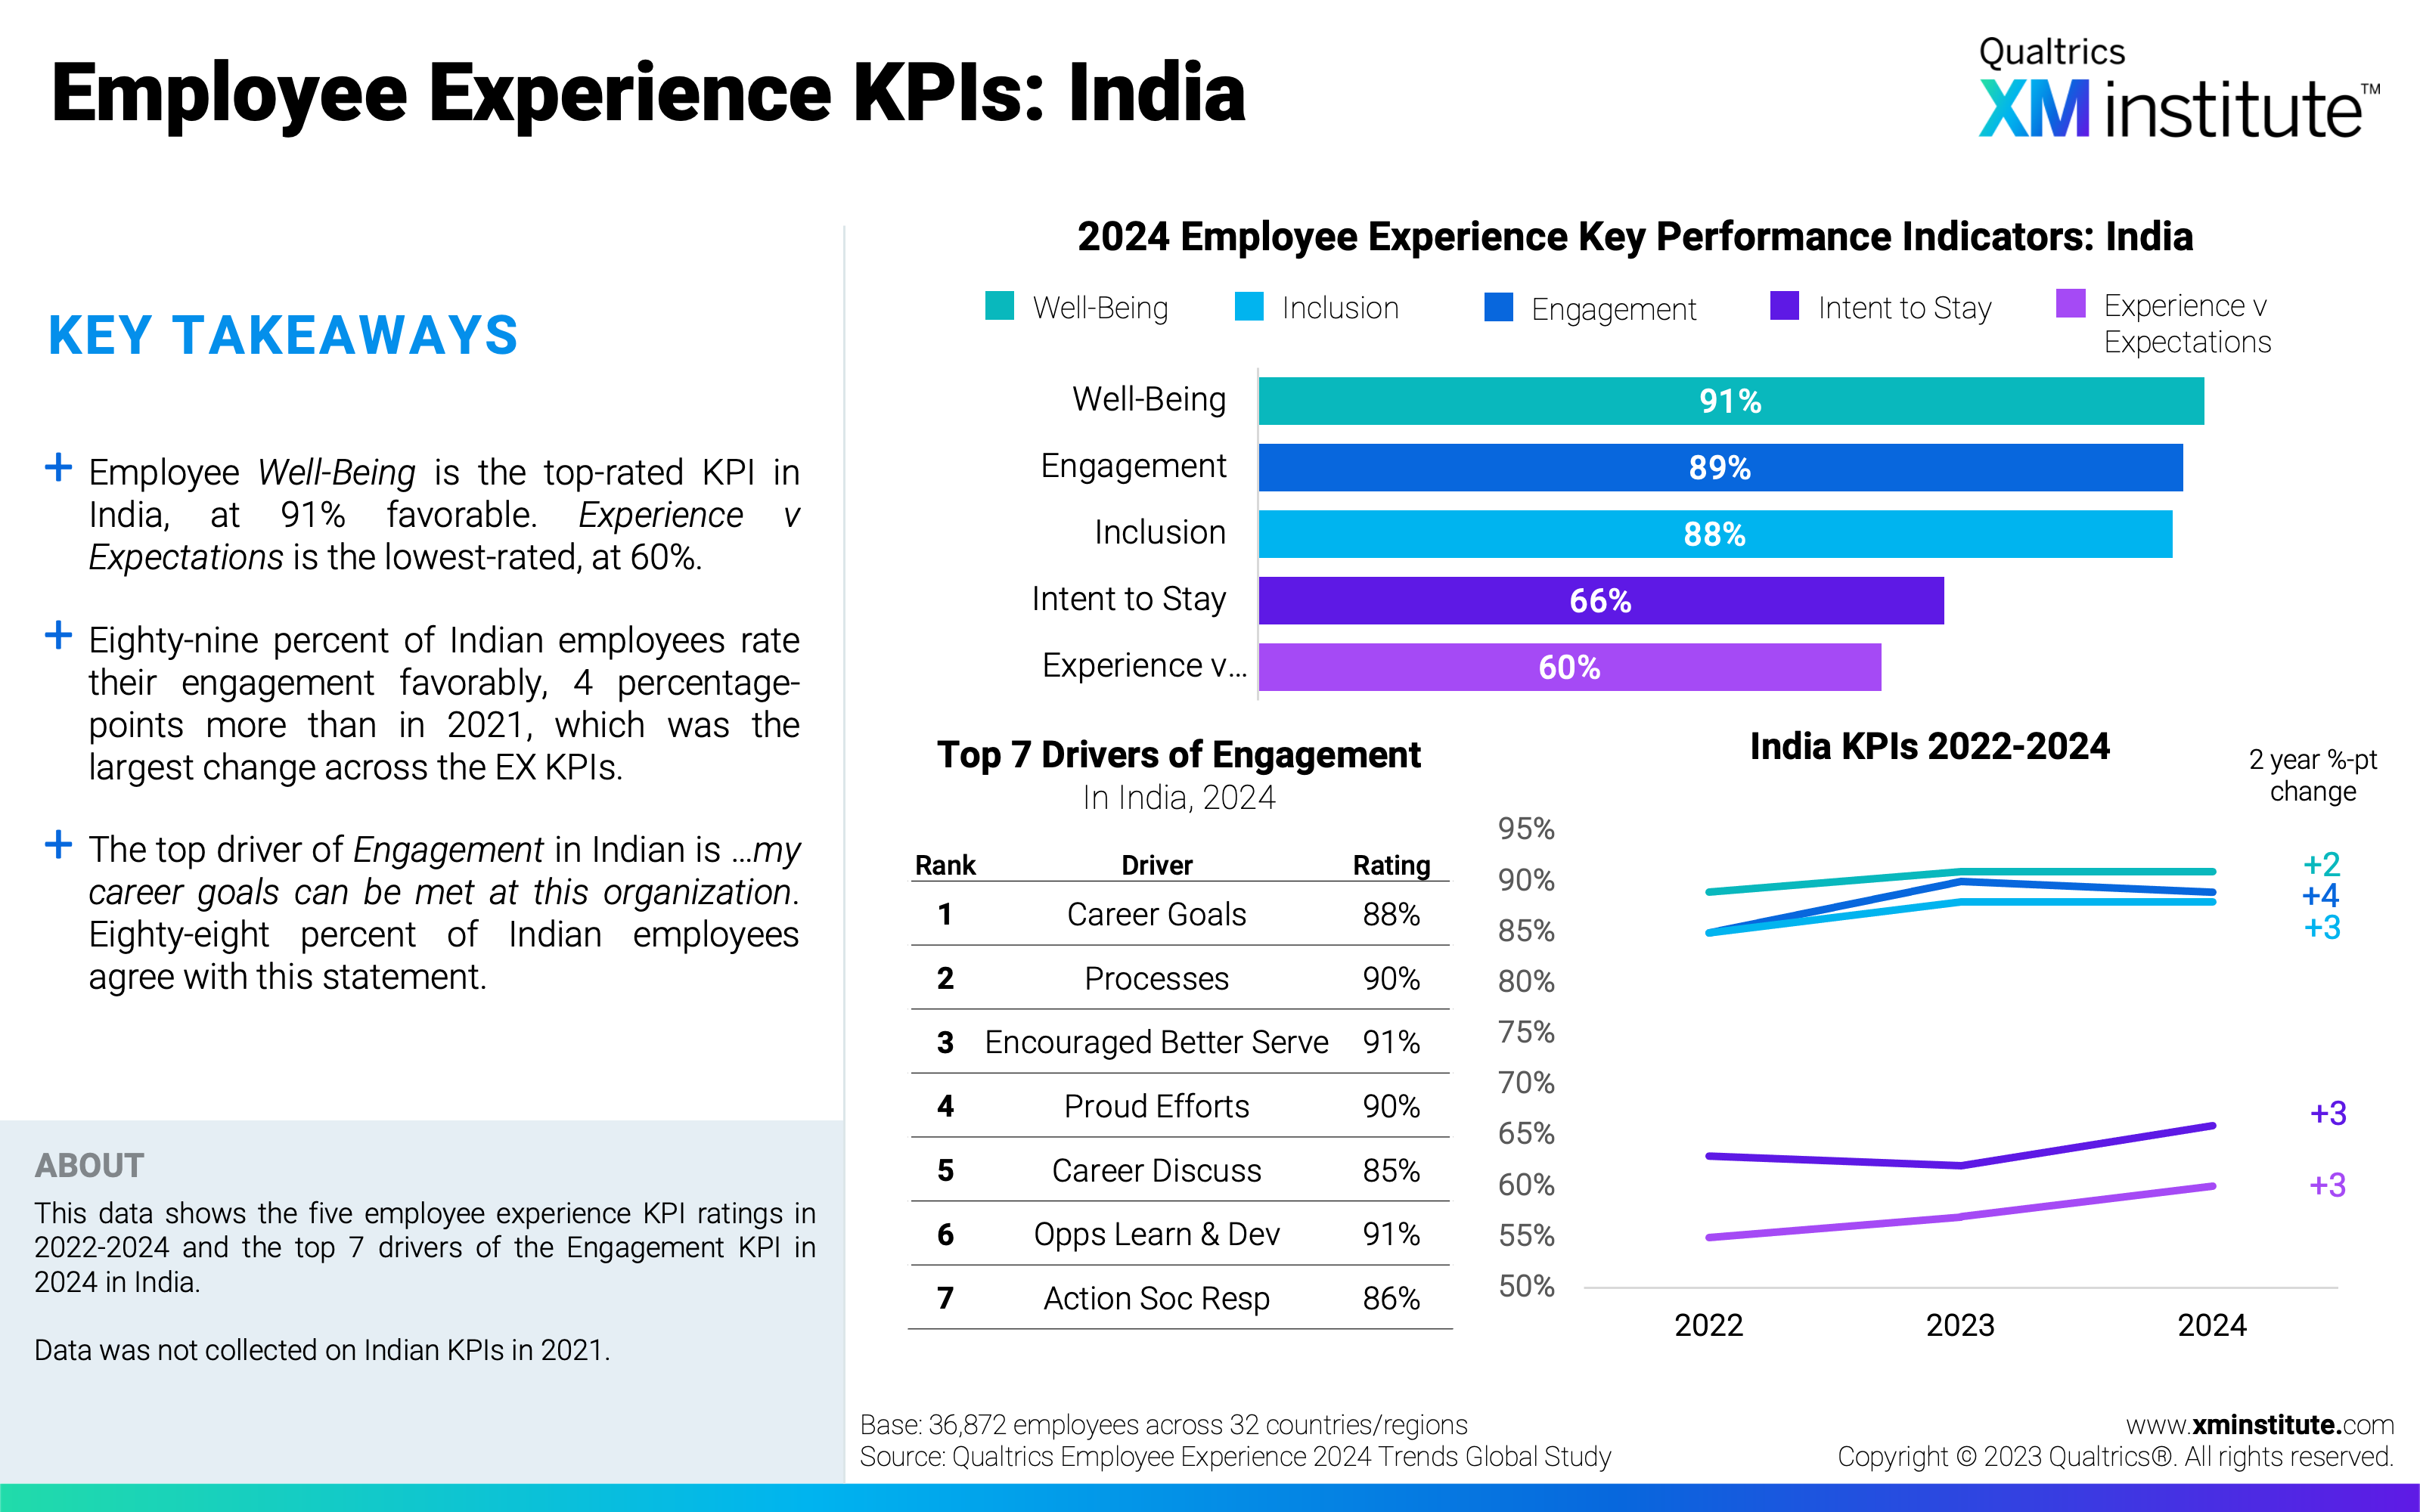
- Employee Experience KPIs: India
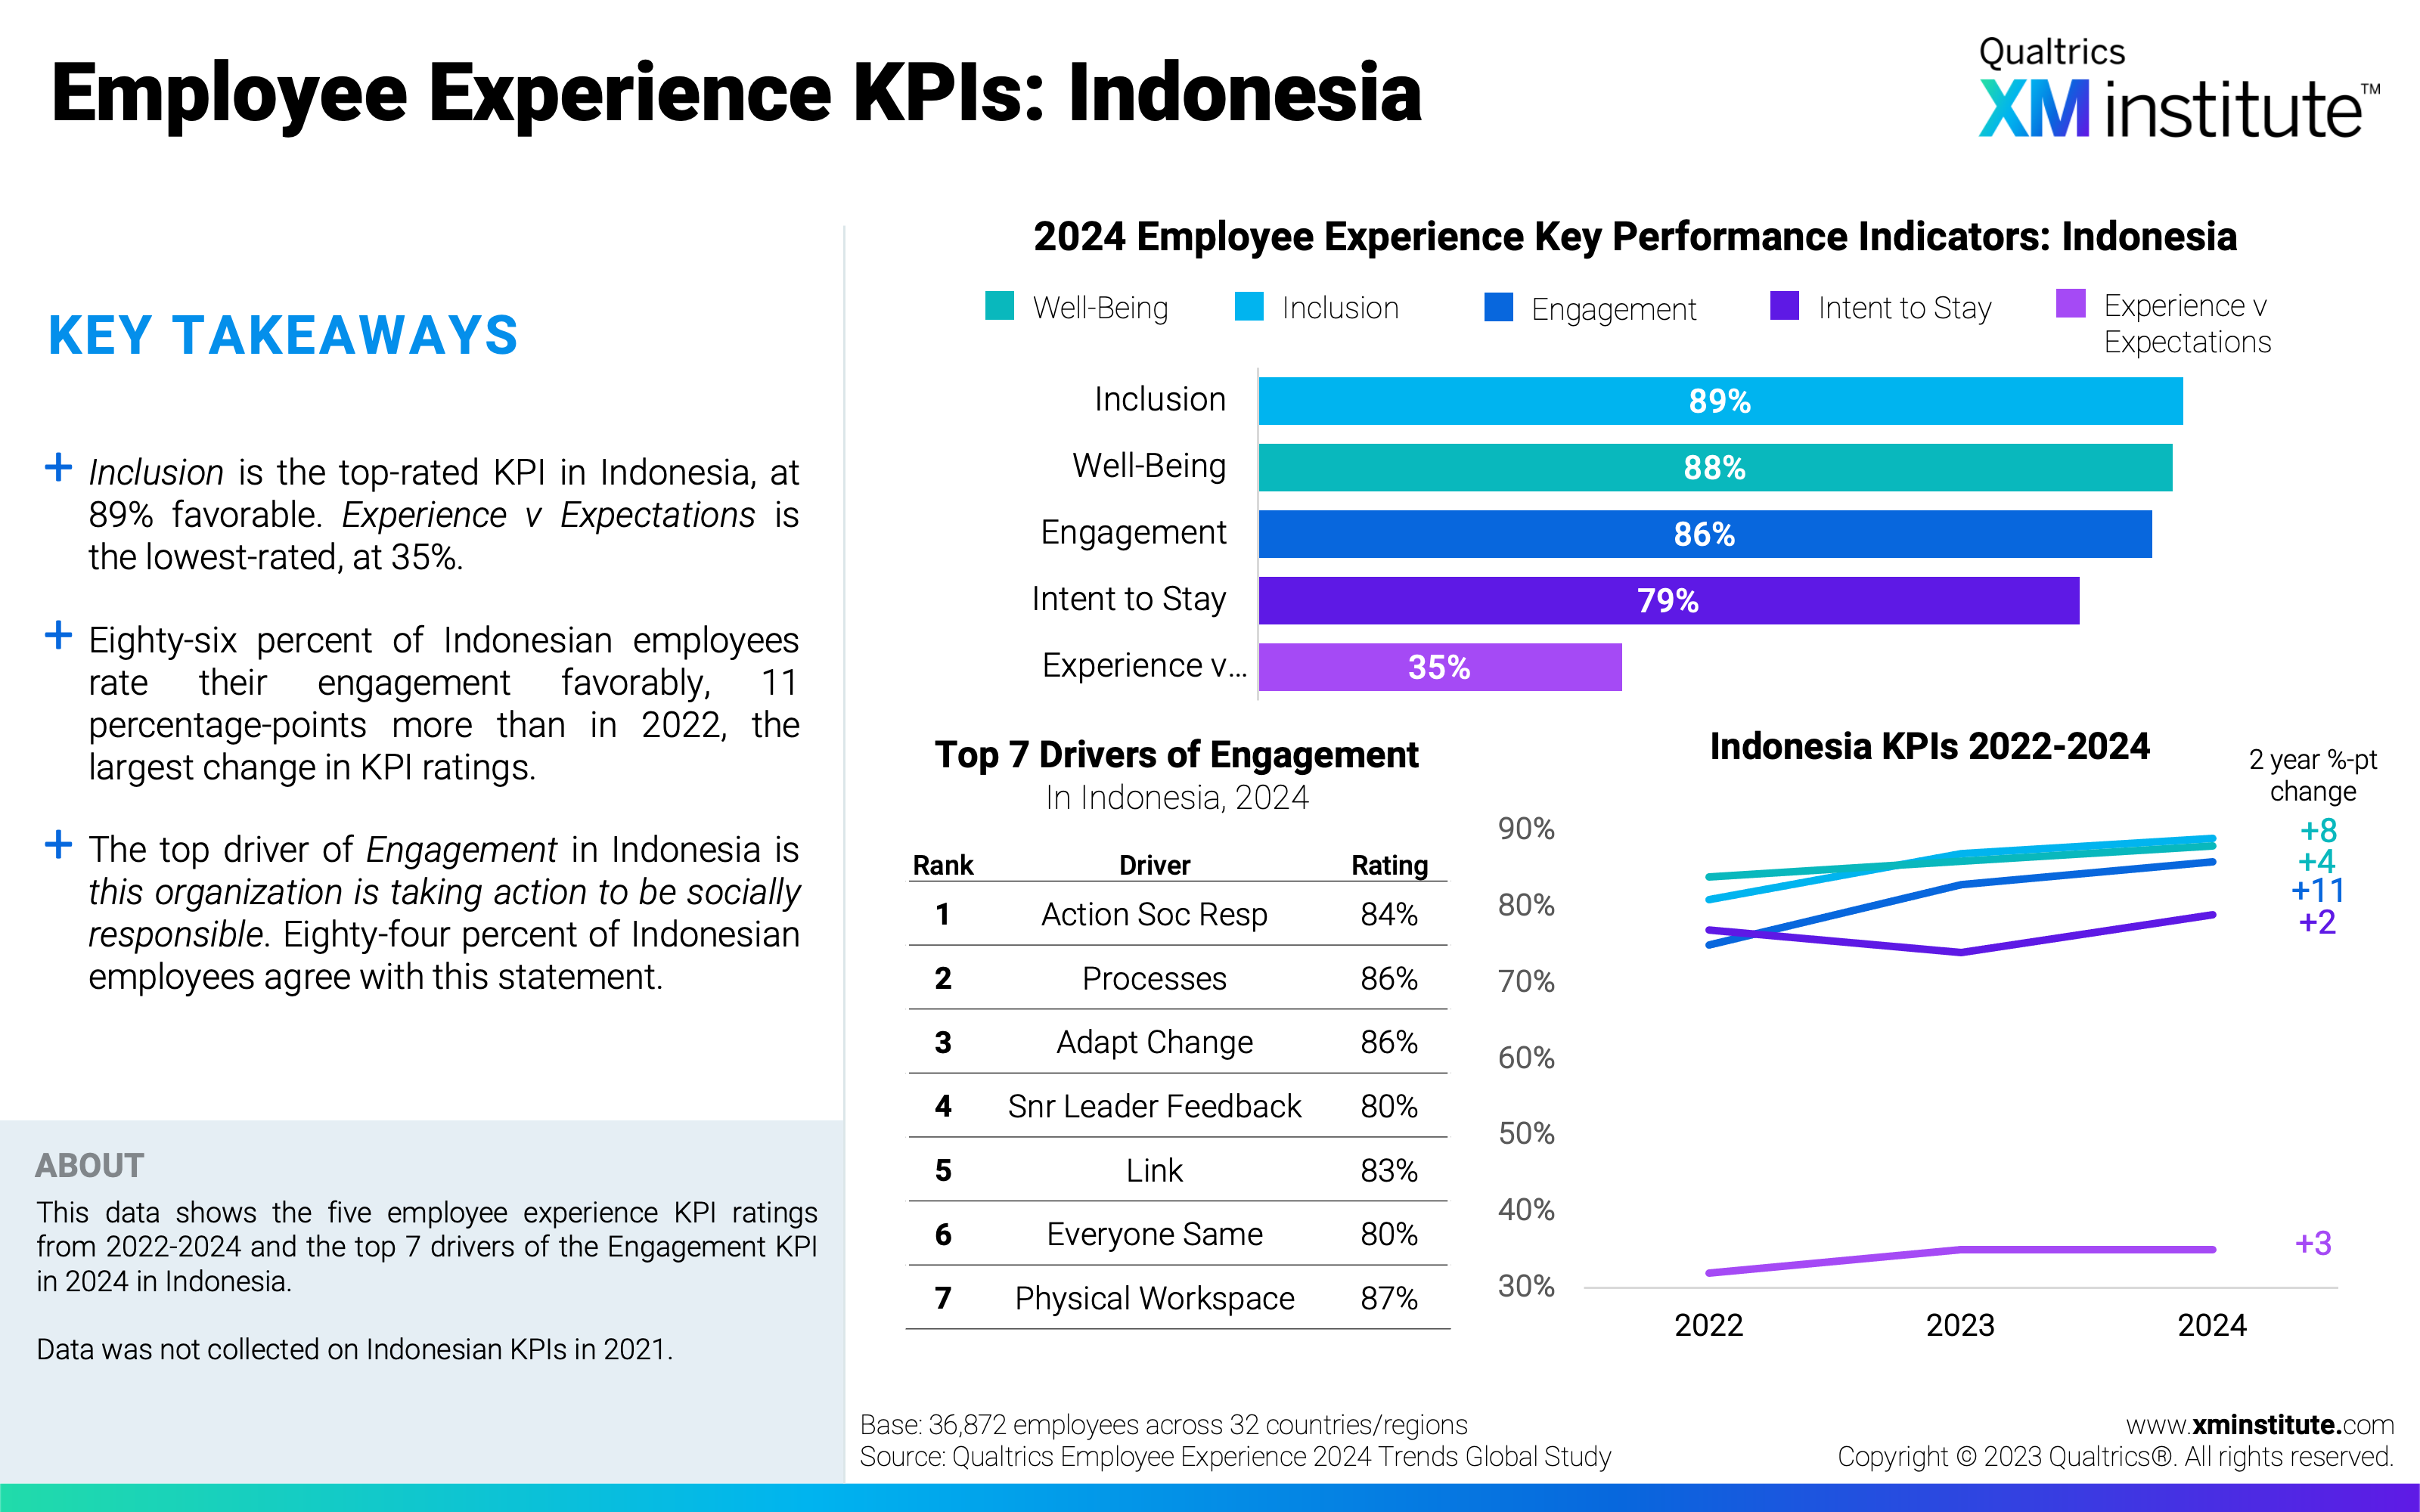
- Employee Experience KPIs: Indonesia
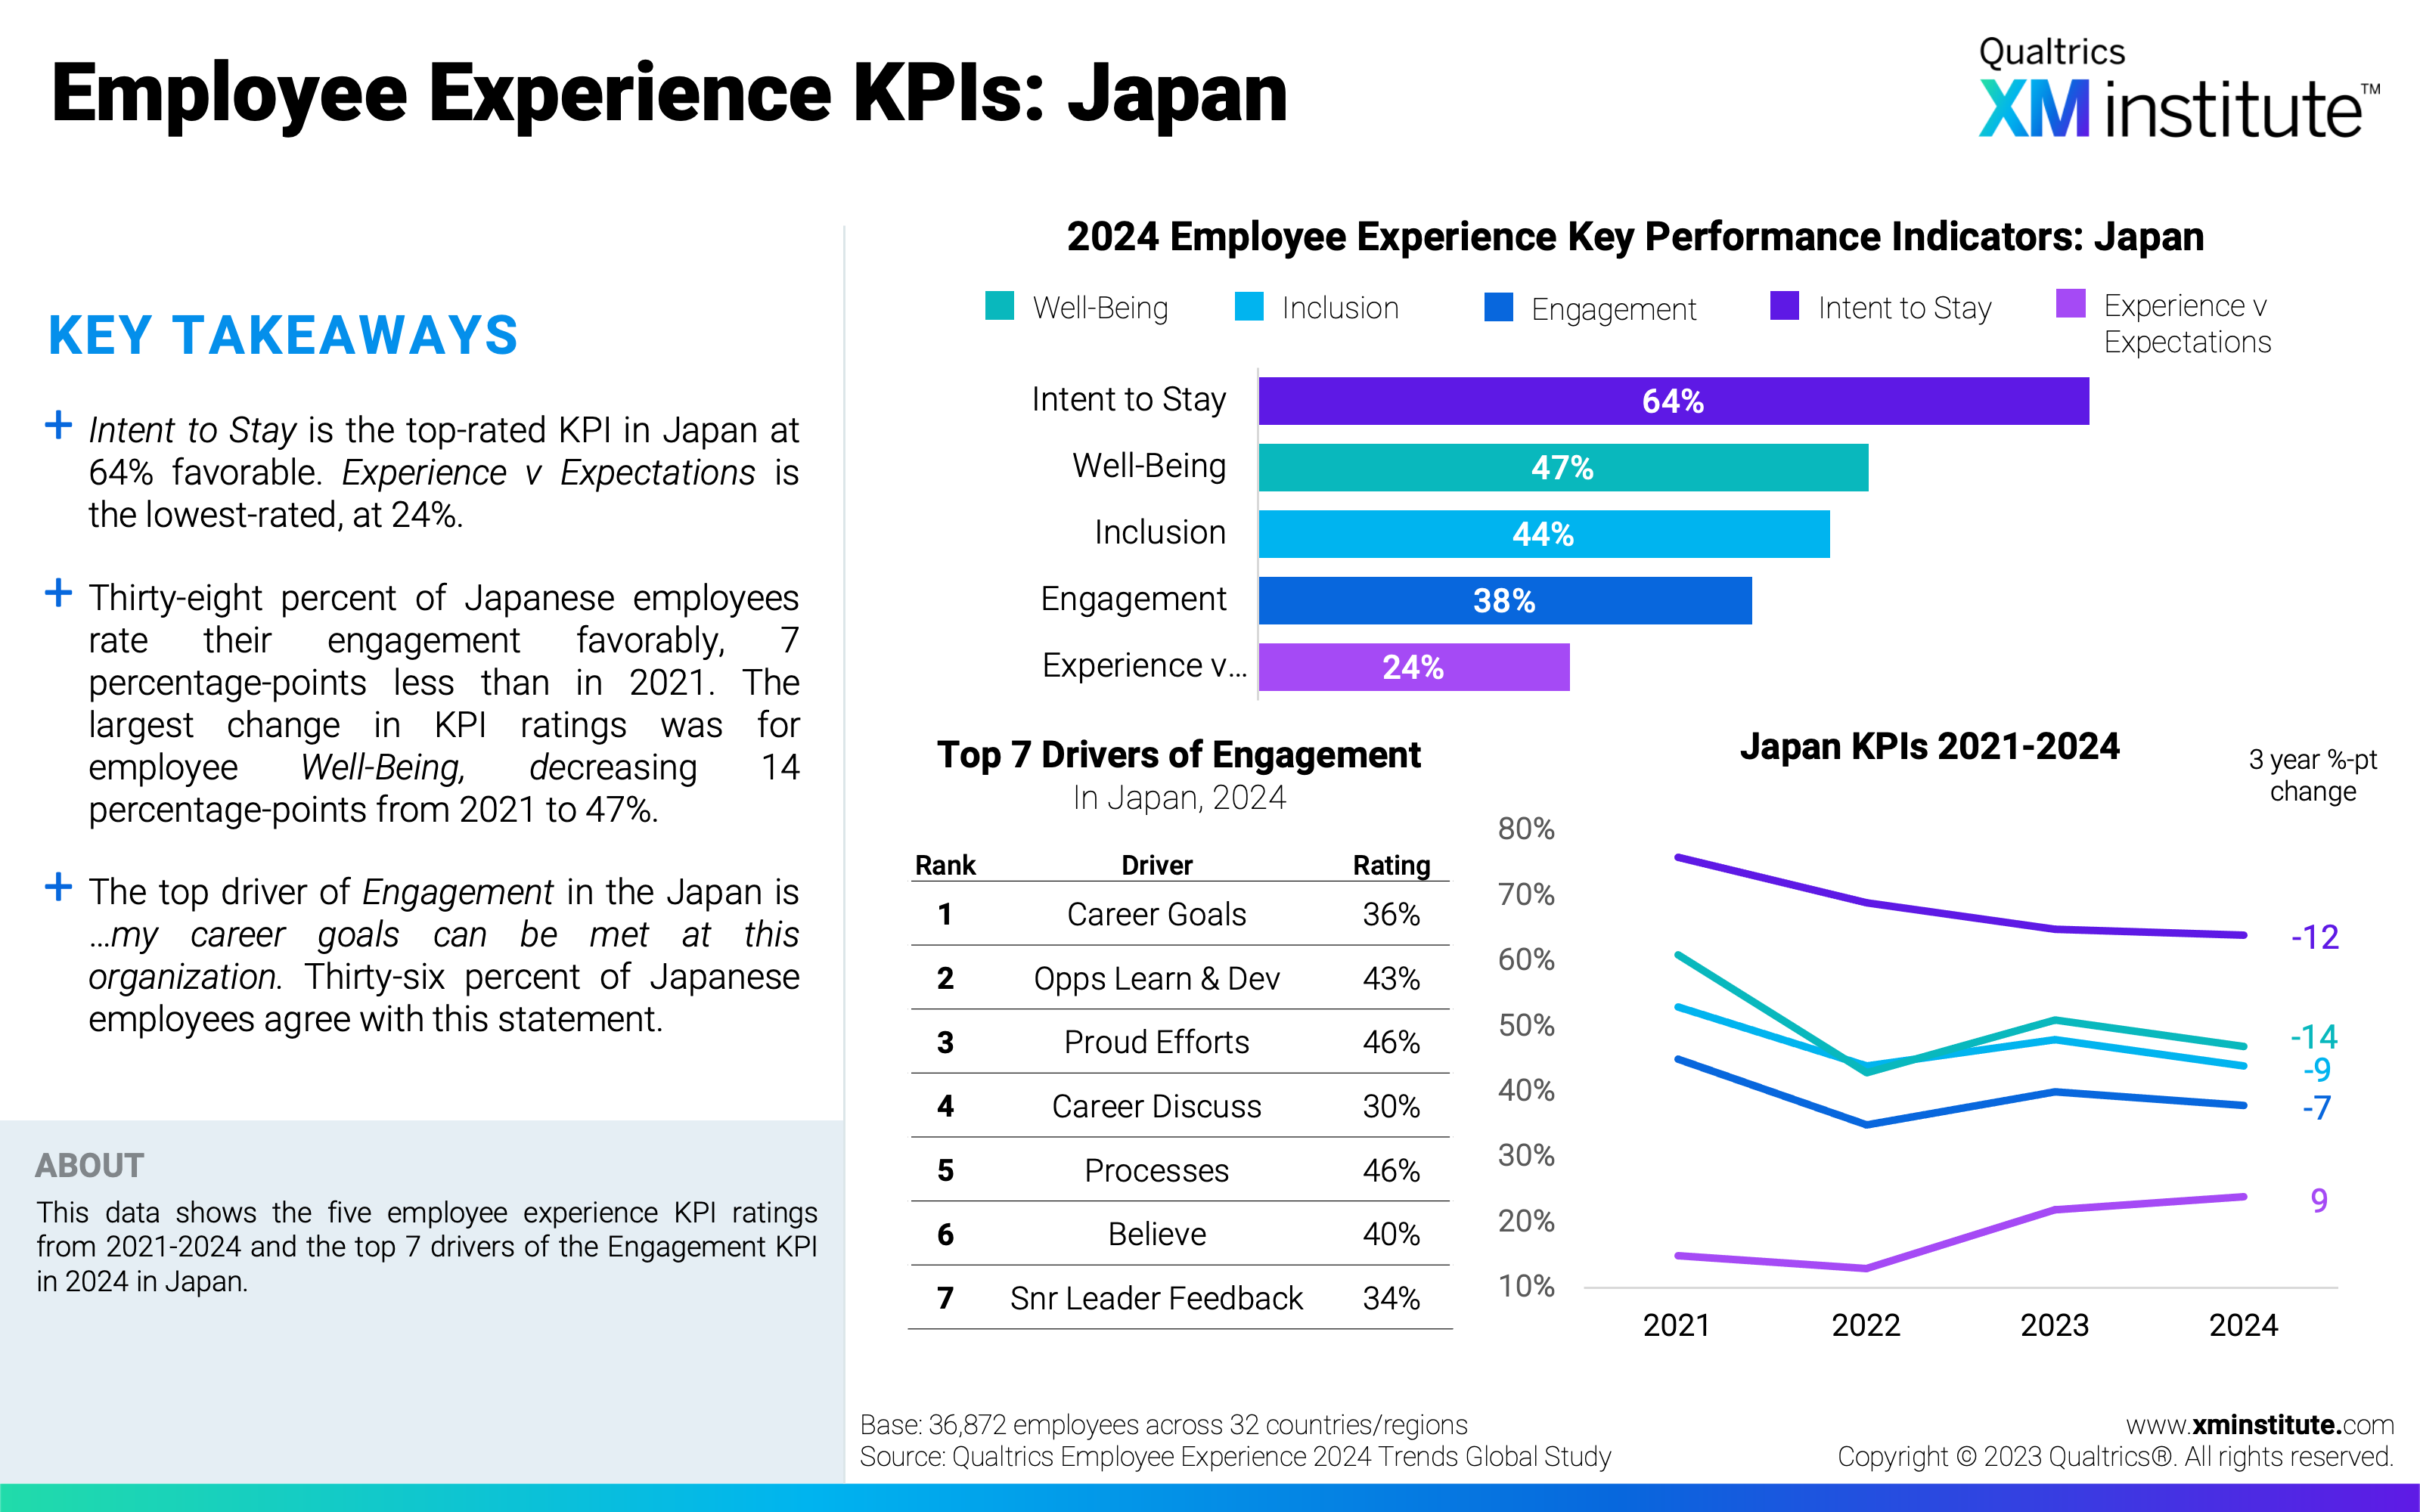
- Employee Experience KPIs: Japan
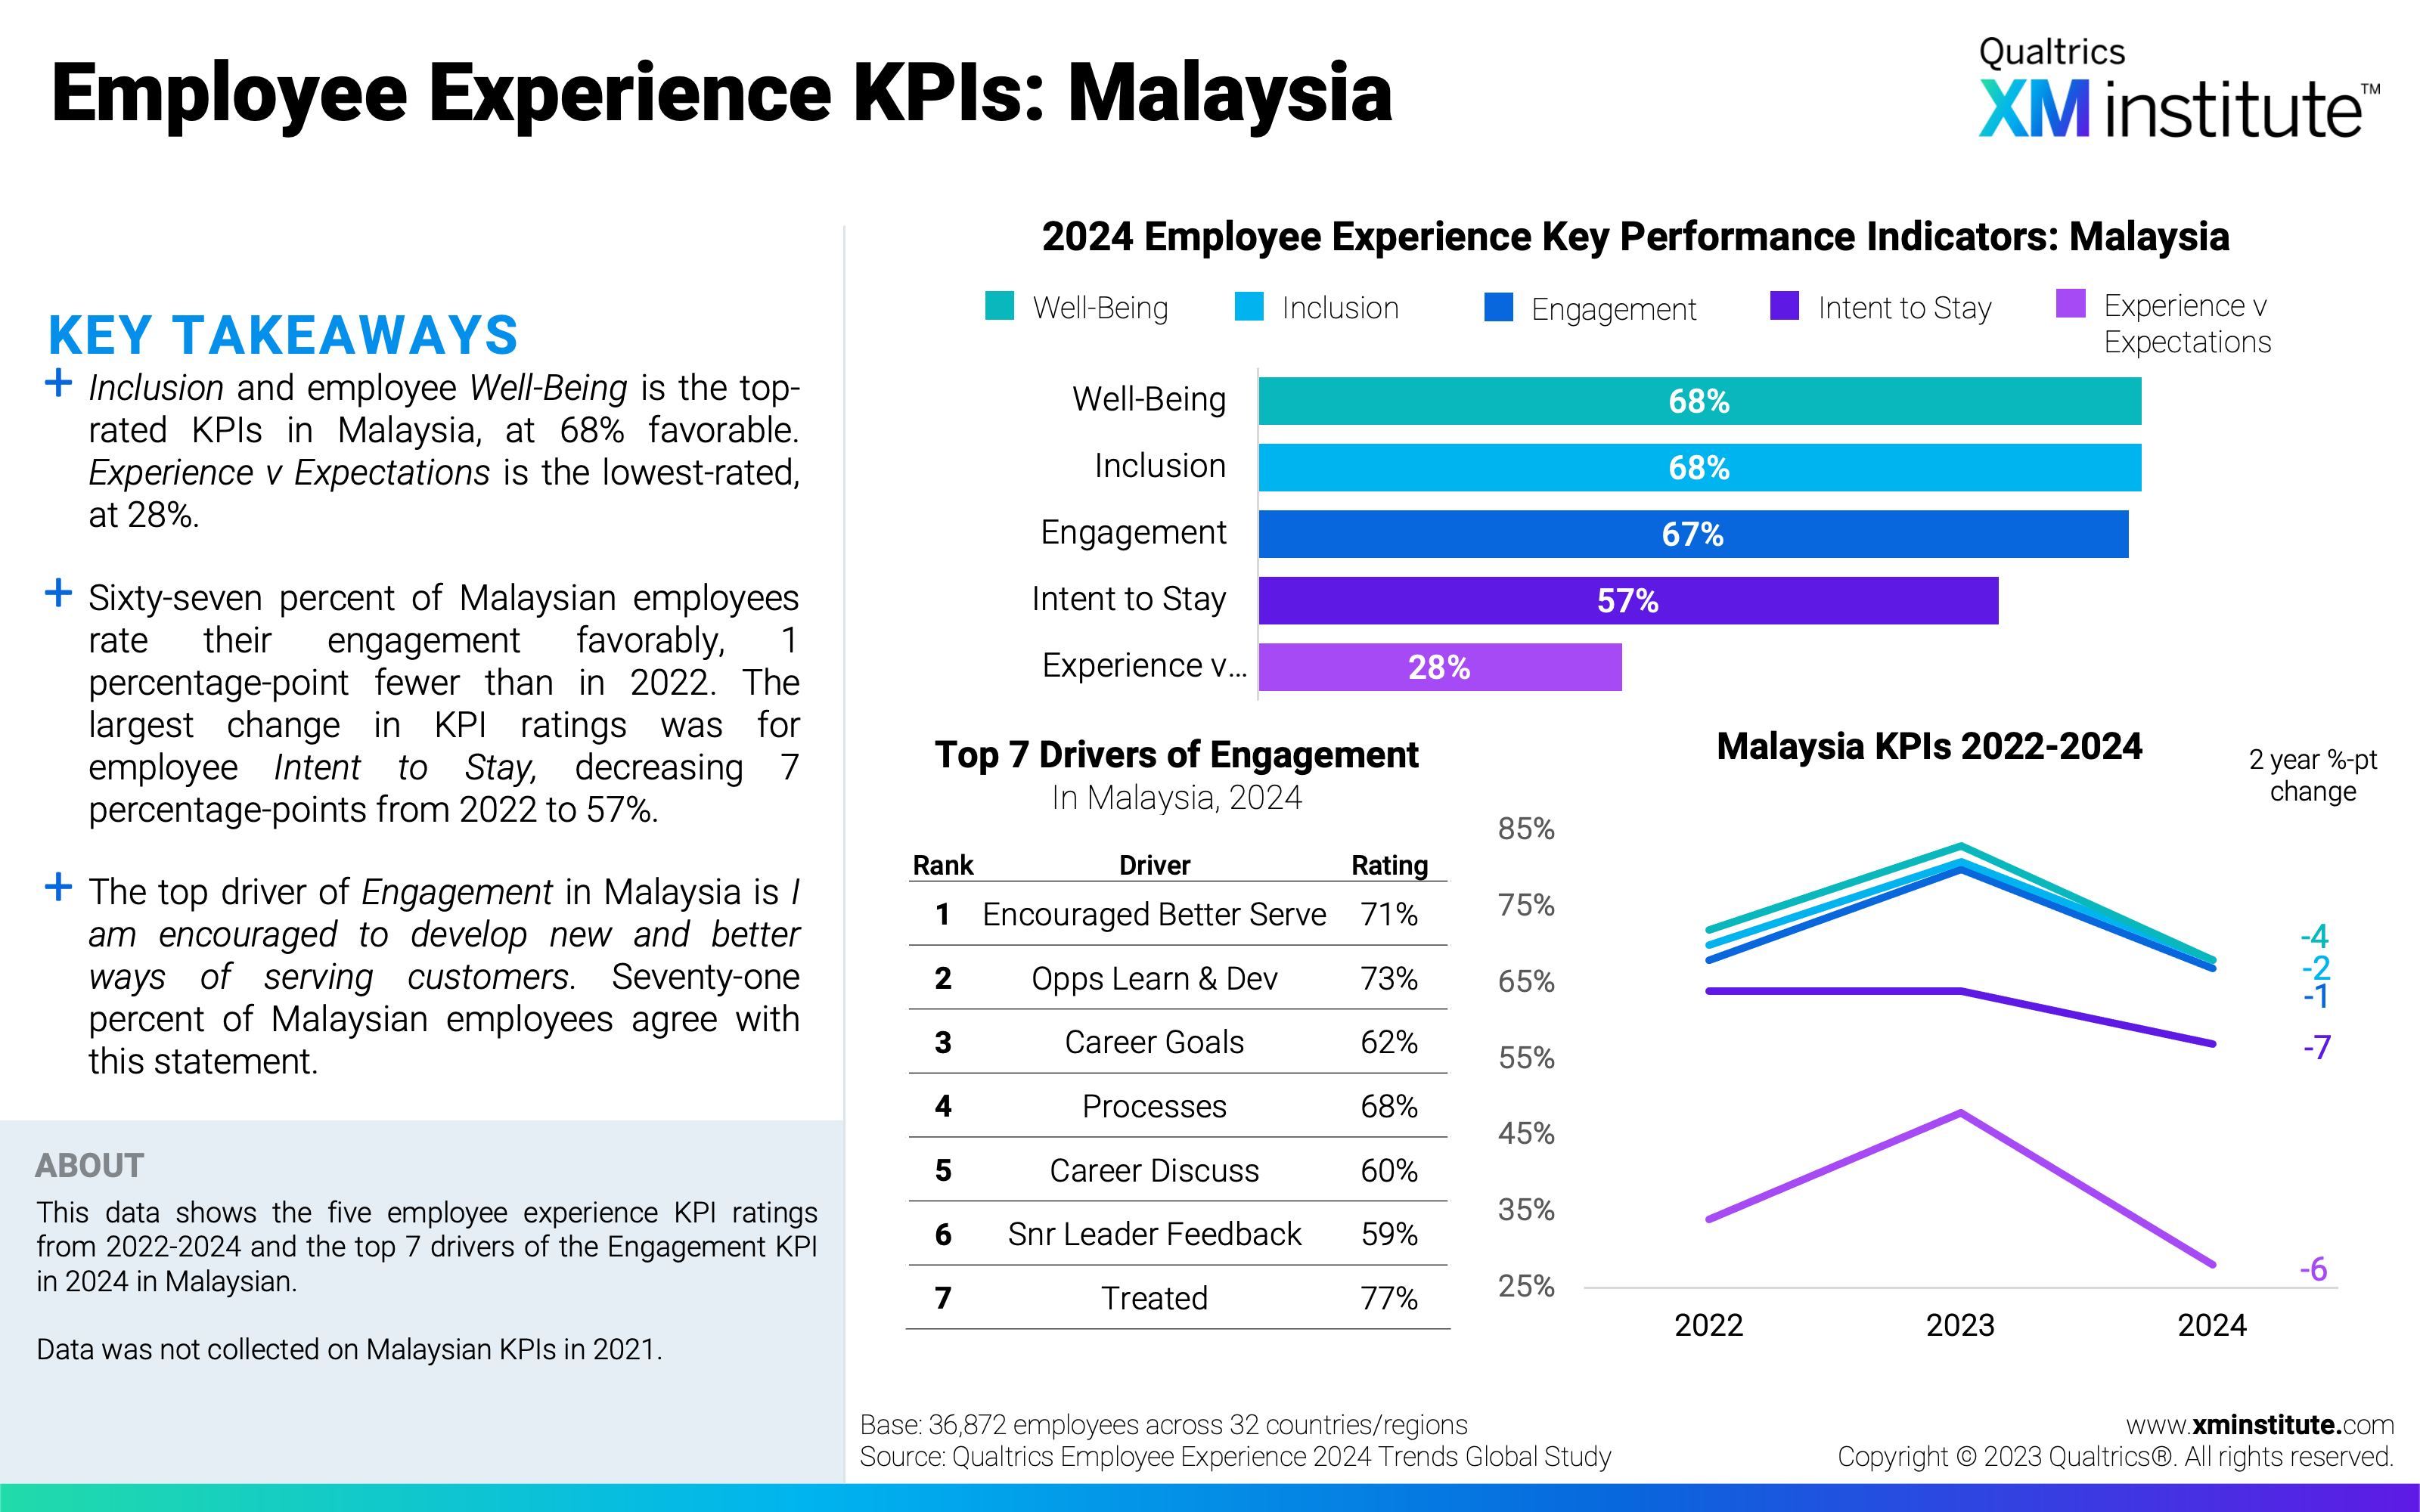
- Employee Experience KPIs: Malaysia
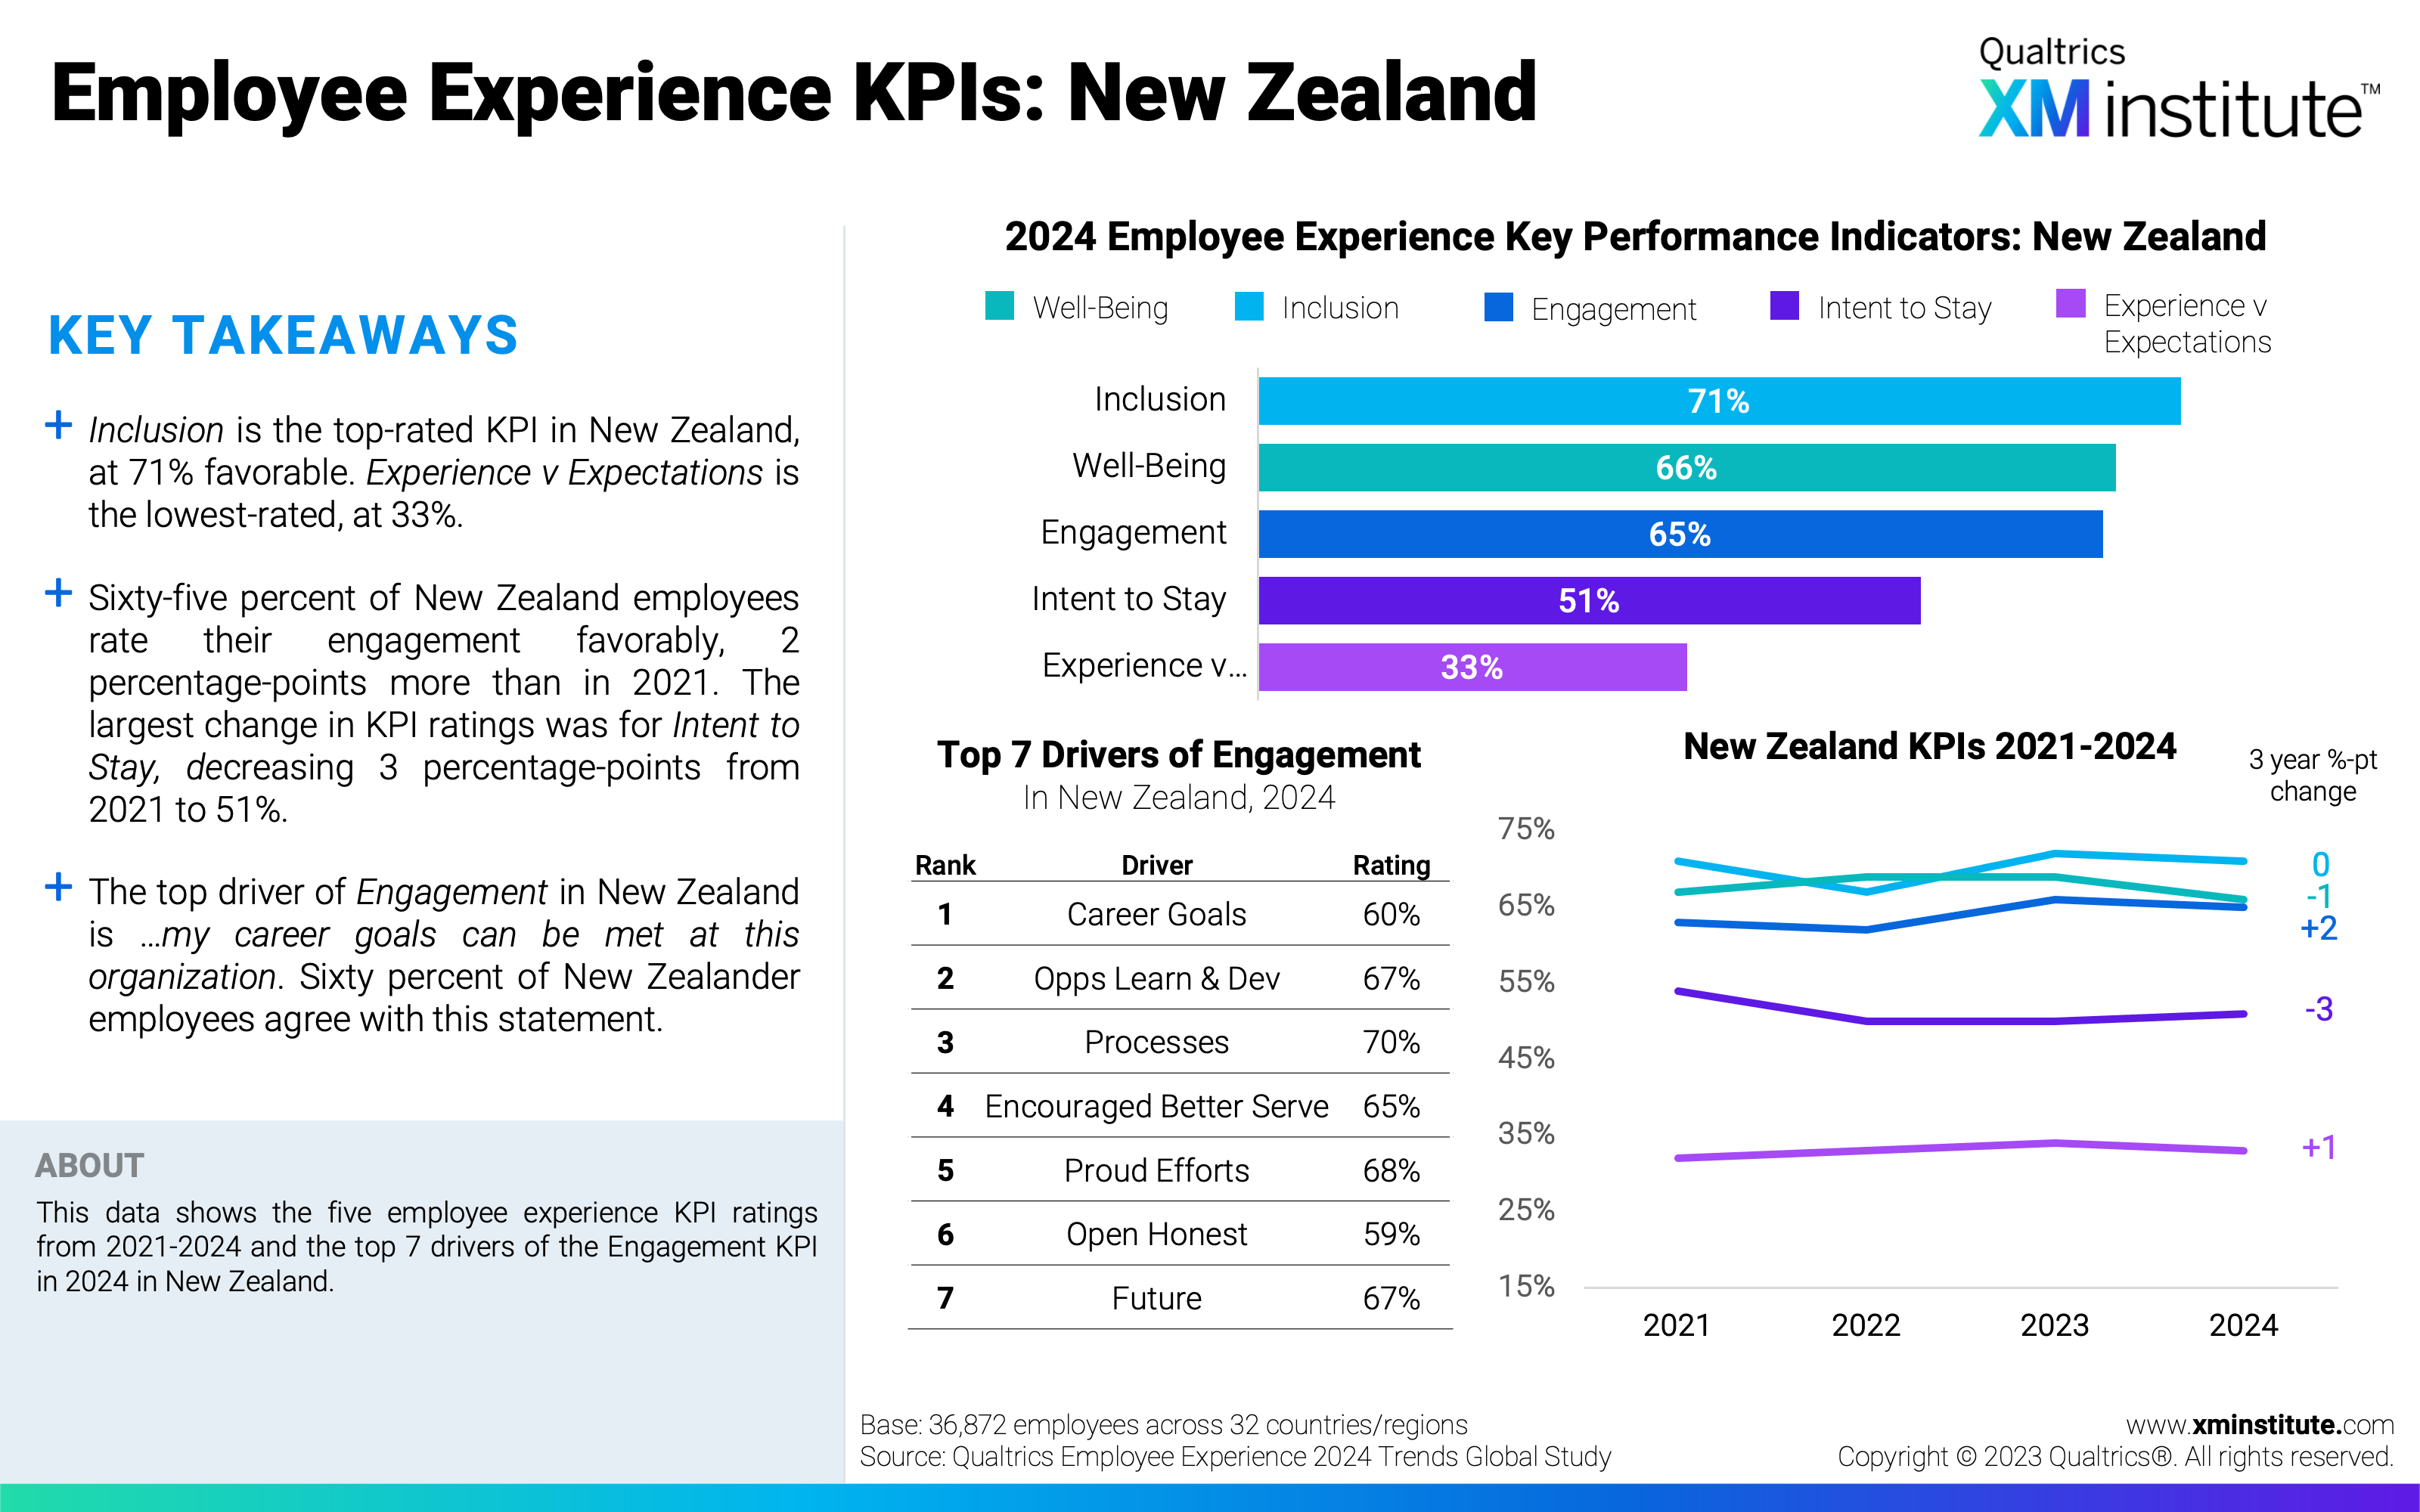
- Employee Experience KPIs: New Zealand
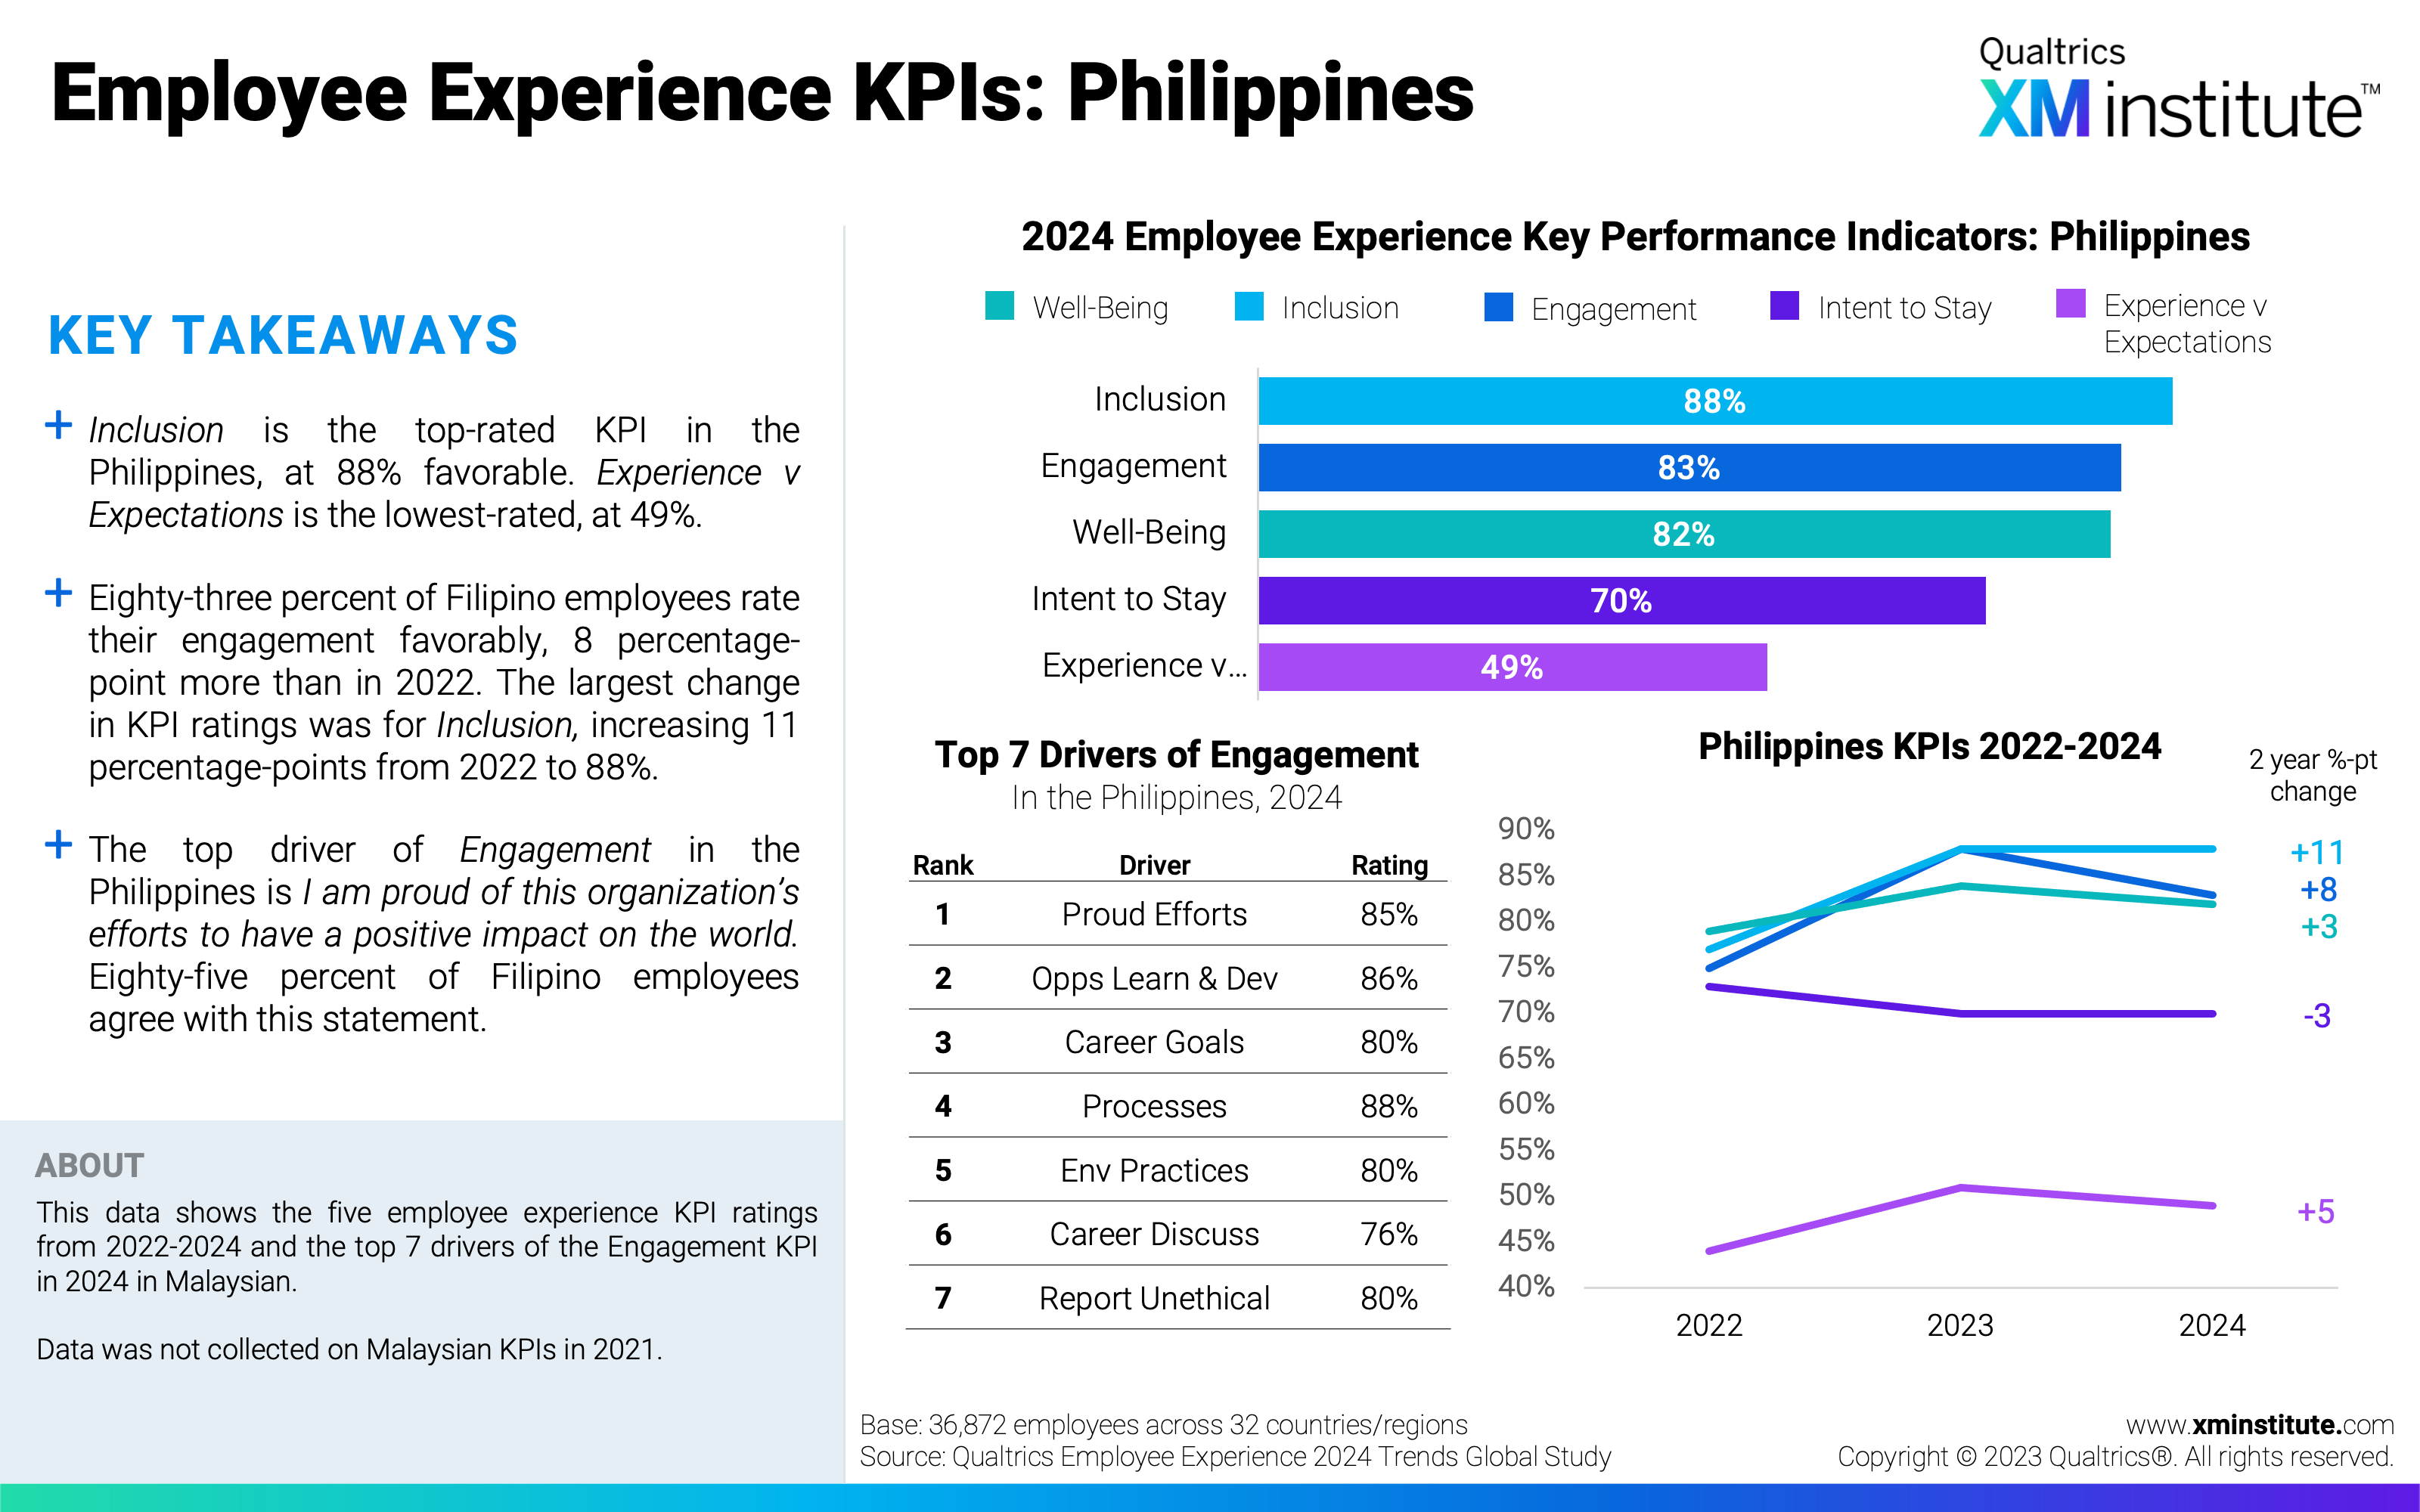
- Employee Experience KPIs: Philippines
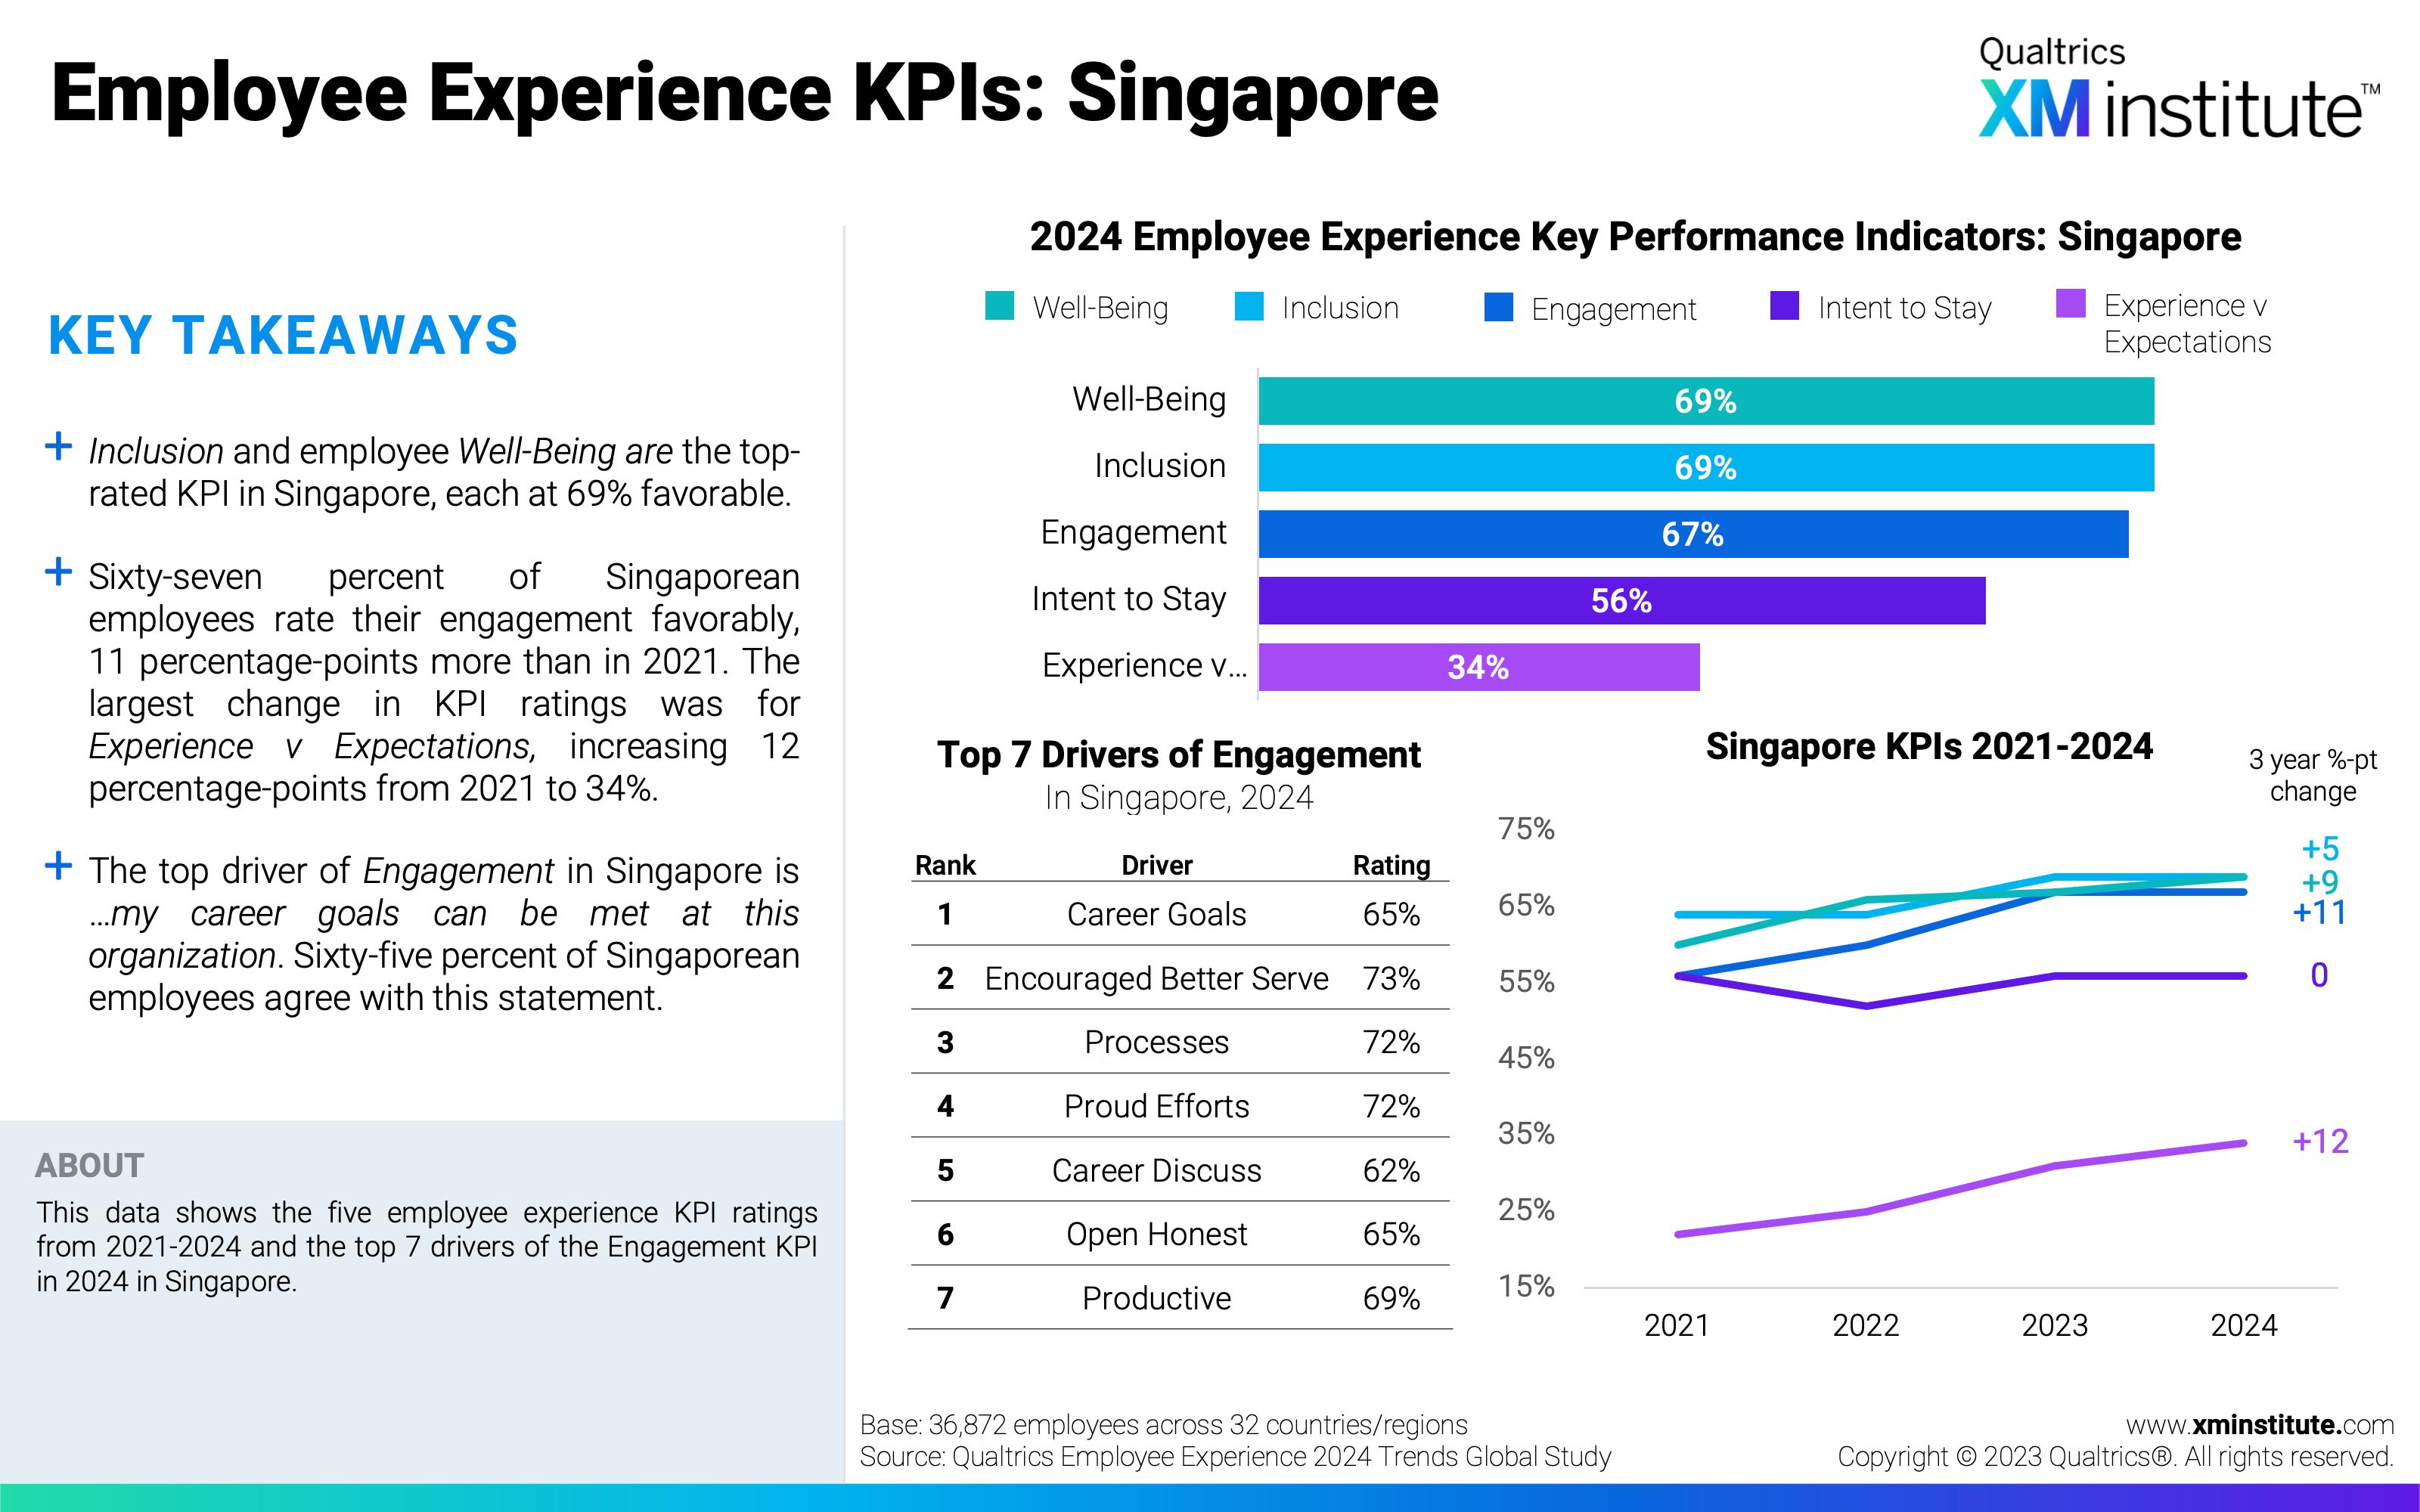
- Employee Experience KPIs: Singapore
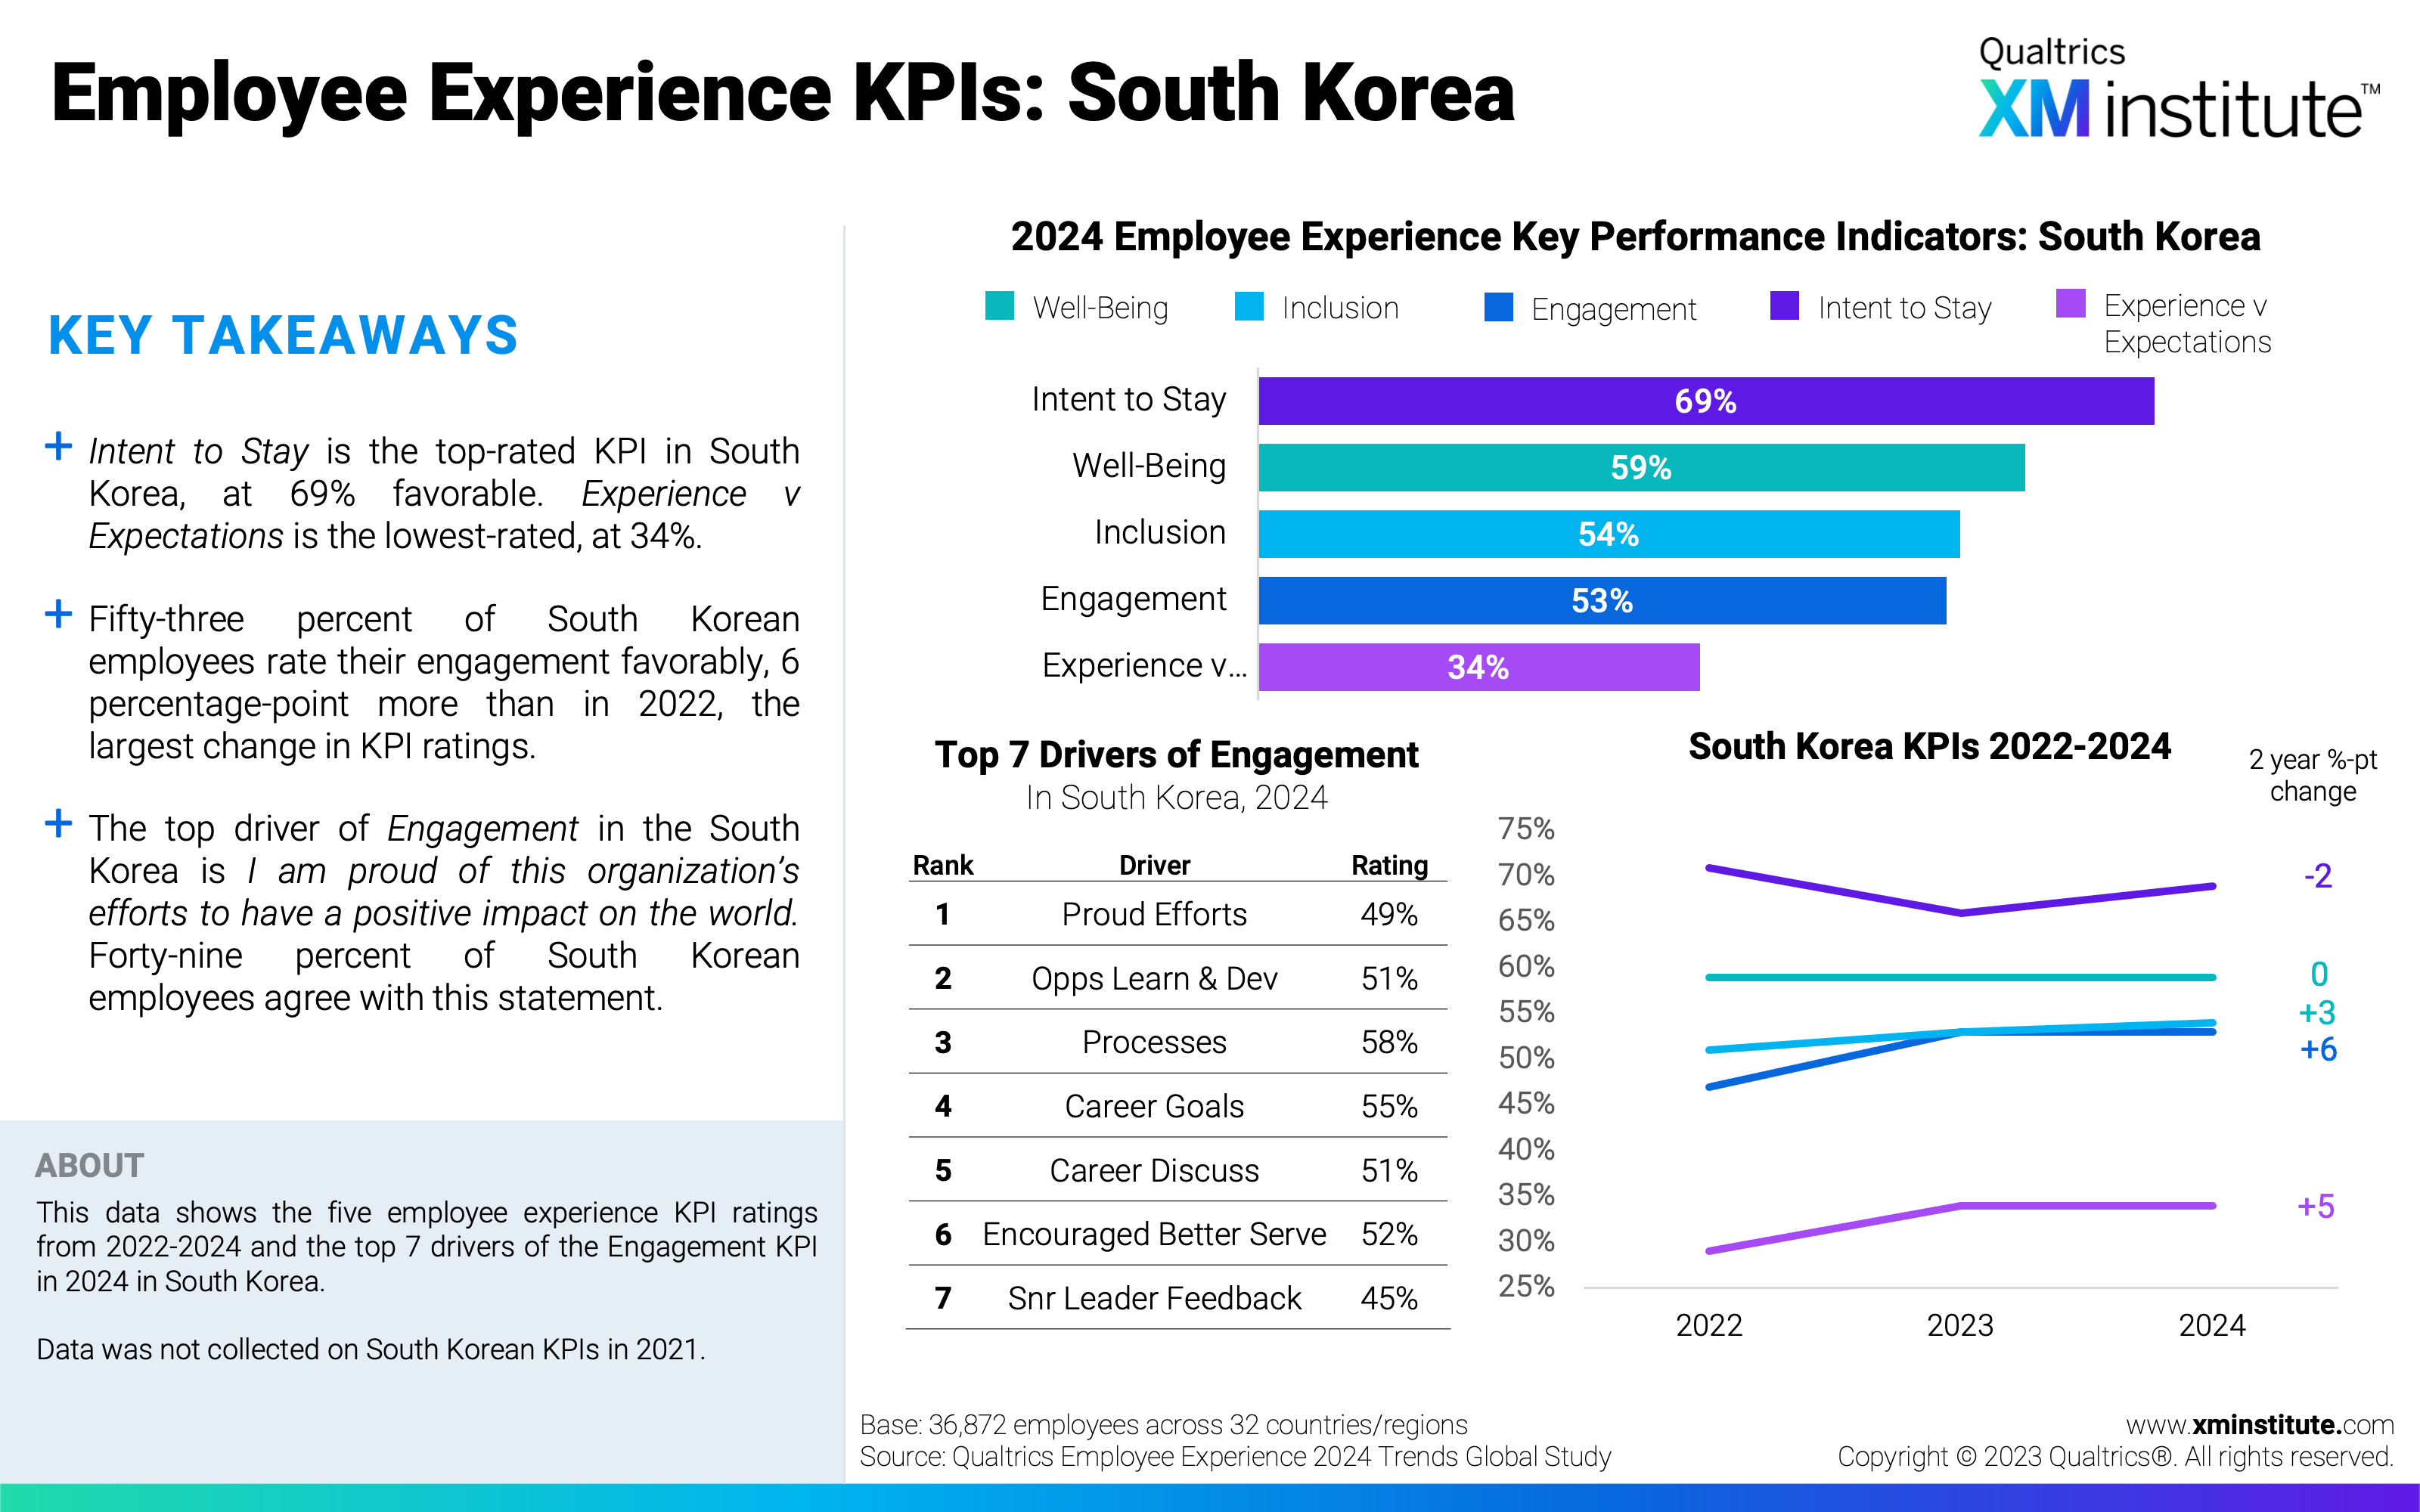
- Employee Experience KPIs: South Korea
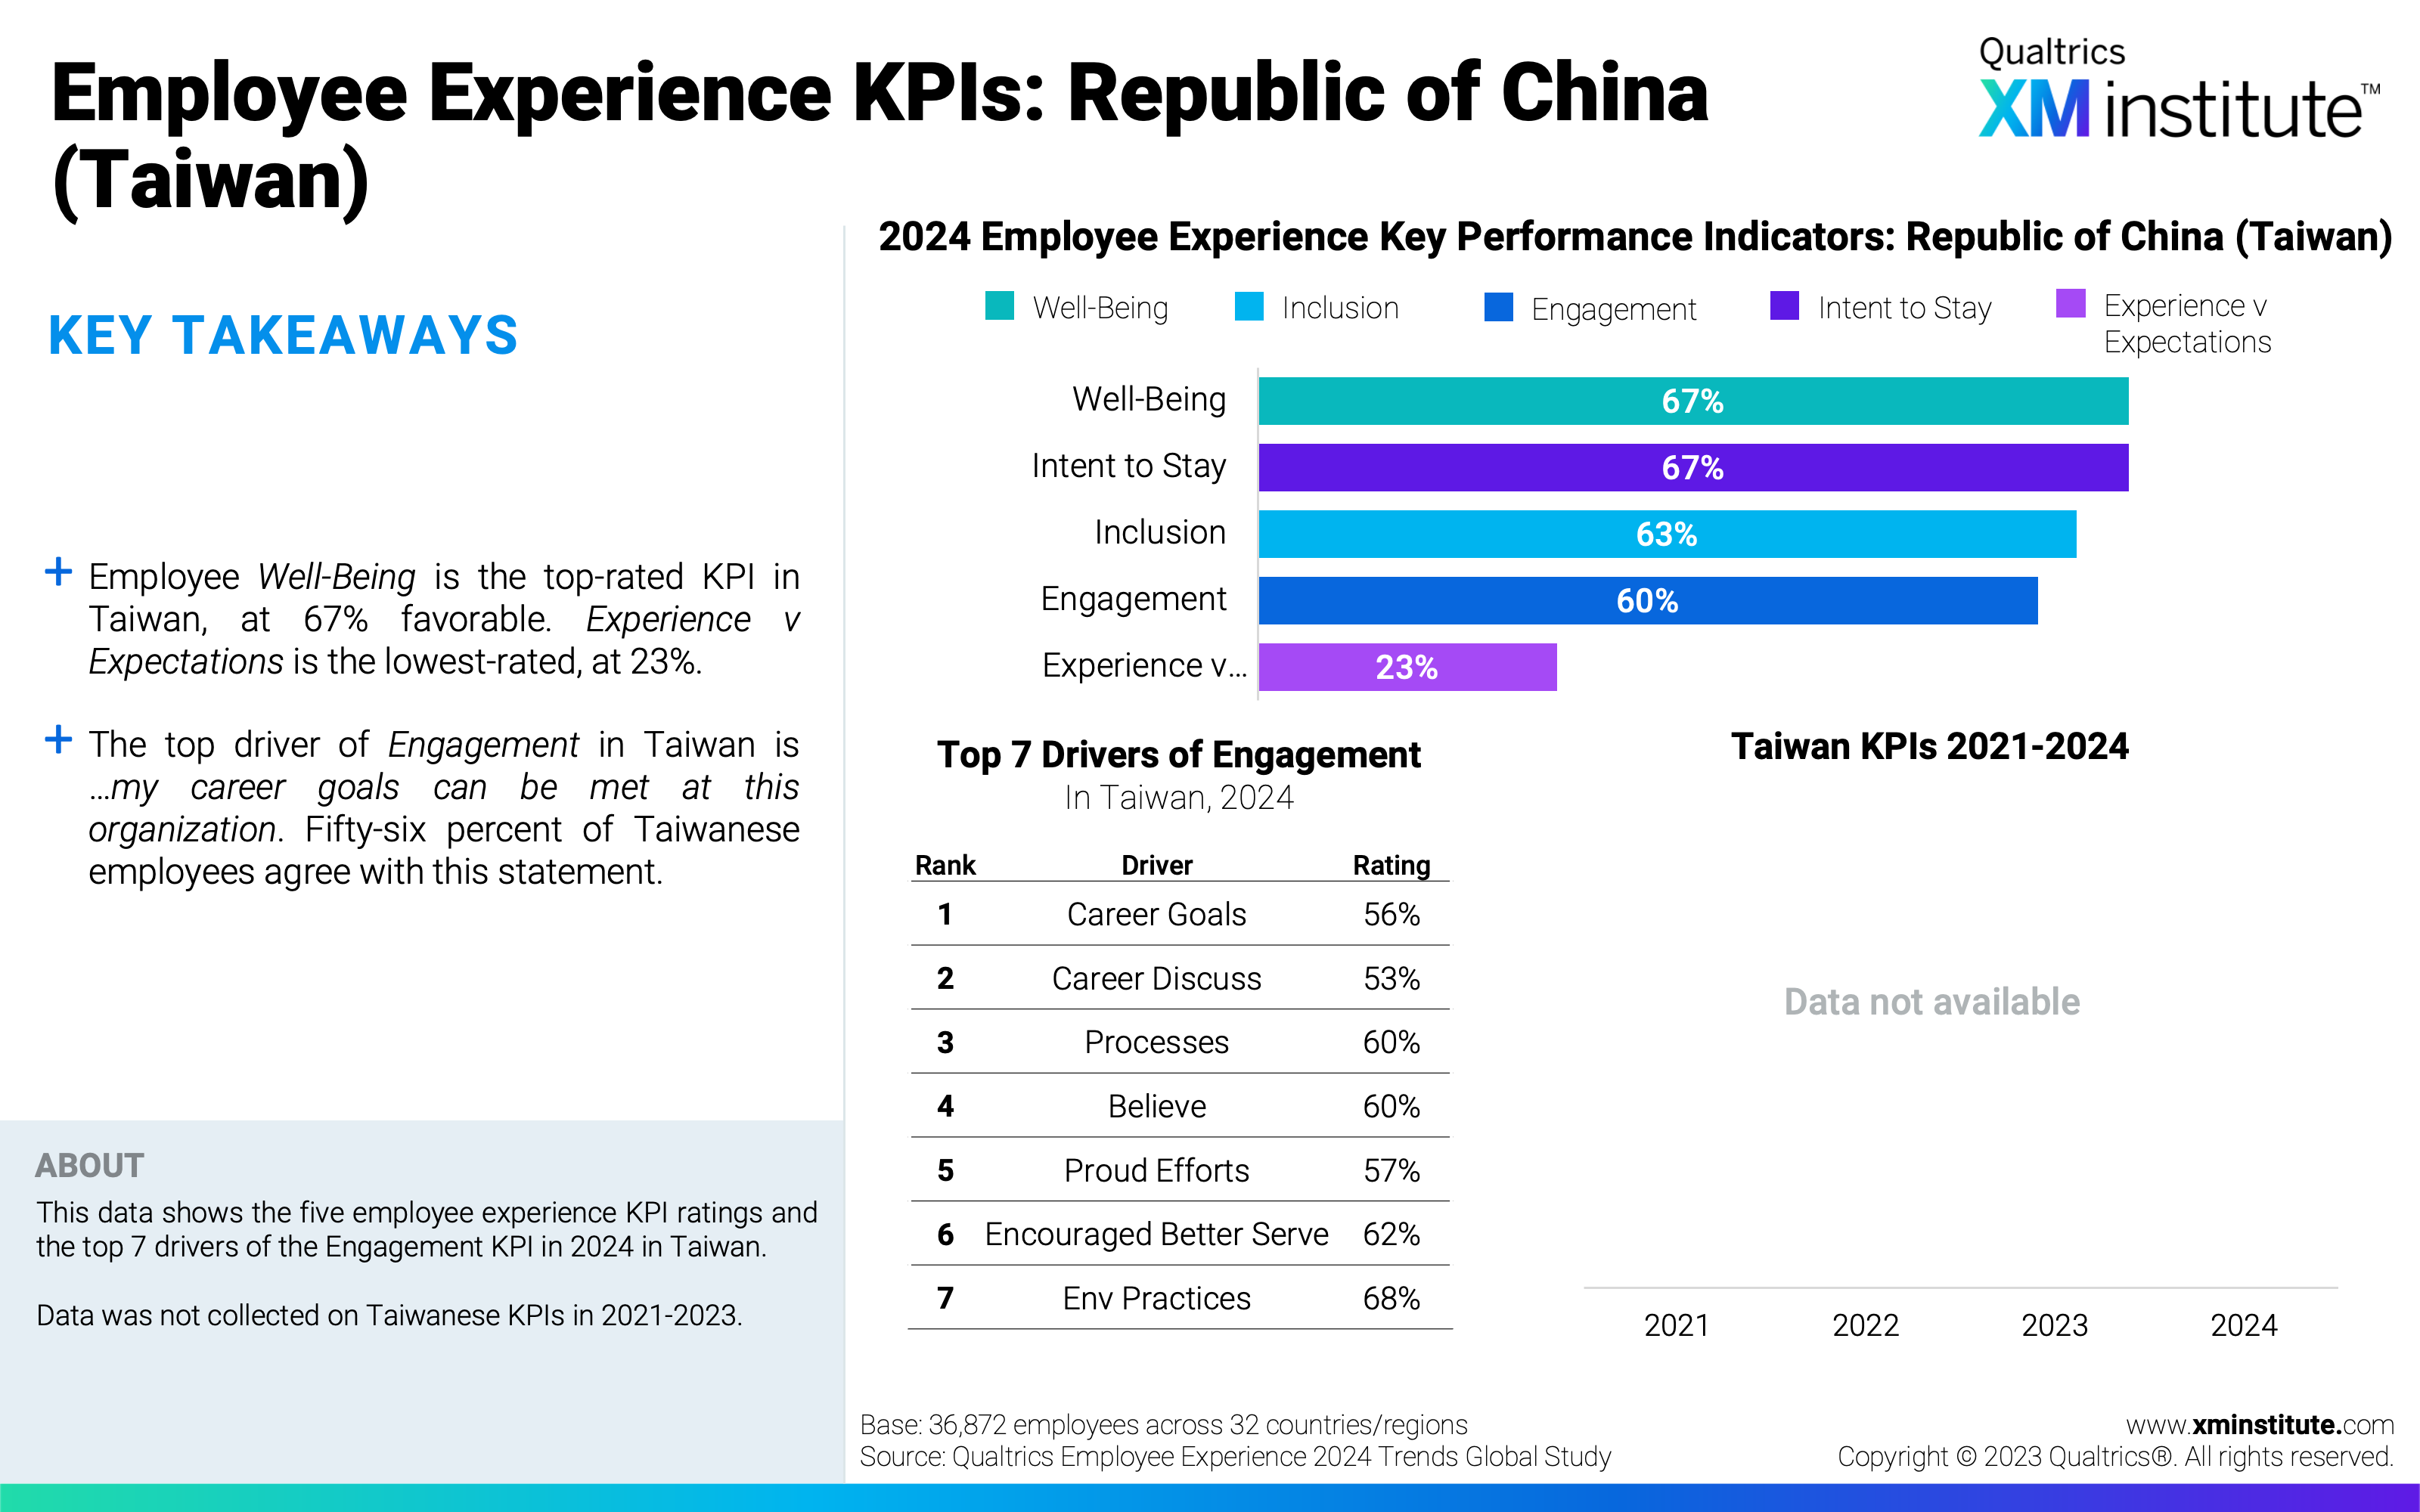
- Employee Experience KPIs: Republic of China (Taiwan)
- Employee Experience KPIs: Thailand
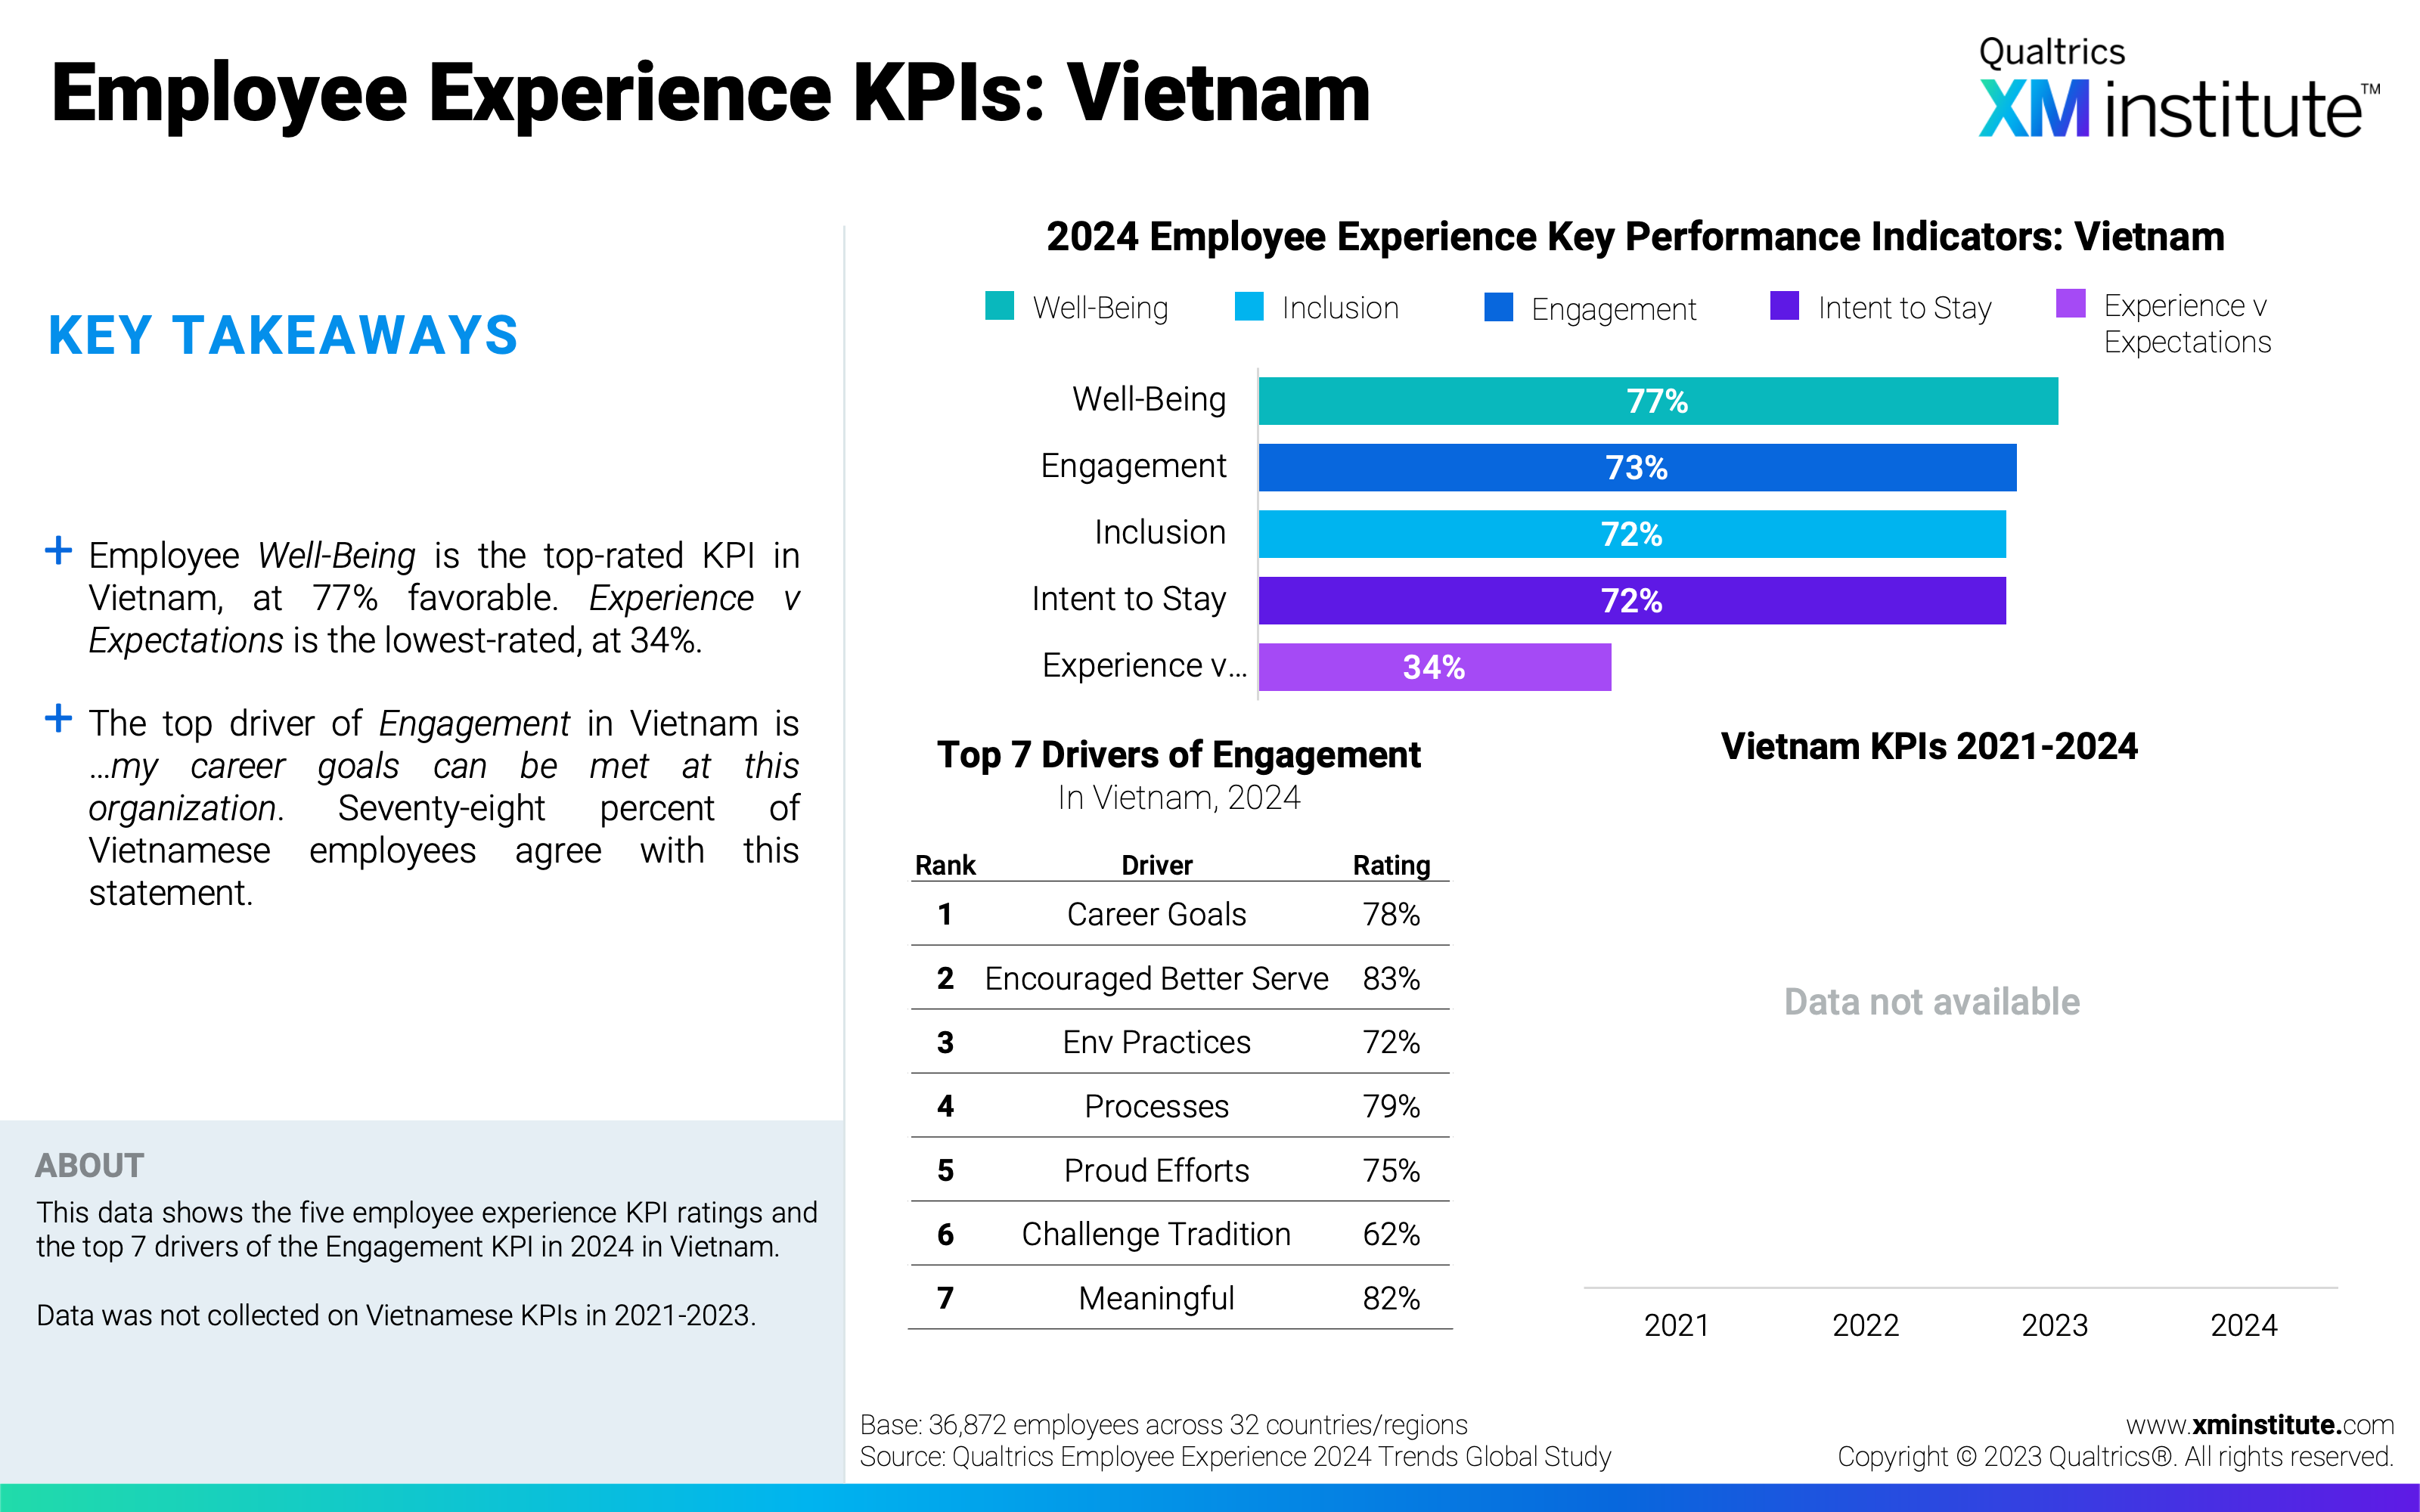
- Employee Experience KPIs: Vietnam
- Engagement Drivers Index
- Methodology