Key Takeaways
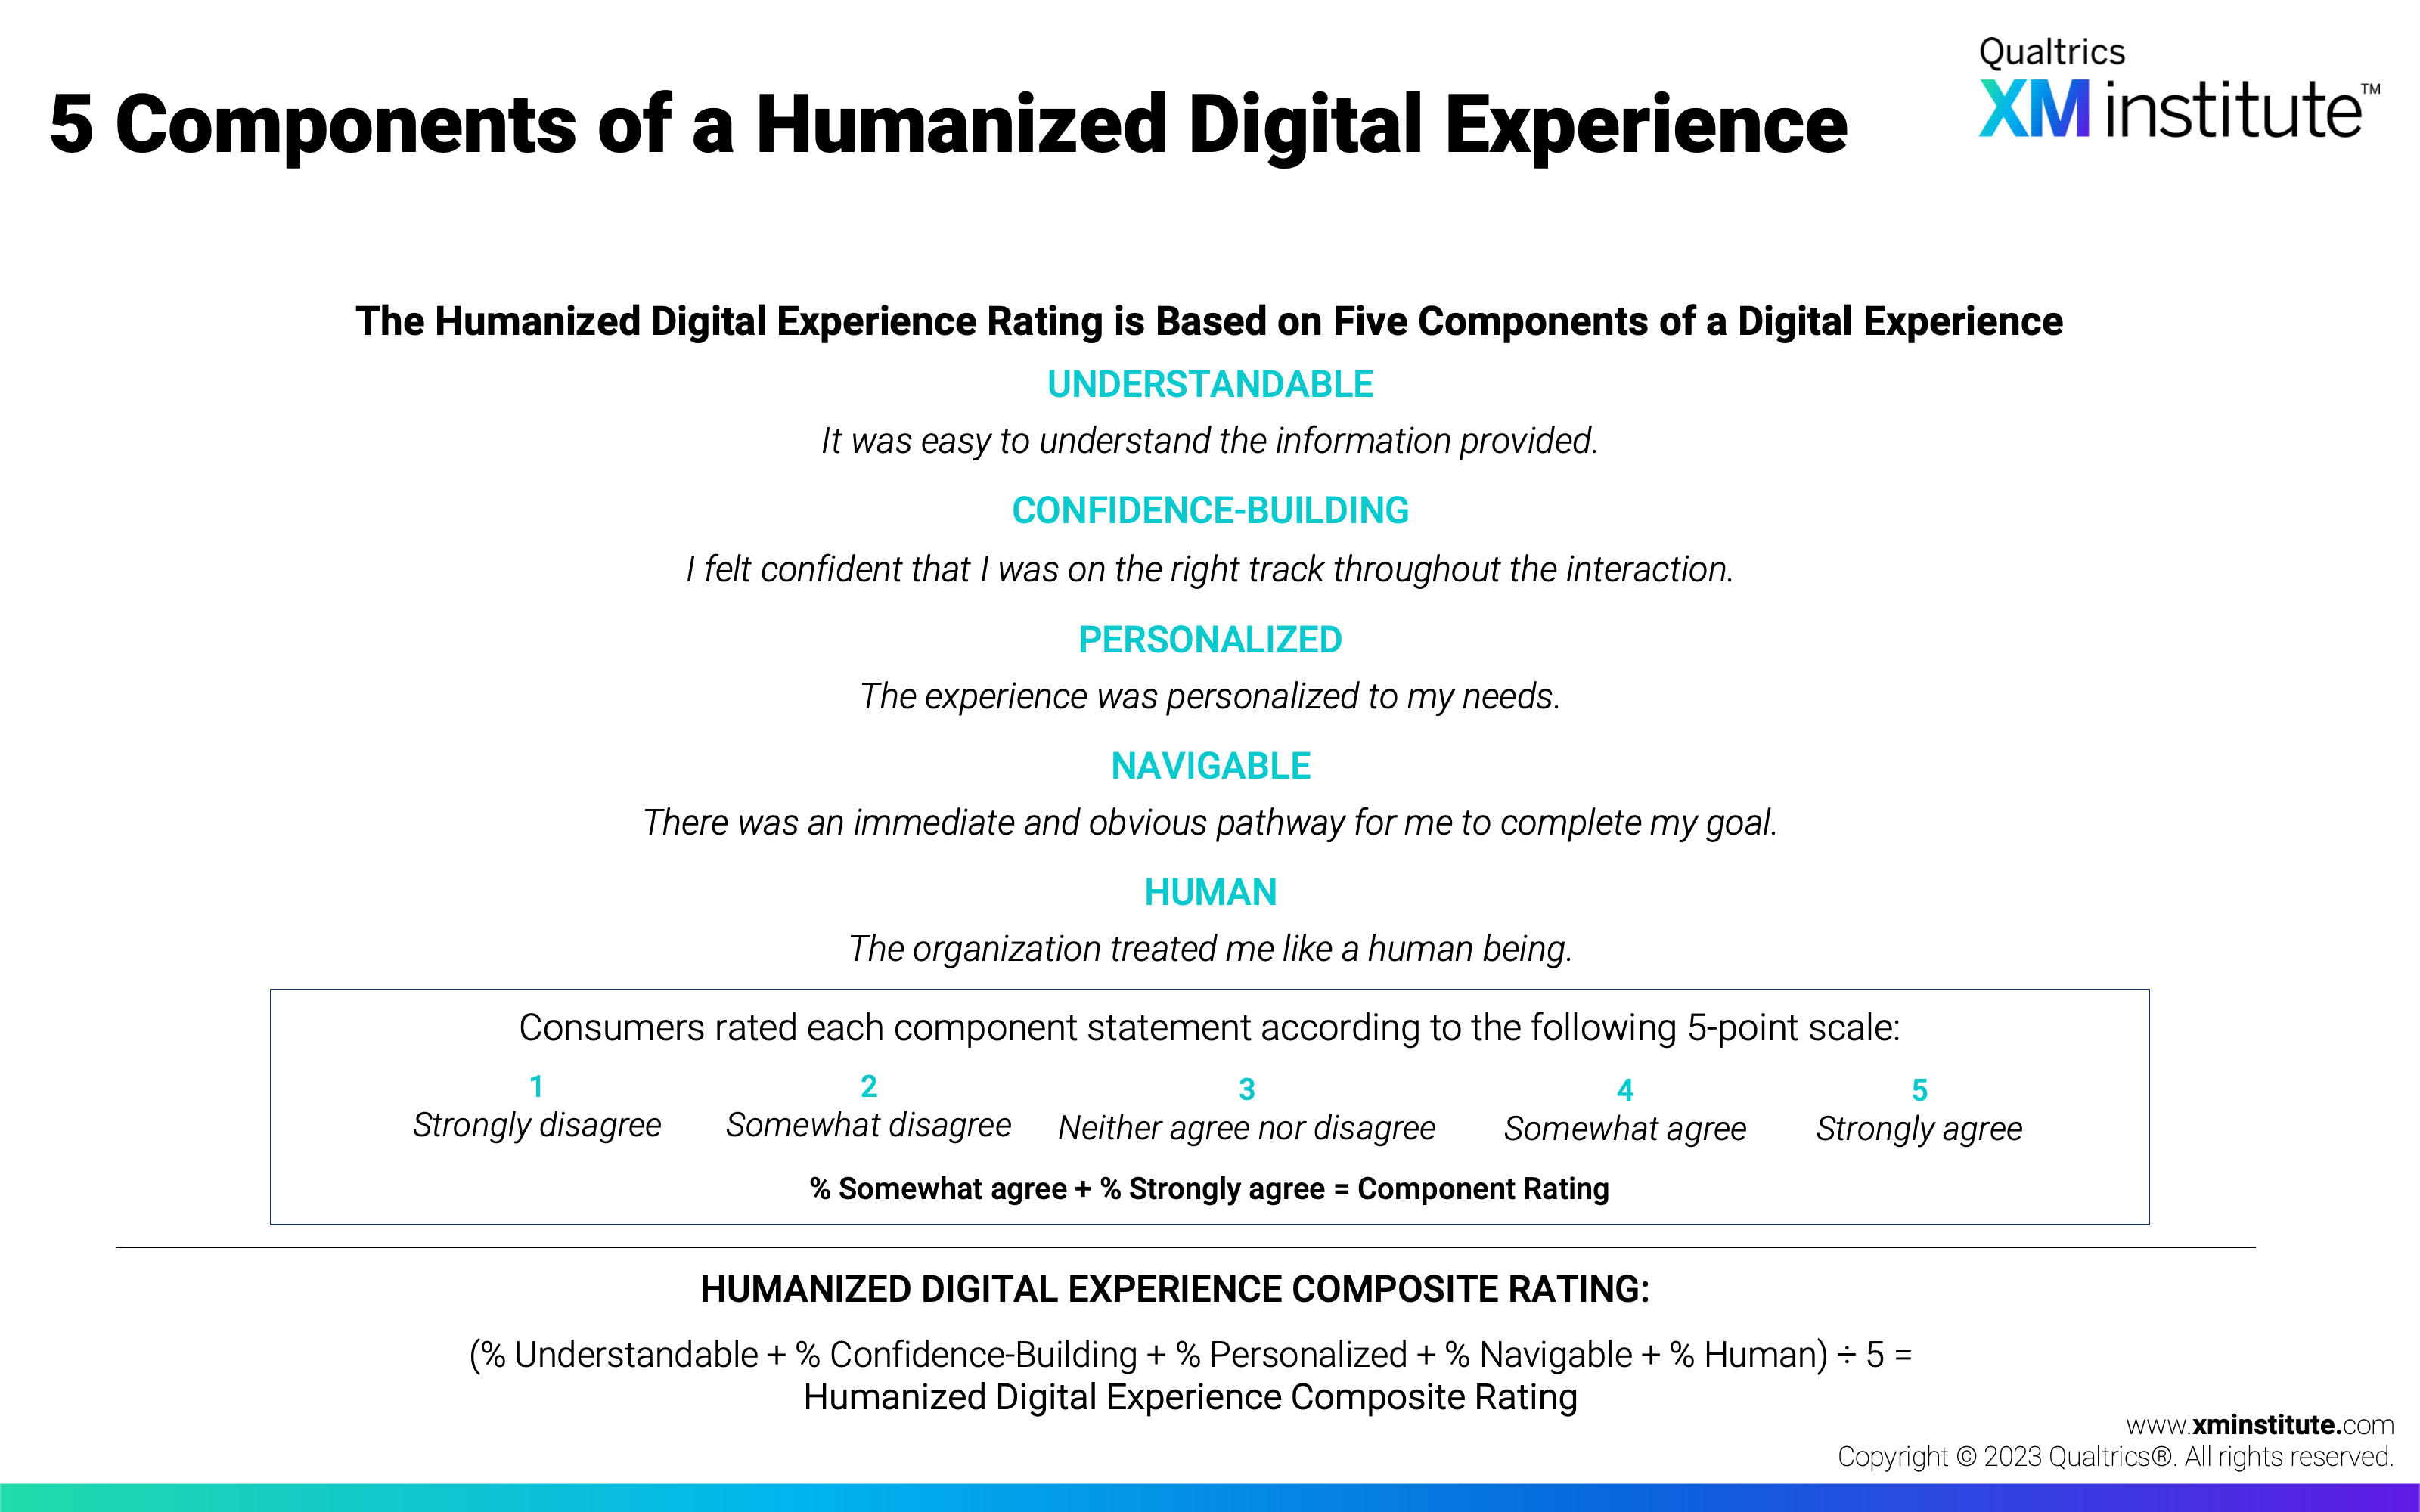
As part of Qualtrics XM Institute’s annual US consumer study, we asked 10,000 consumers to evaluate their recent digital experiences. Consumers shared whether they had a digital interaction within the previous 30 days with any of 10 industries. They shared which access method they used – mobile website, computer website, or mobile app – and then rated that experience across five components of a humanized digital experience: understandable, confidence-building, personalized, navigable, and human. From our analysis, we found that:
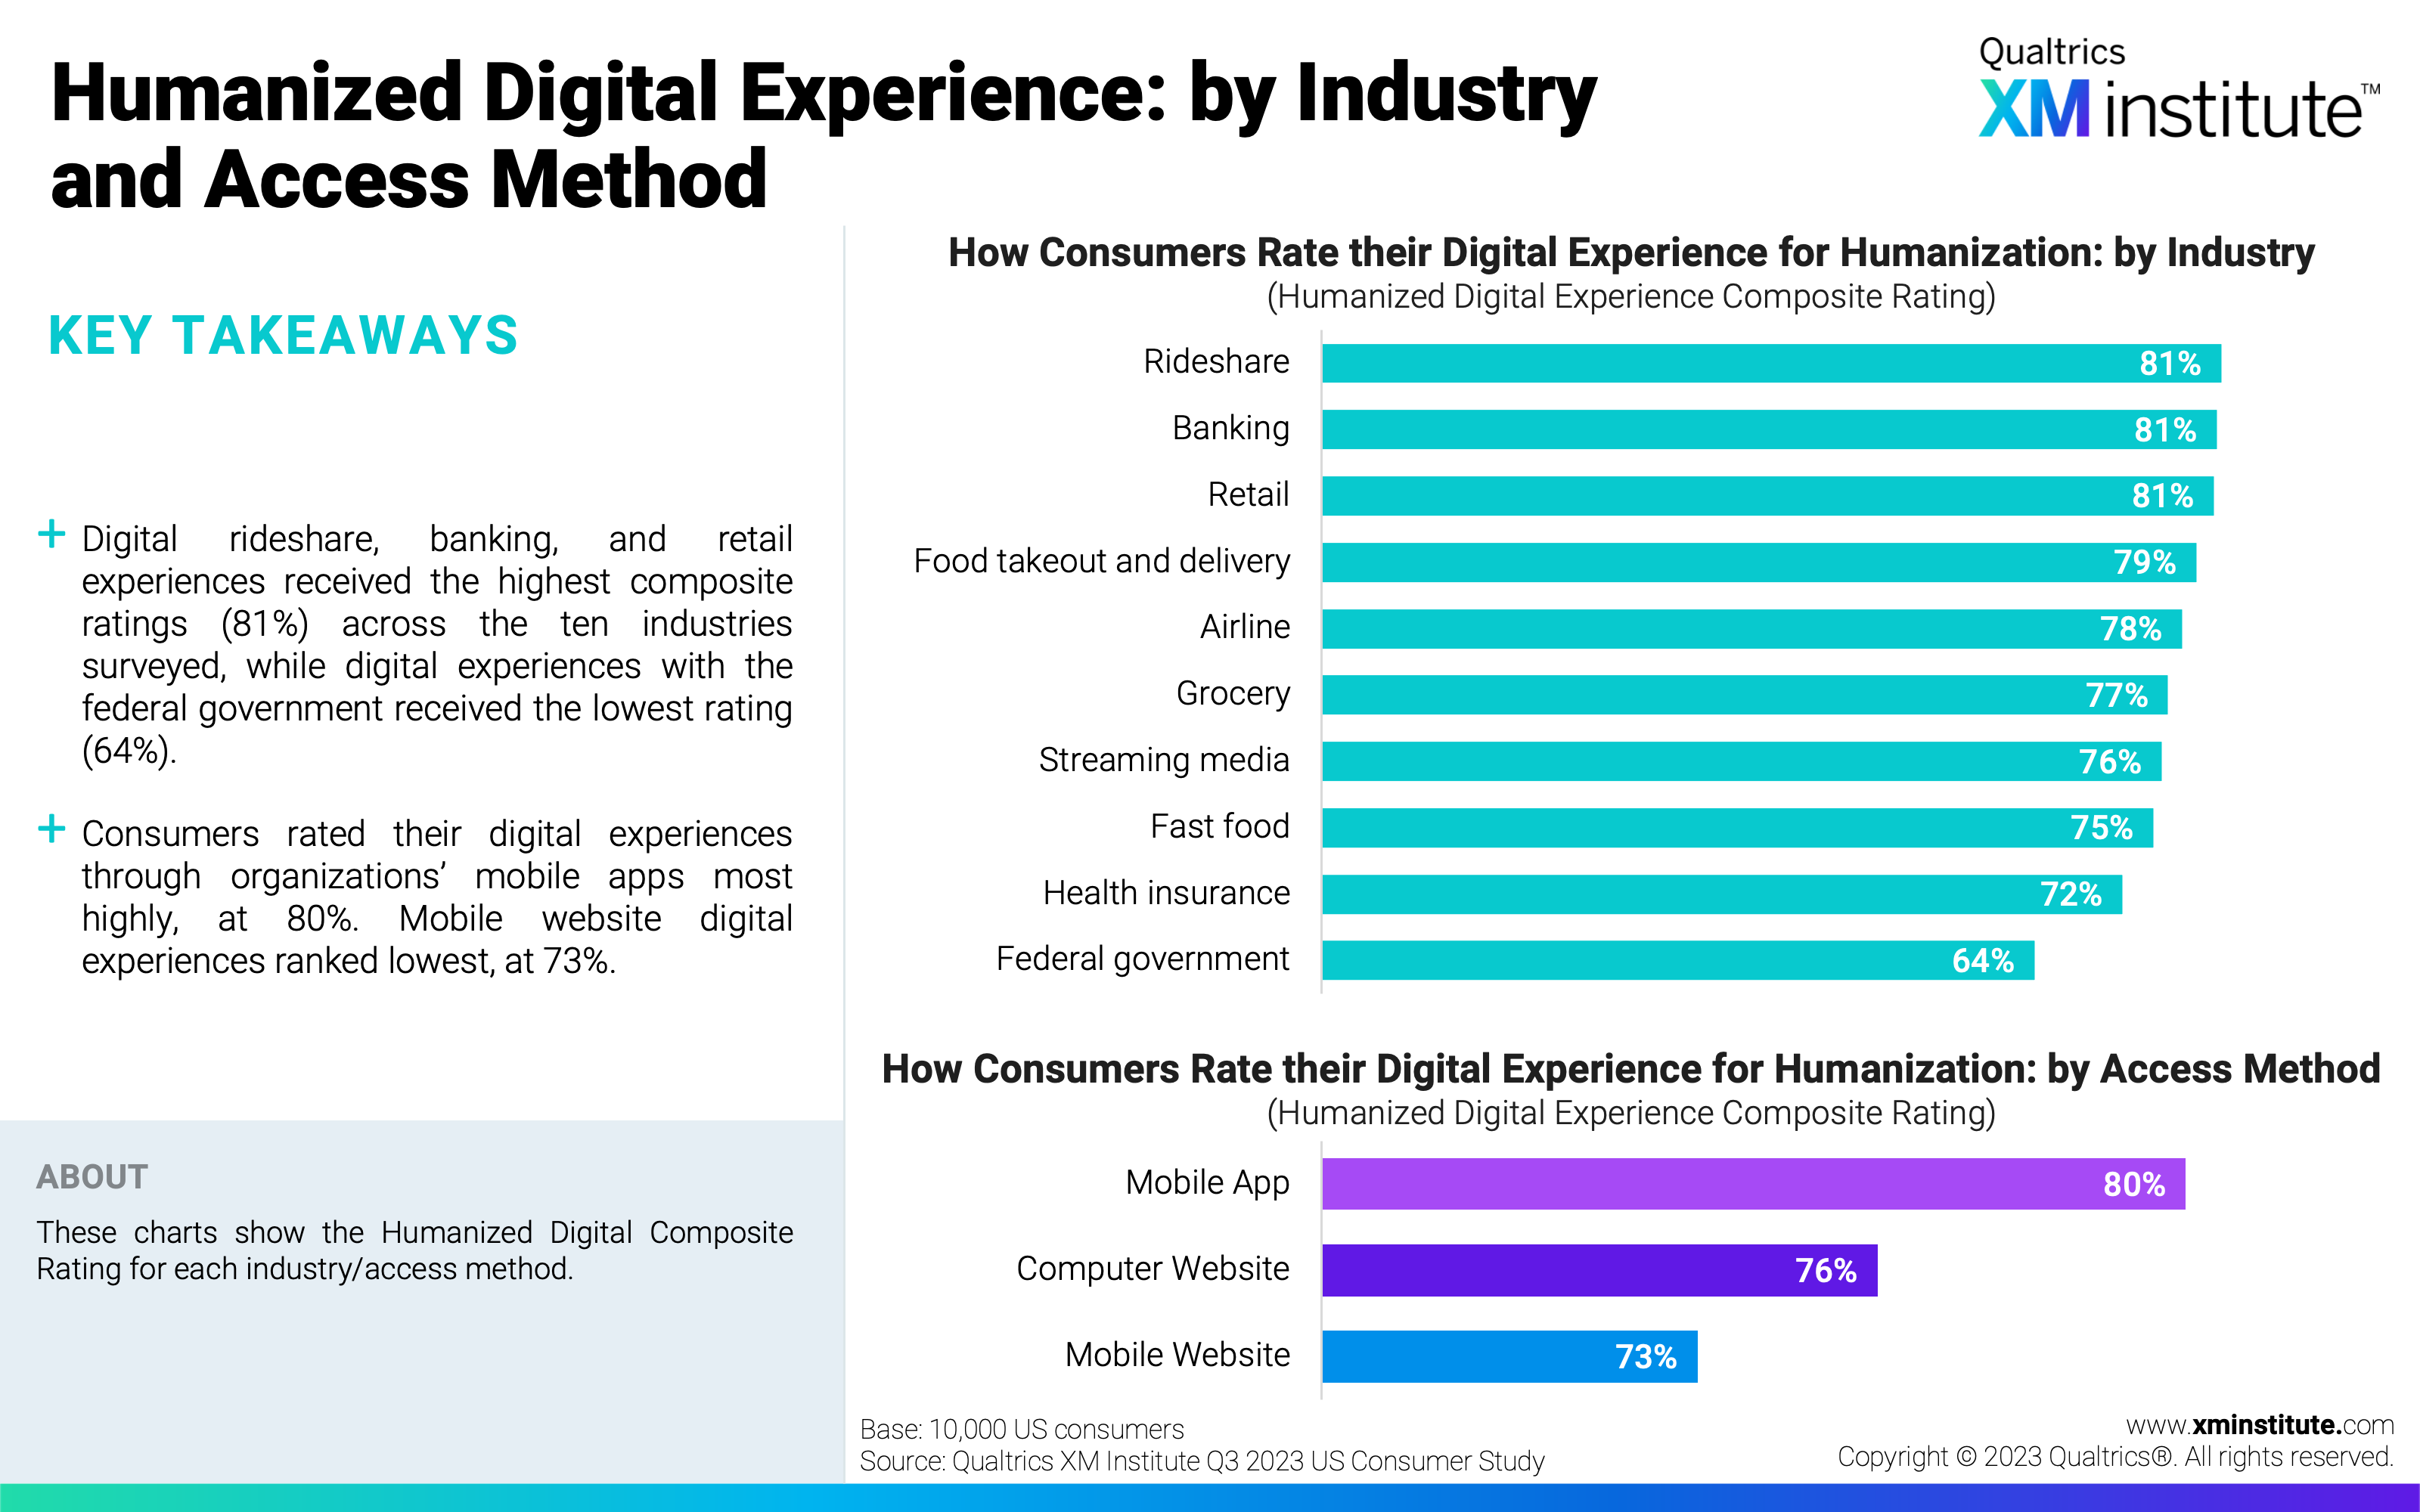
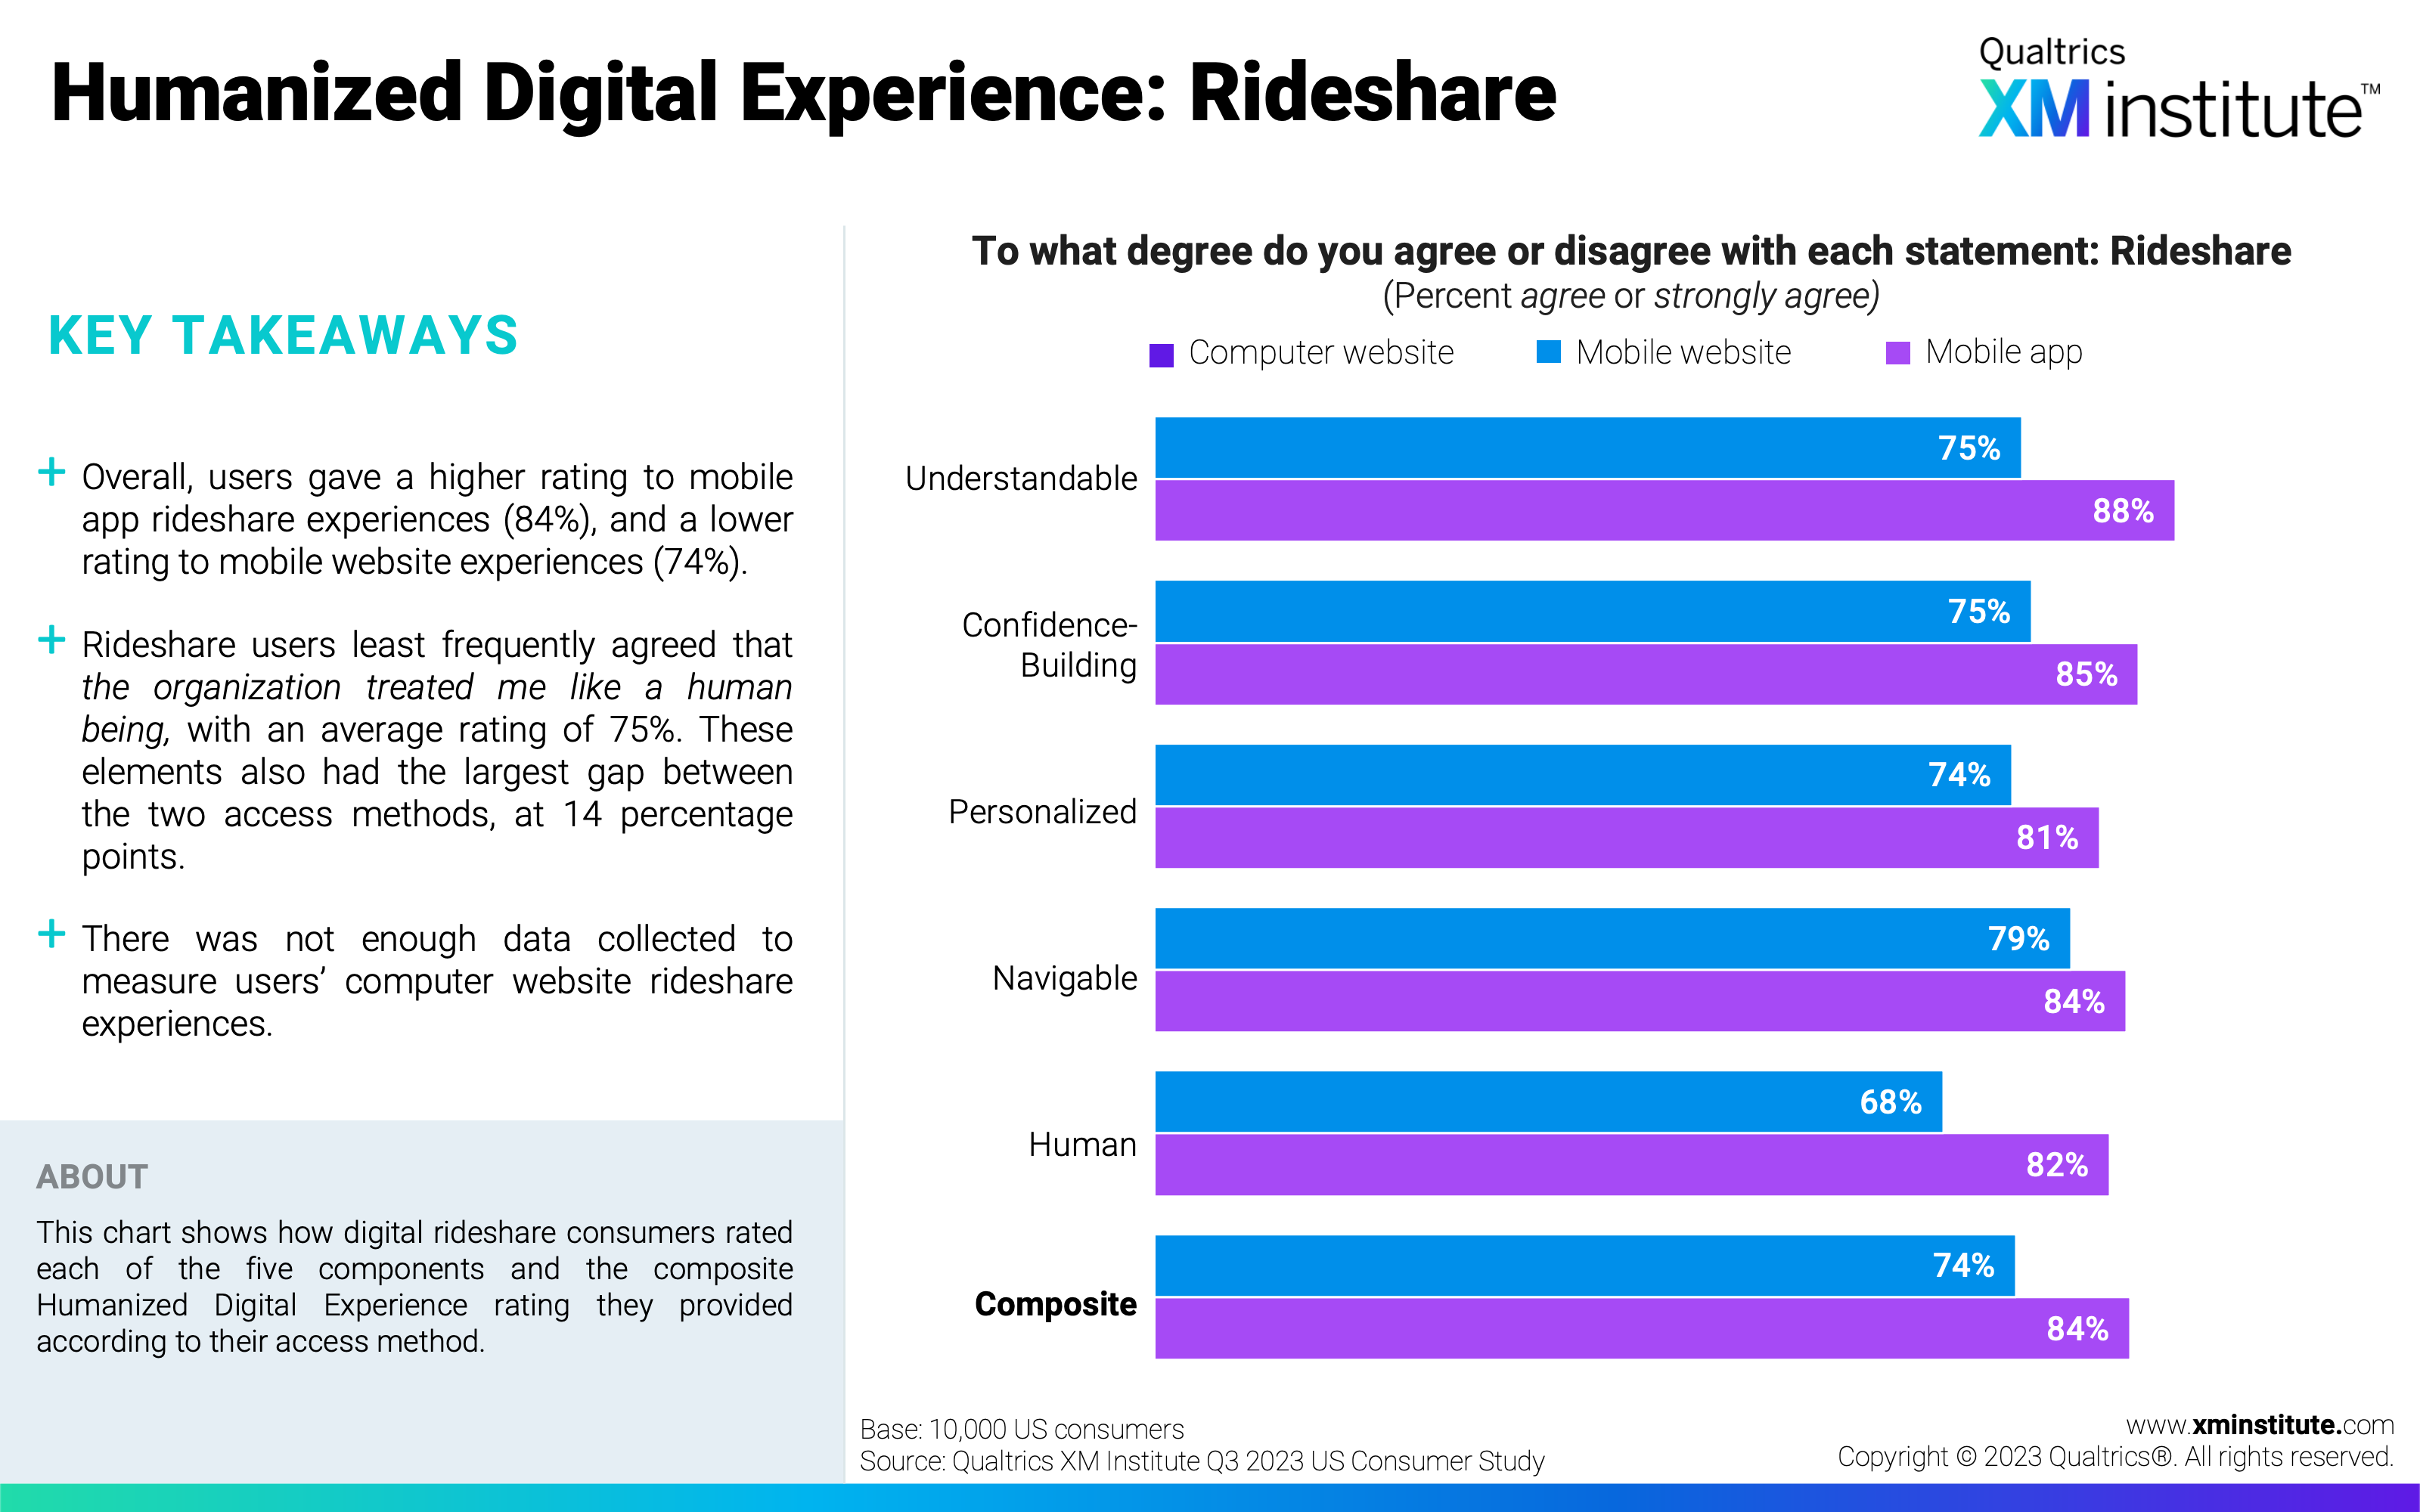
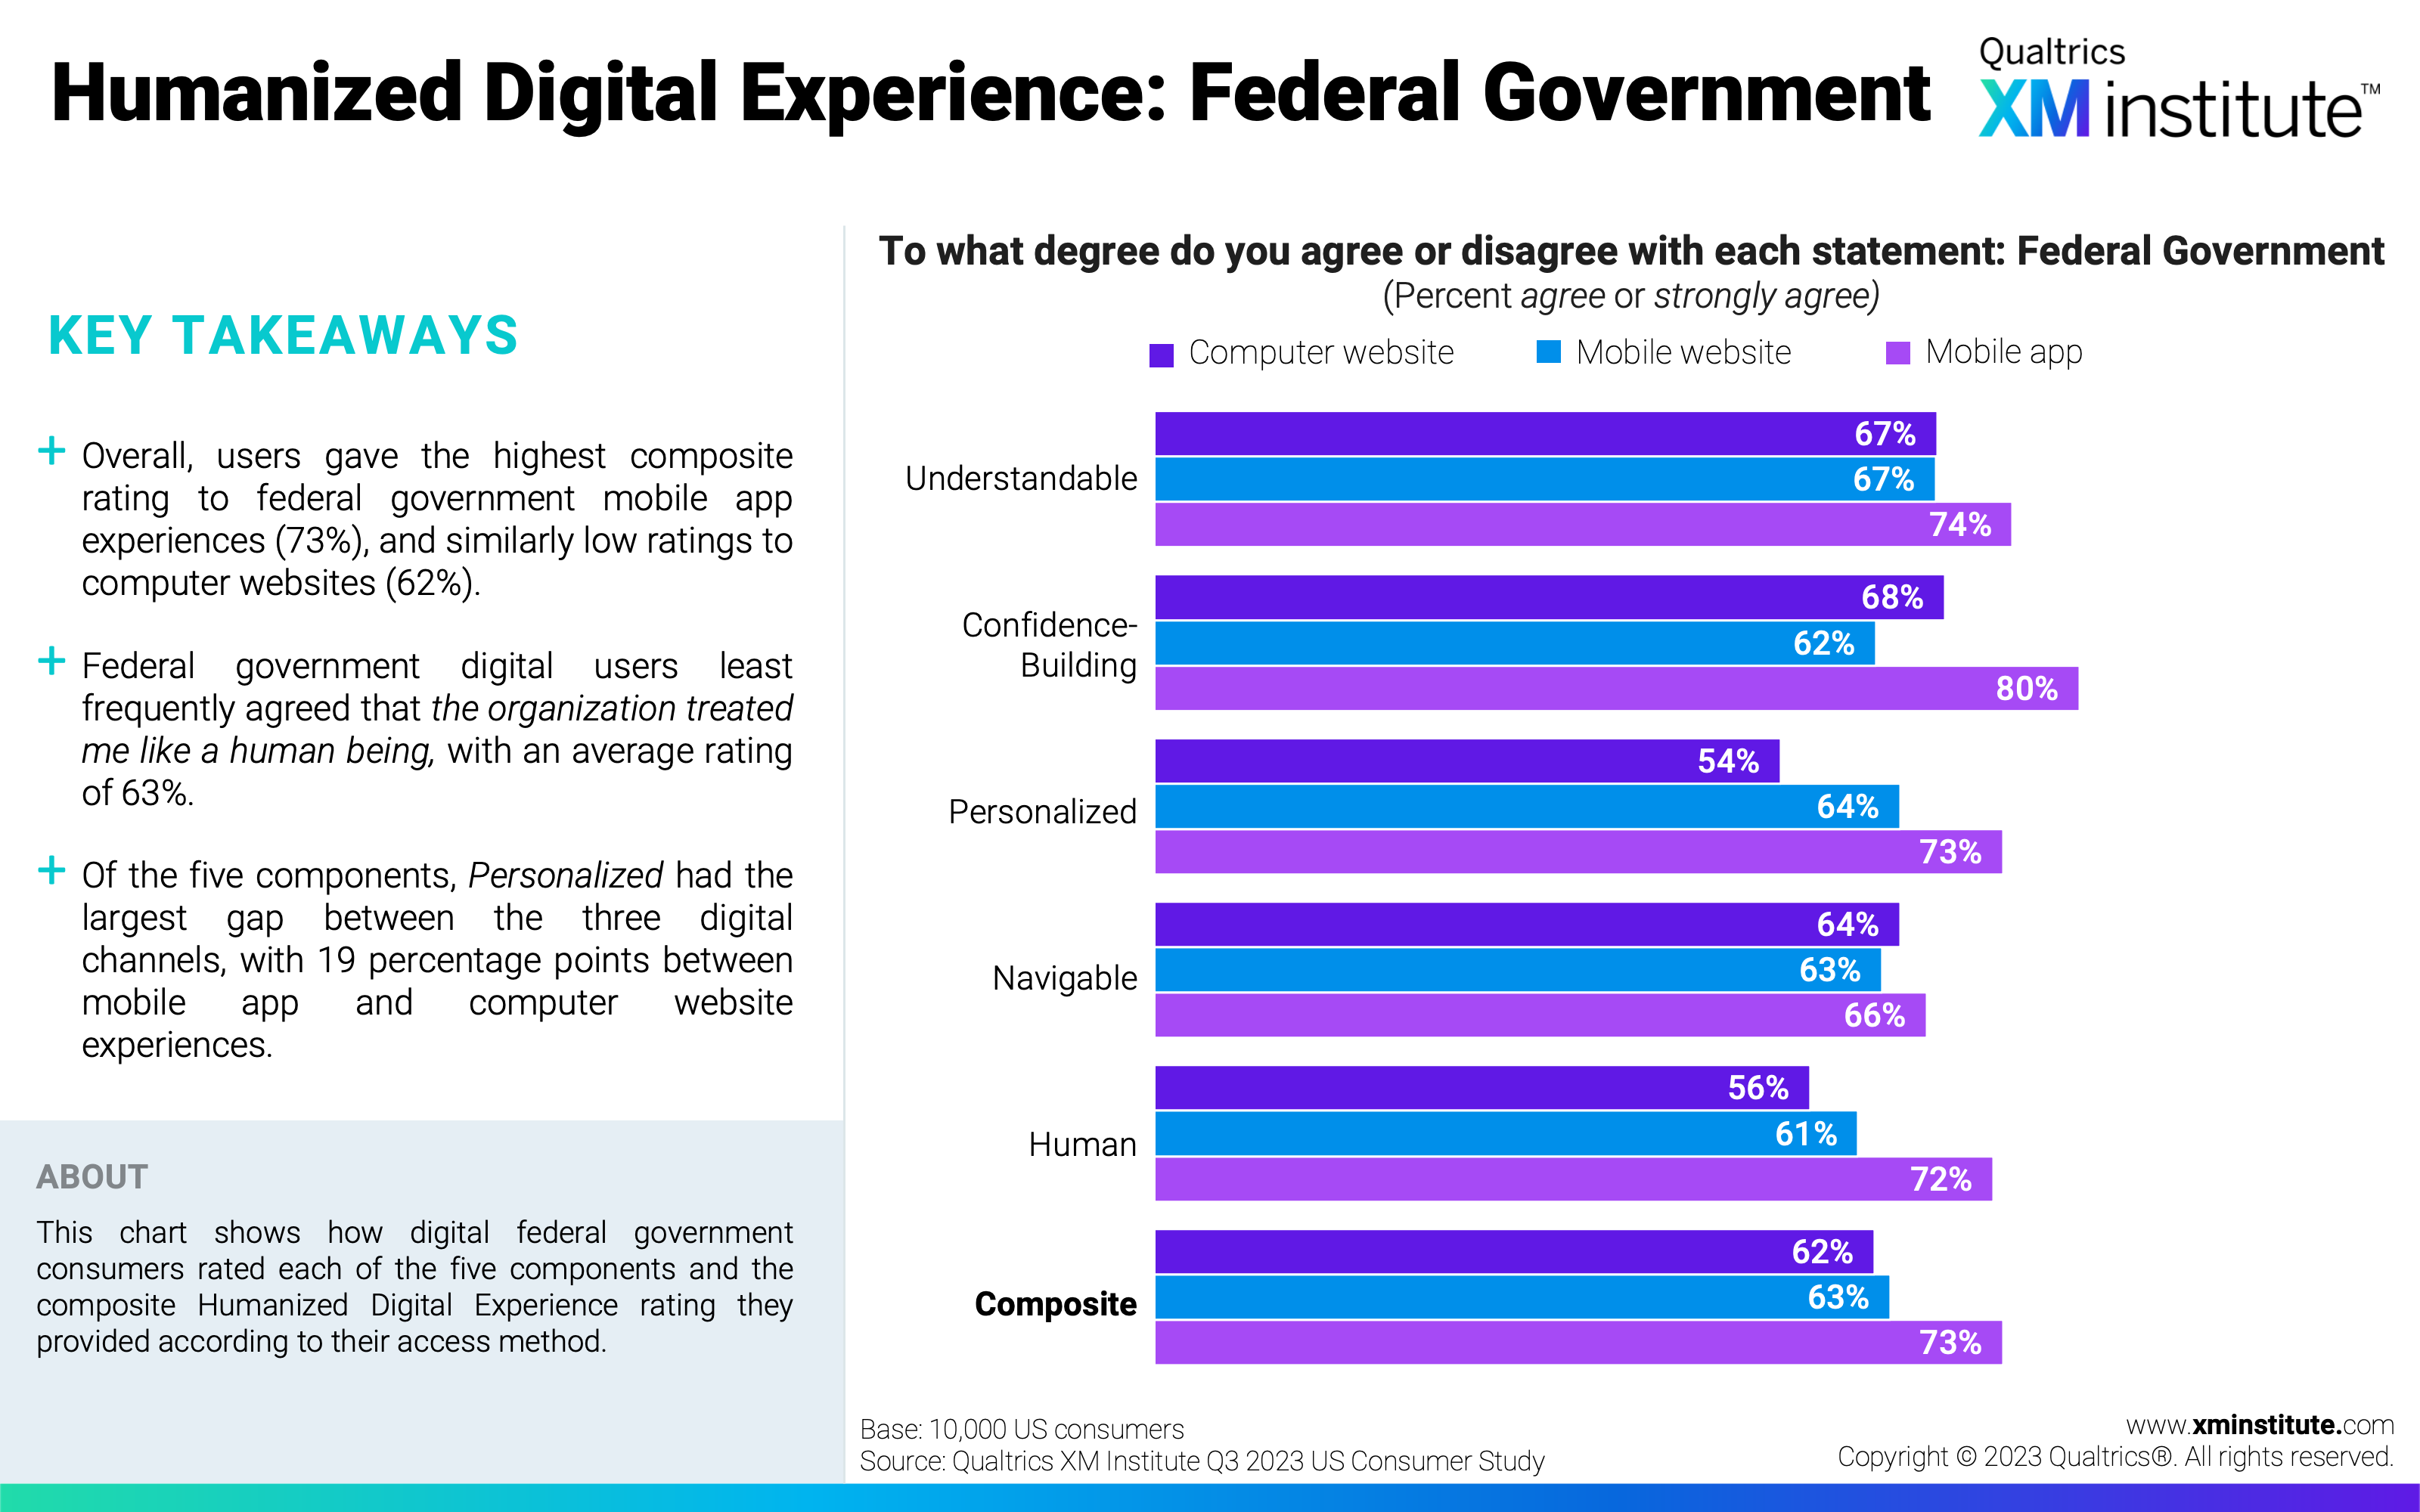
- Mobile apps deliver the best digital experiences. Across all industries, consumers gave the highest composite Humanized Digital Experience rating to mobile apps, with an average of 80%. In fact, mobile apps received the highest composite rating in every single industry, with the greatest gap (11 percentage points) between mobile app and computer/mobile website experiences with the federal government.
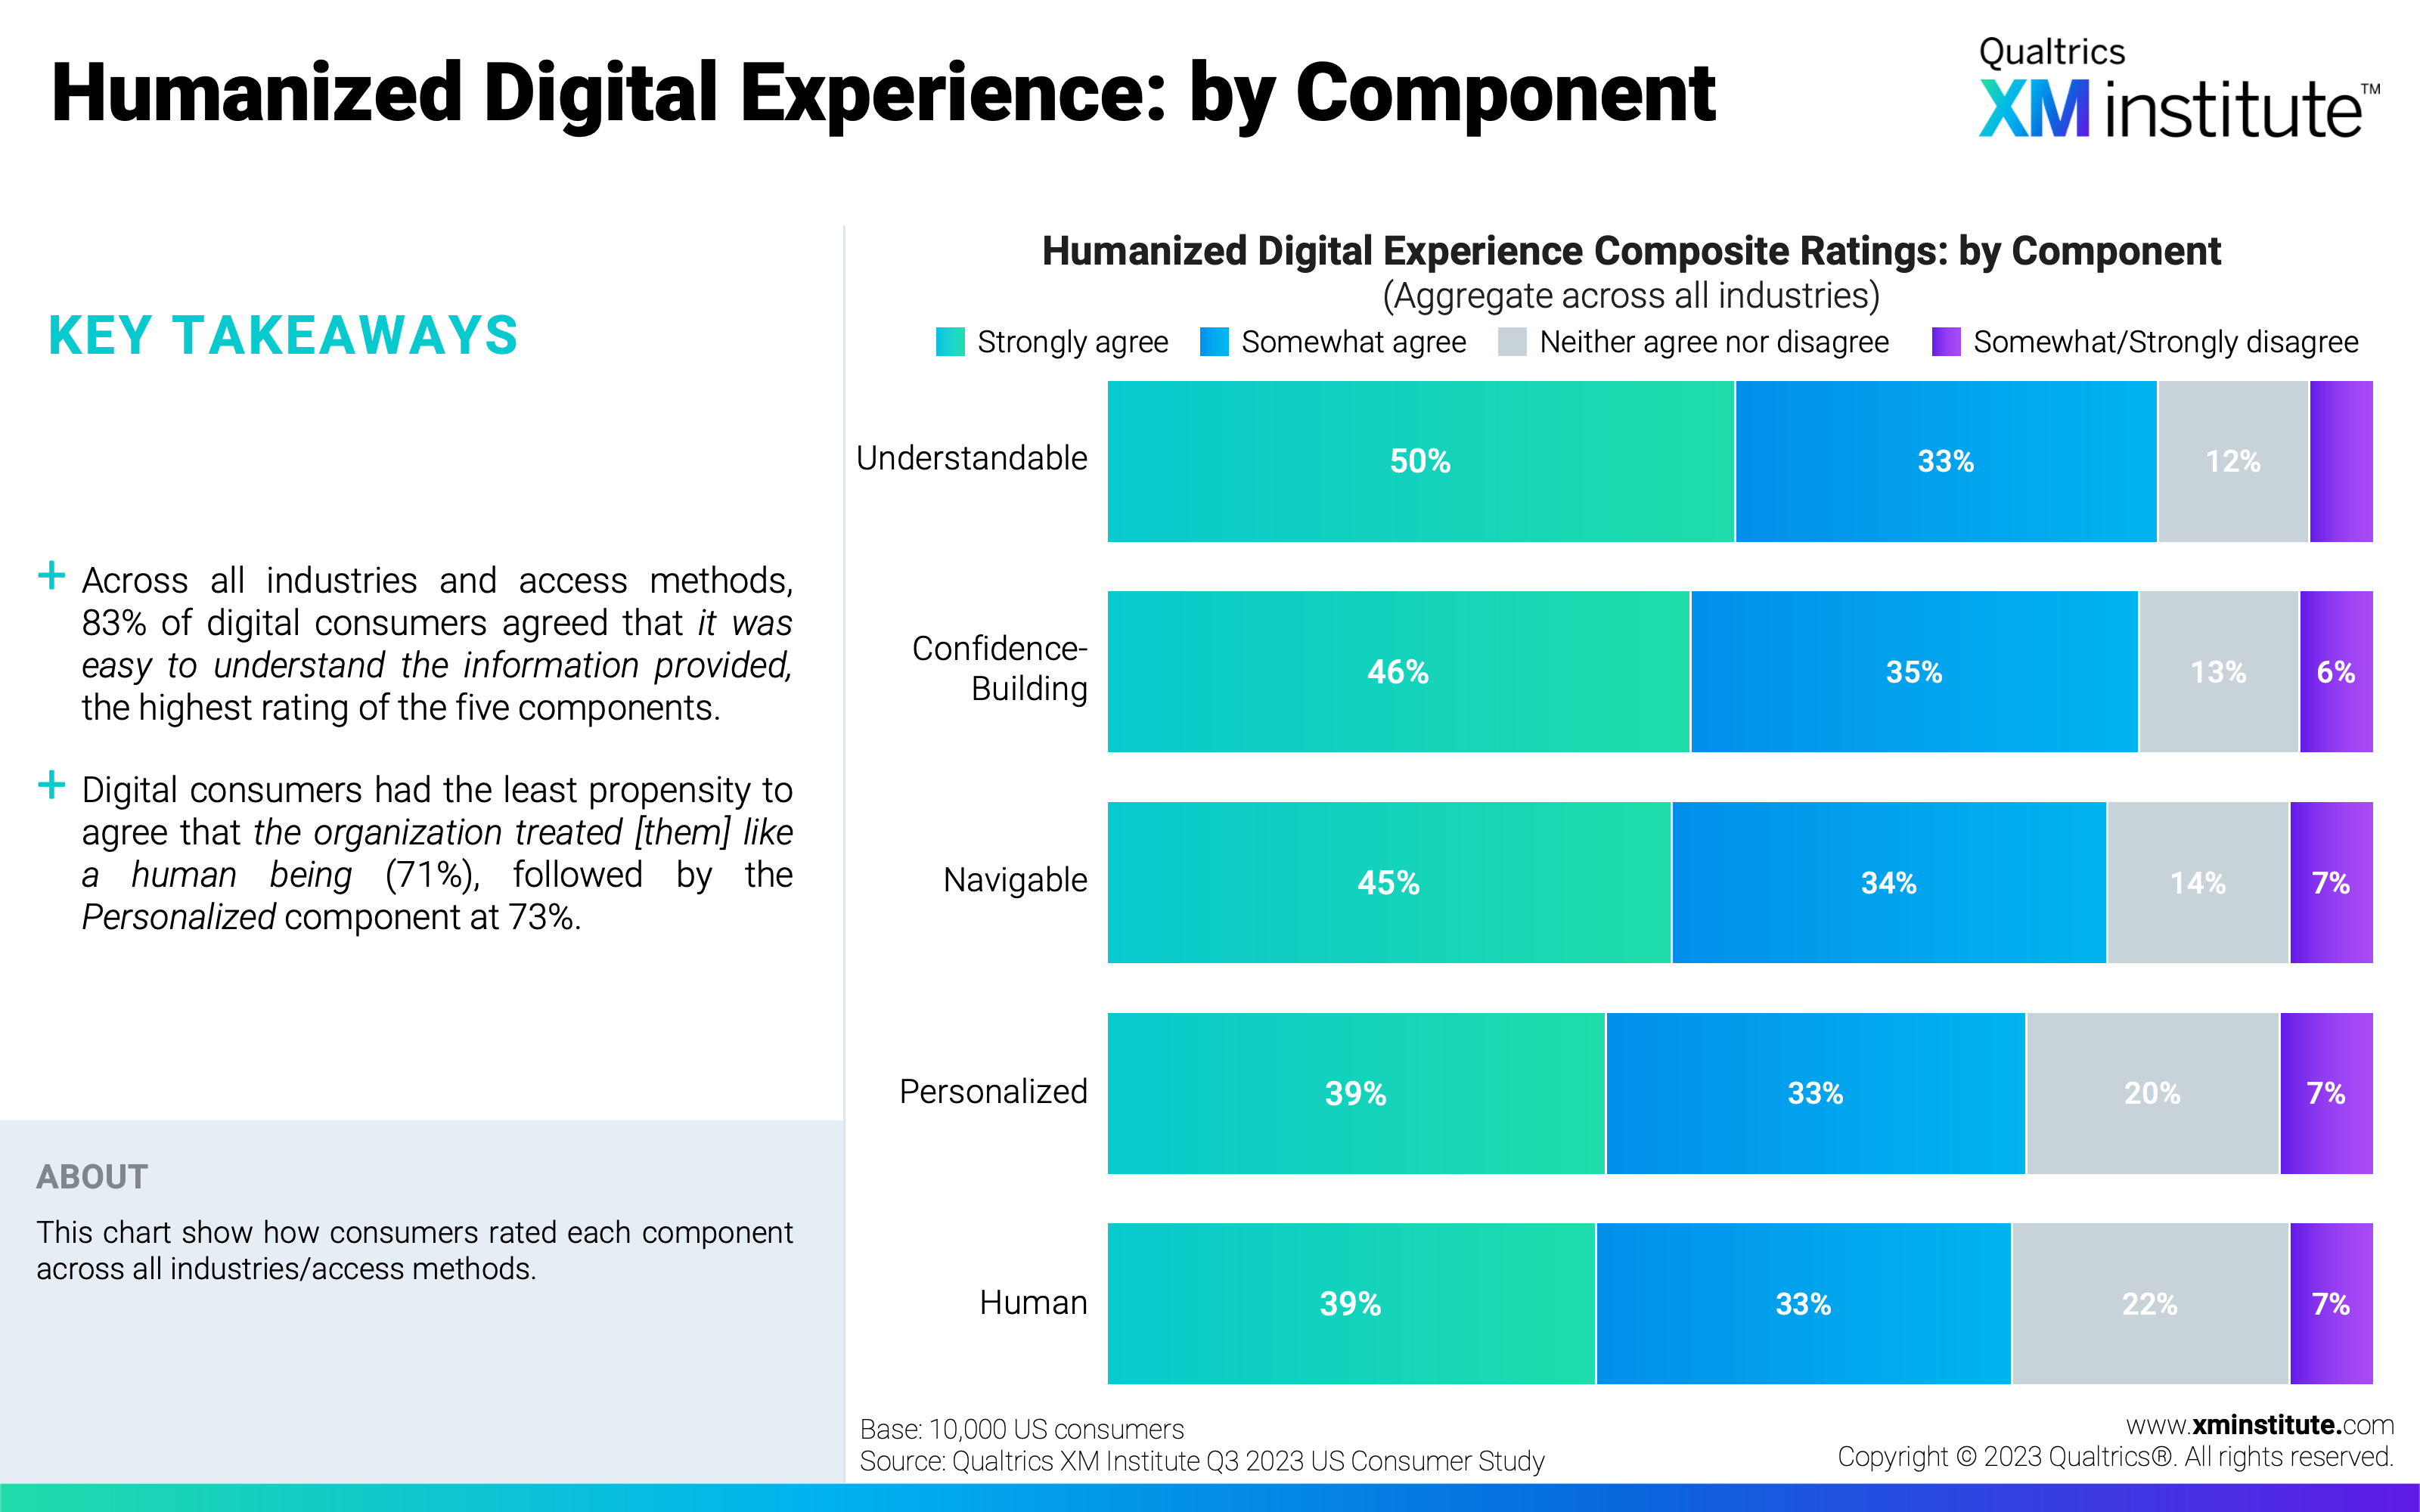
- Organizations struggle to create digital experiences that provide humanity and personalization. When evaluating their digital experiences, across all industries and access methods, consumers were least likely to agree that the organization treated me like a human being (71%) and the experience was personalized to my needs (73%).
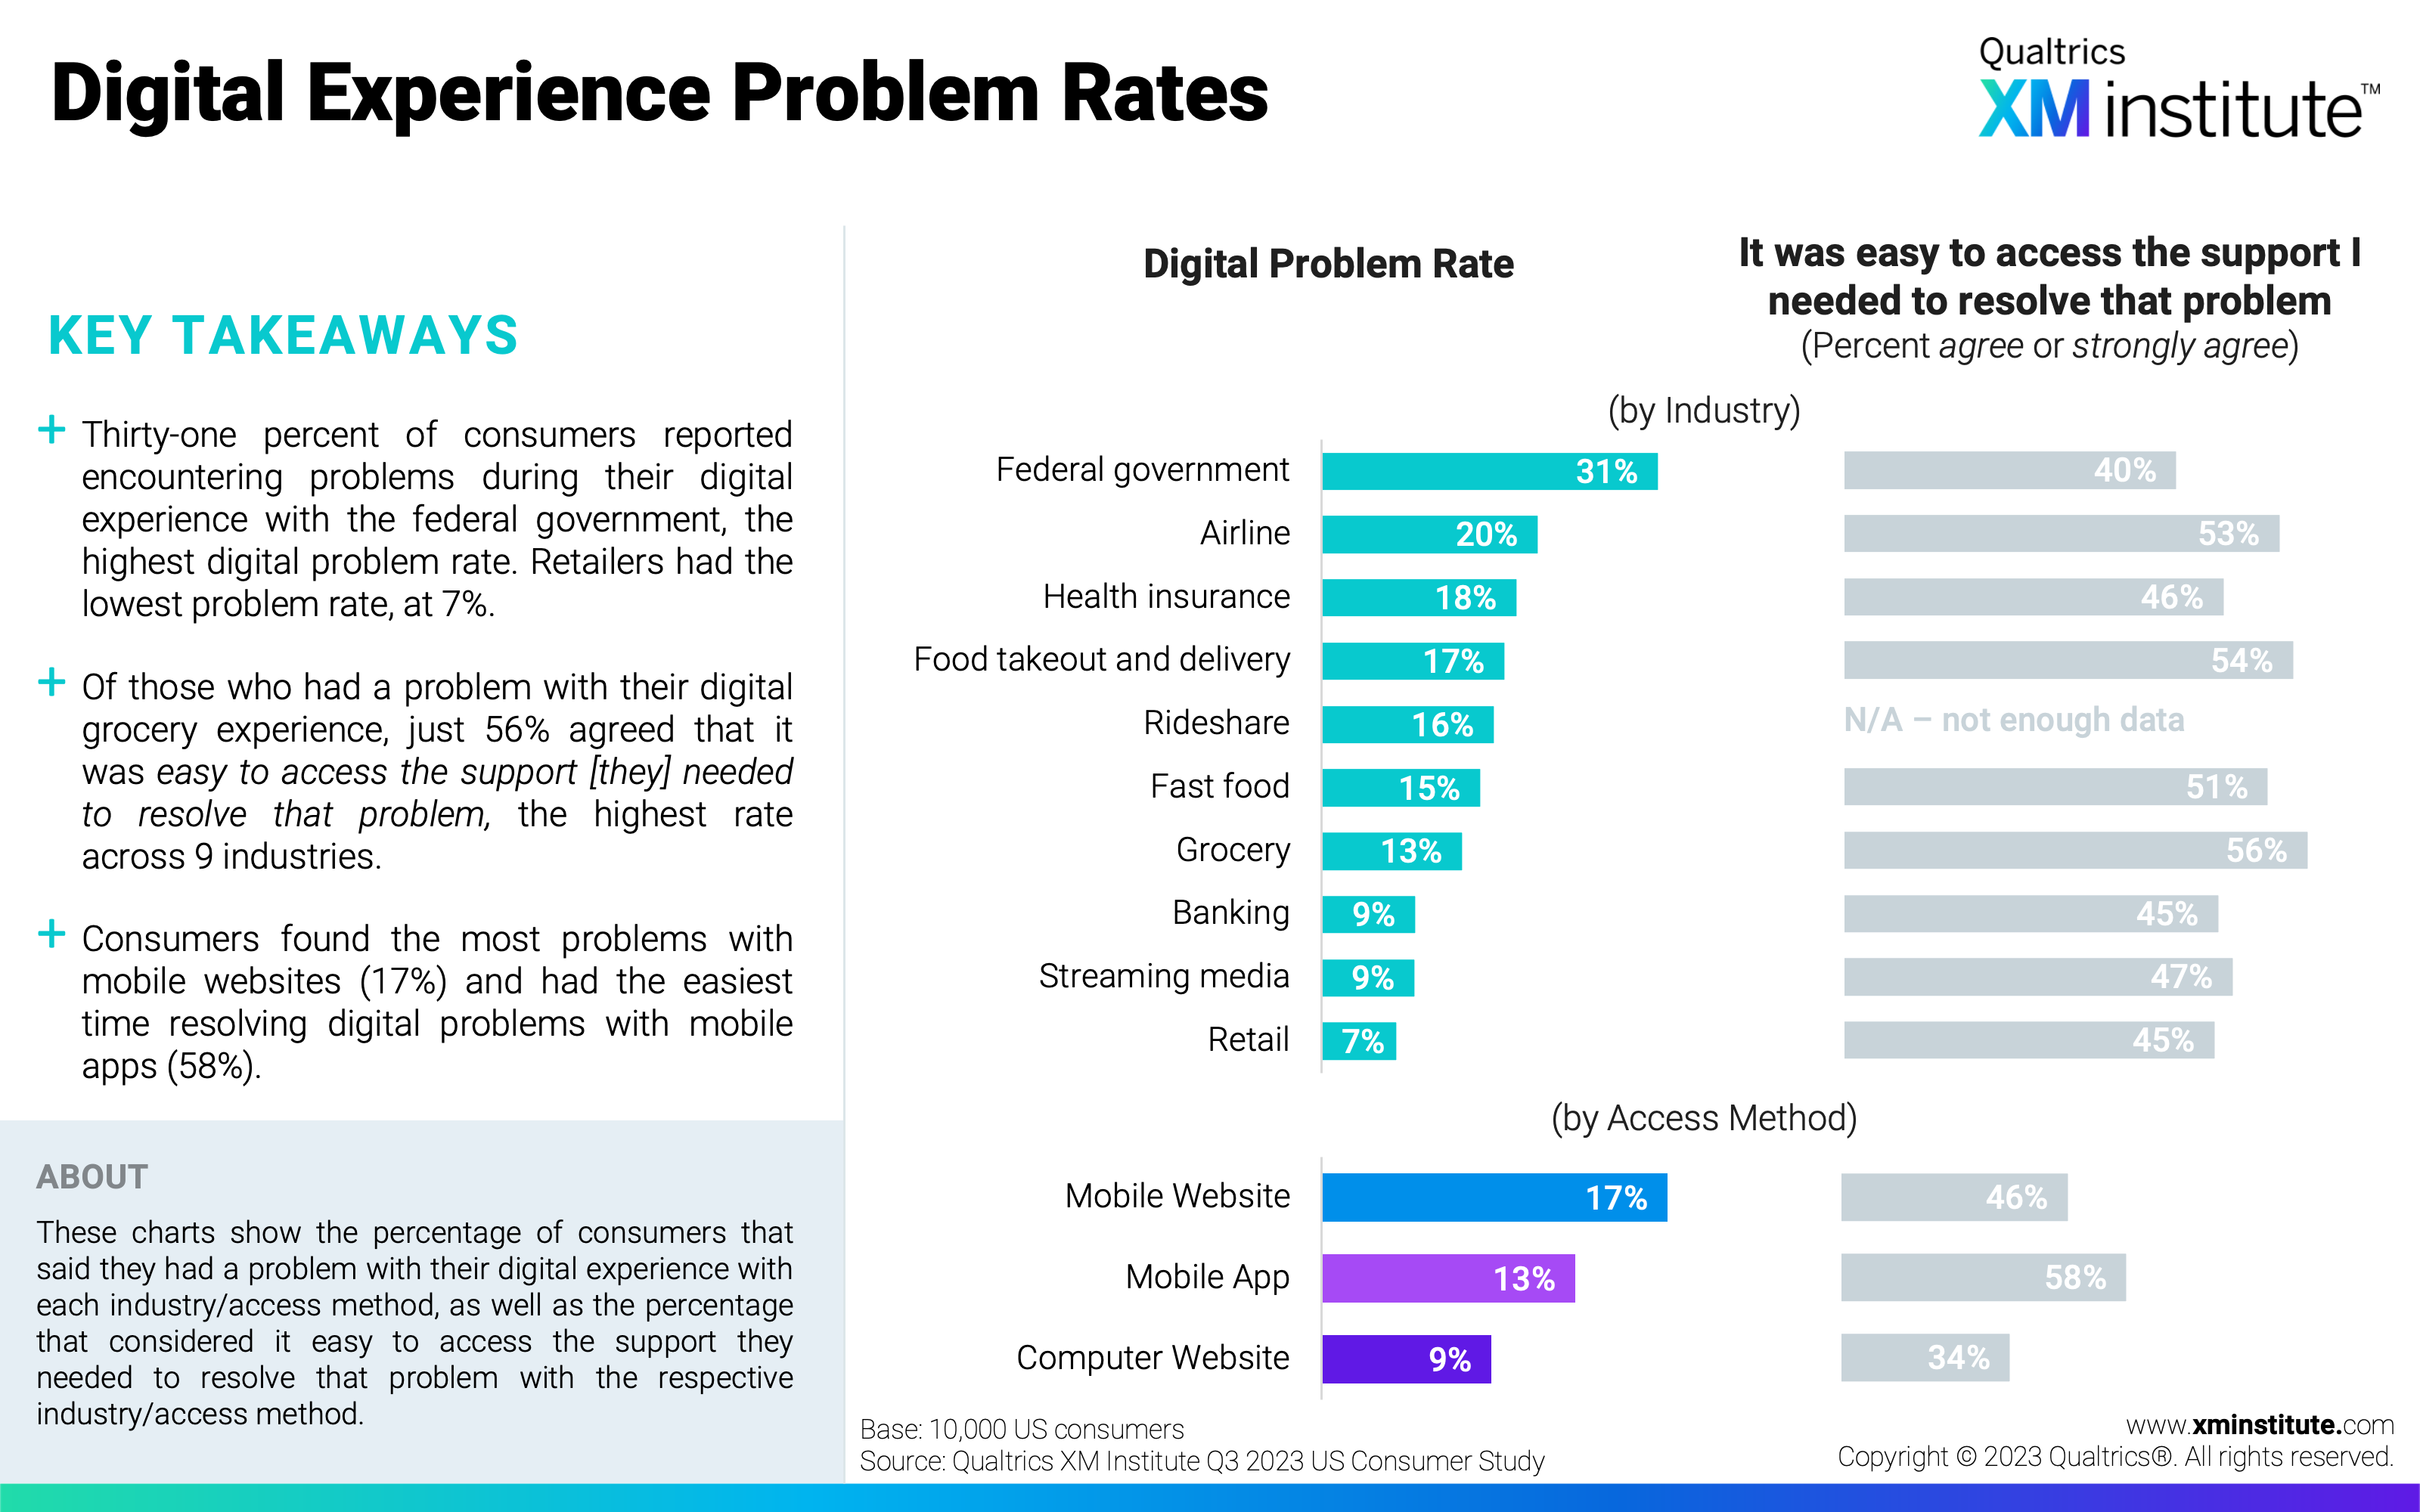
- The Food Takeout/Delivery and Retail industries provide the most consistent digital experiences. Across all ten industries surveyed, the food takeout/delivery and retail industries have the smallest gaps between the experiences delivered across the three access methods, at just 3 and 4 percentage points, respectively. Consumers also least frequently reported problems with their digital retail experience, at a rate of just 7%.
- Users report the worst experience with mobile websites. Of the three access methods, users gave the lowest Humanized Digital Experience ratings to mobile websites (73%). They also reported experiencing problems most frequently with this access method (17%), and just 46% agreed that it was easy to access the support [they] needed to resolve that problem.
Figures
Here are the figures in this Data Snapshot:
- 5 Components of a Humanized Digital Experience
- Humanized Digital Experience: by Industry and Access Method
- Humanized Digital Experience: by Component
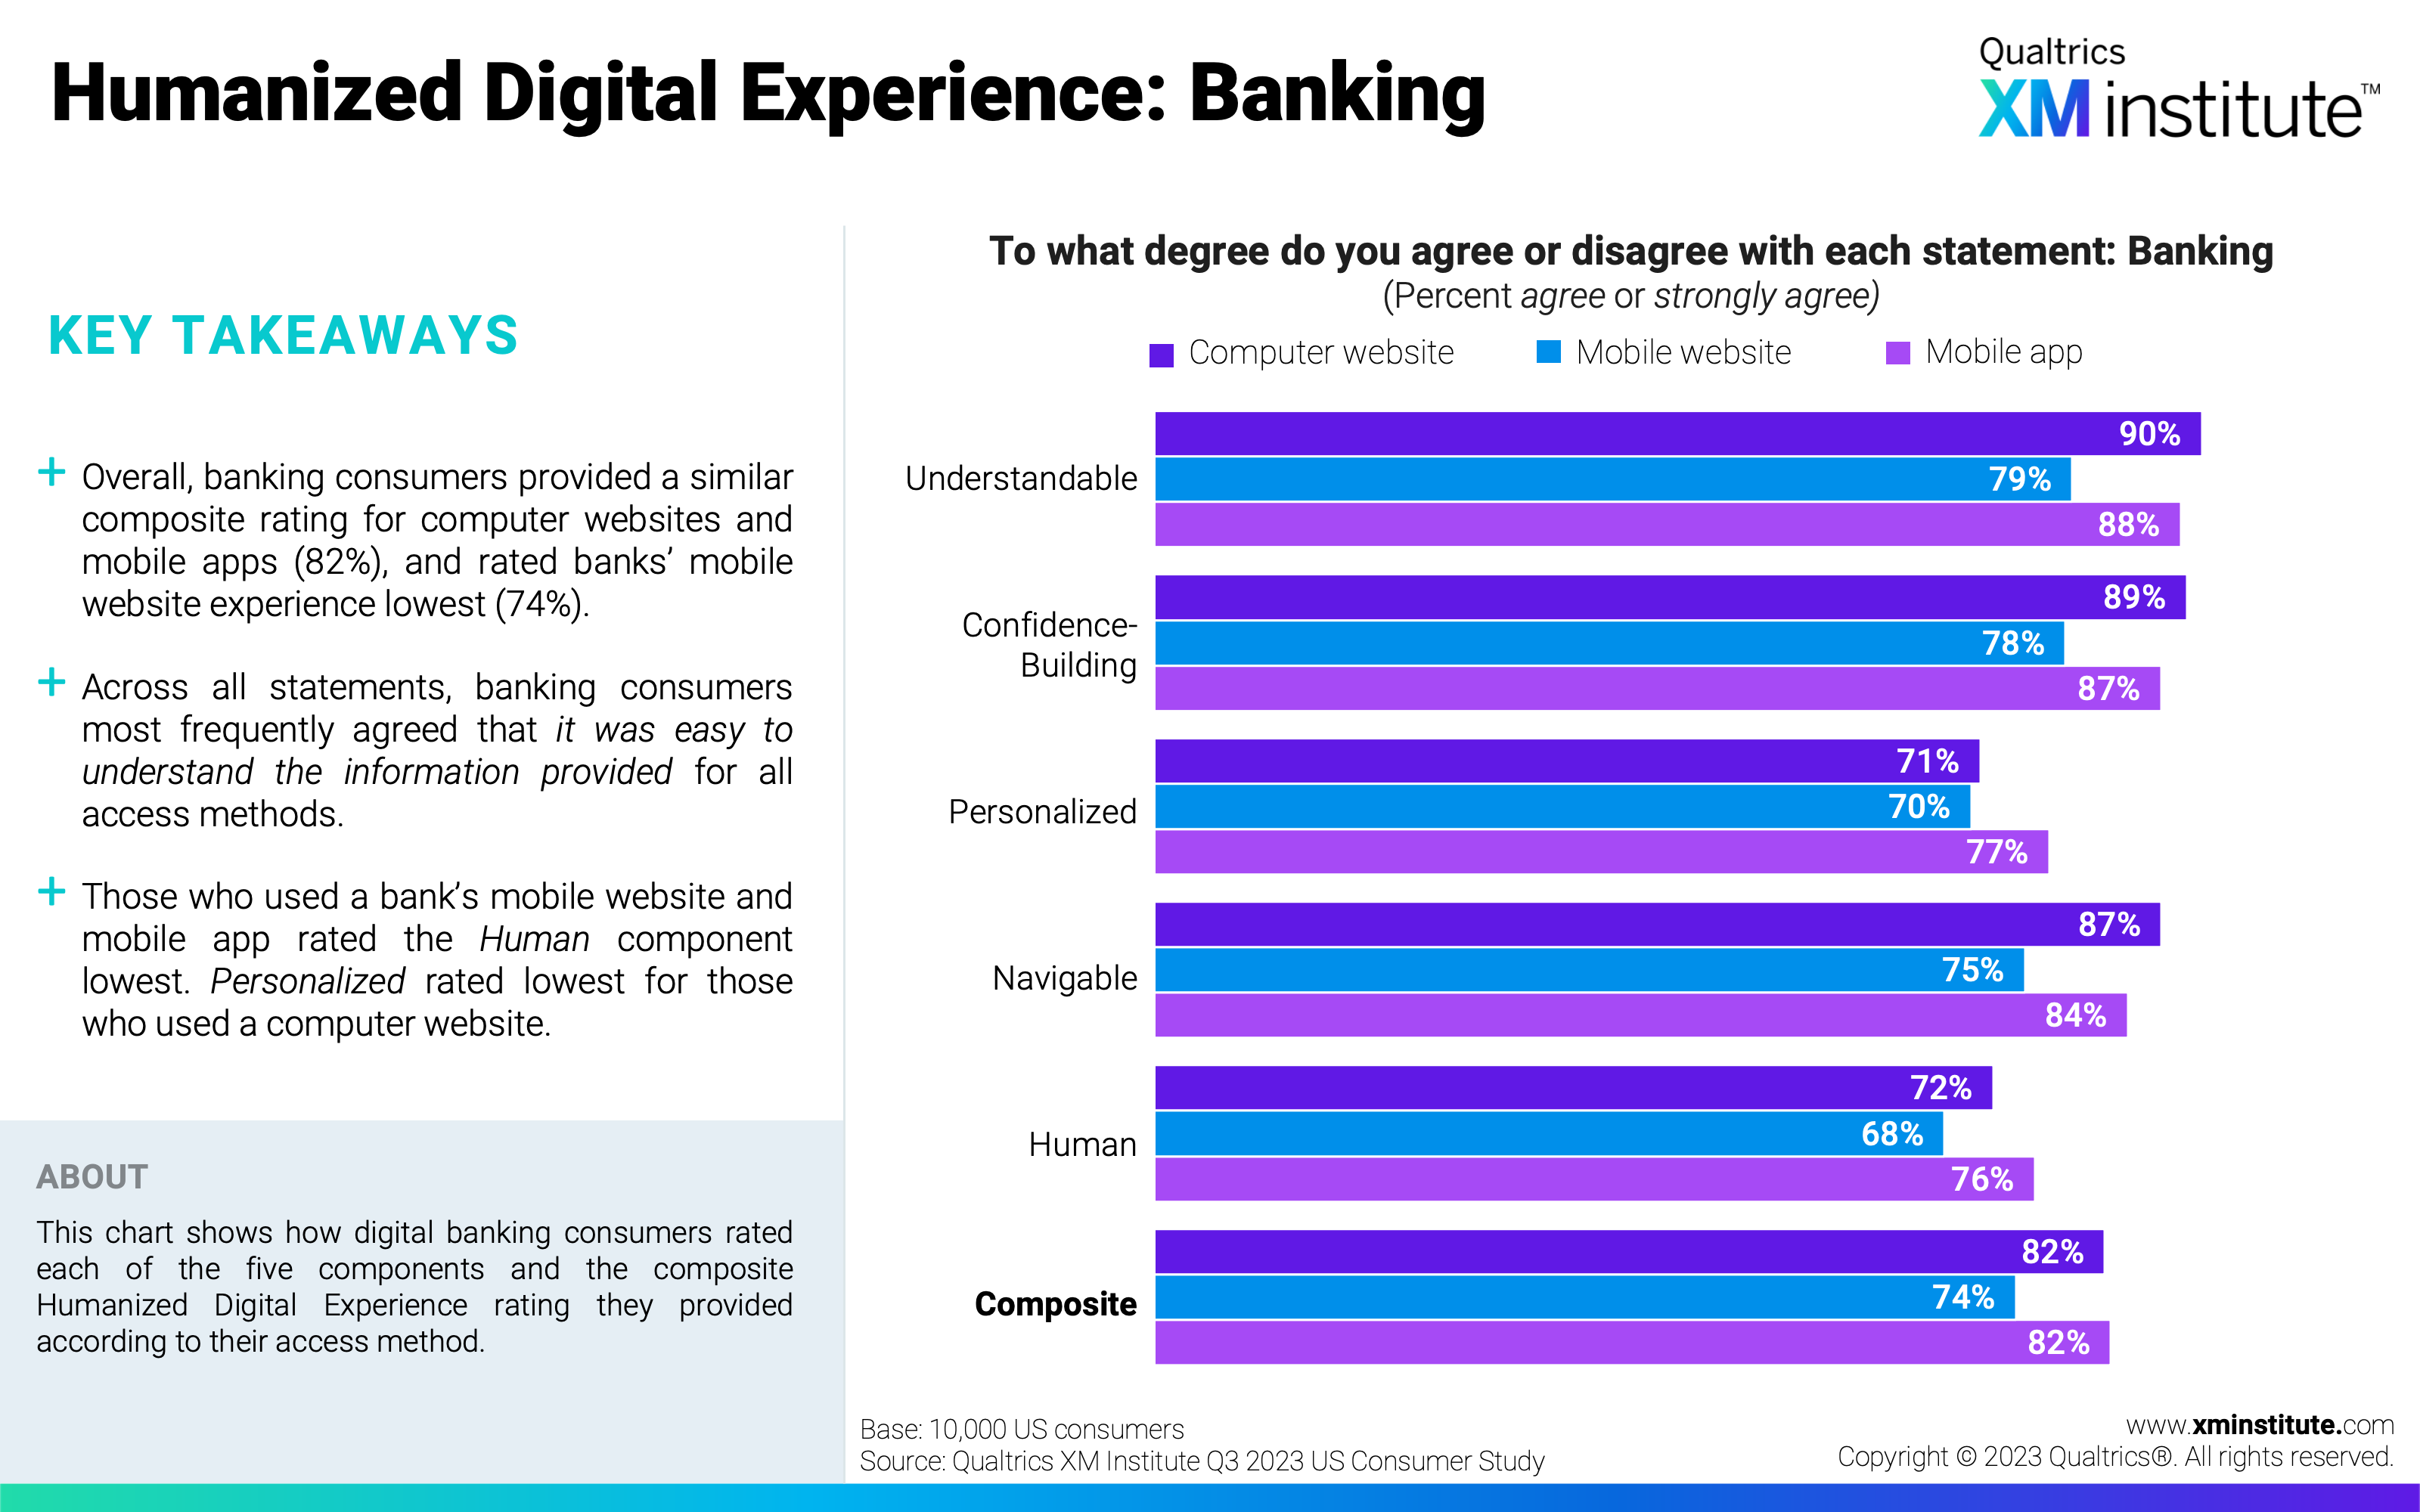
- Humanized Digital Experience: Banking
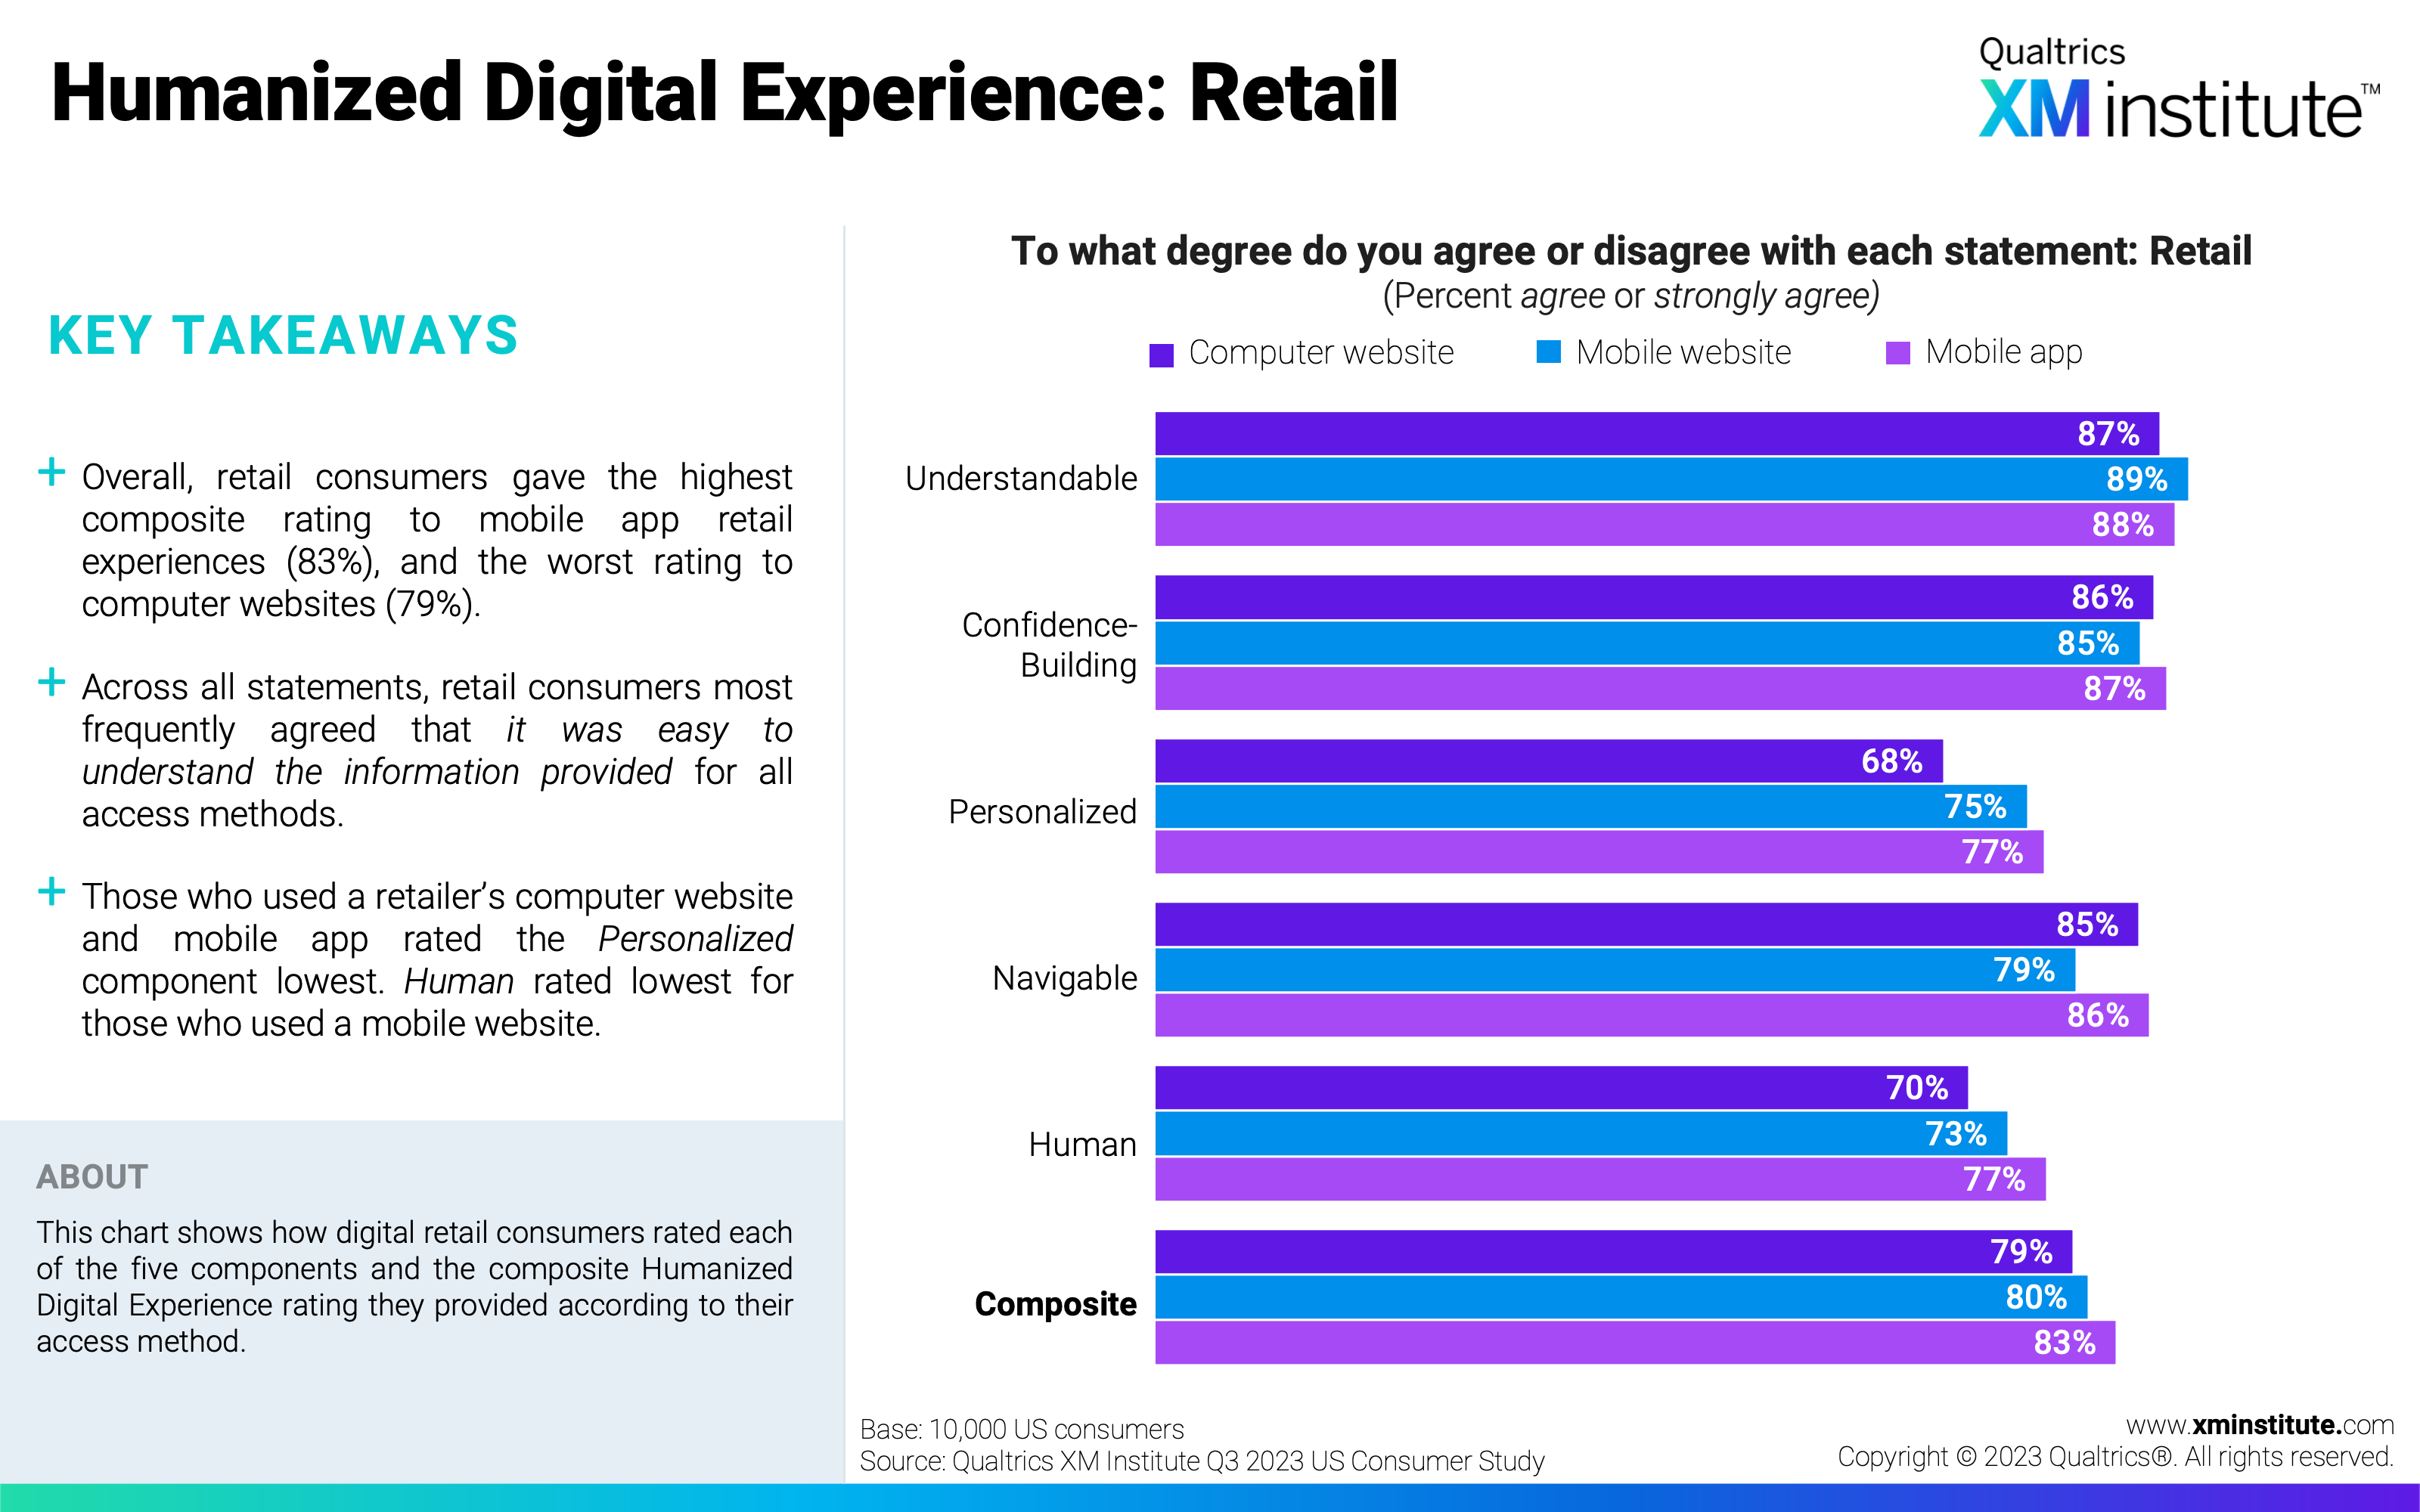
- Humanized Digital Experience: Retail
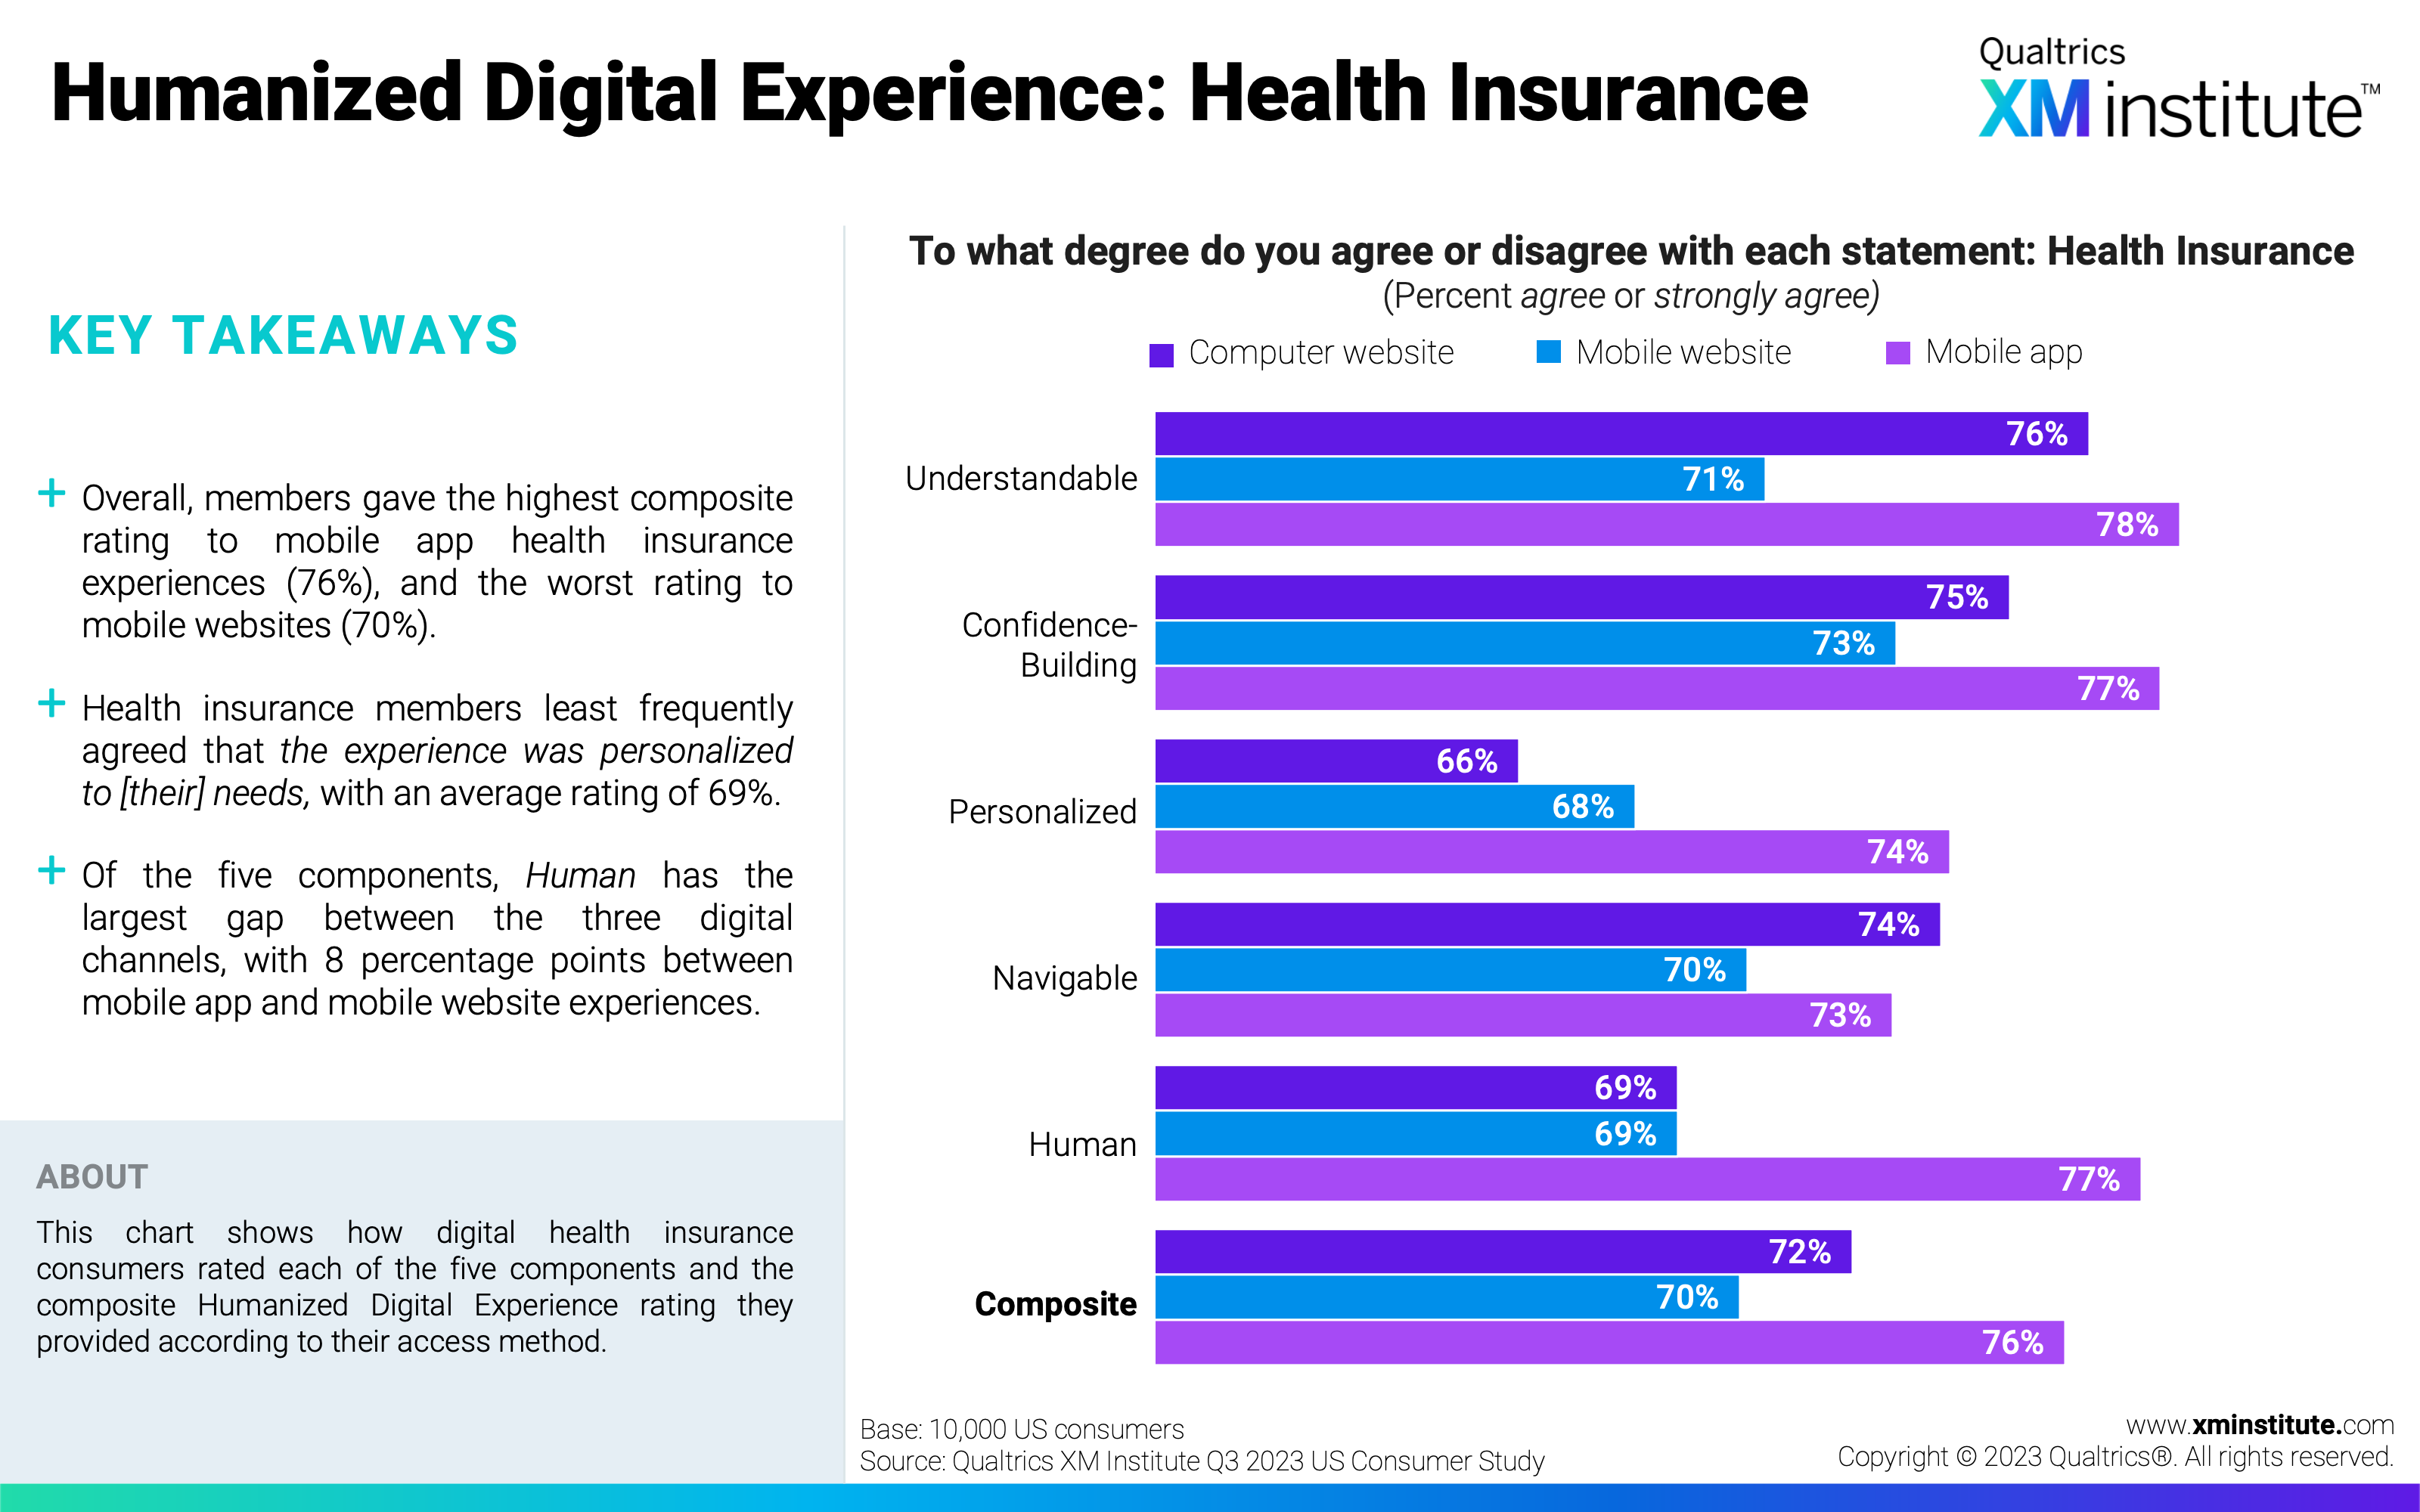
- Humanized Digital Experience: Health Insurance
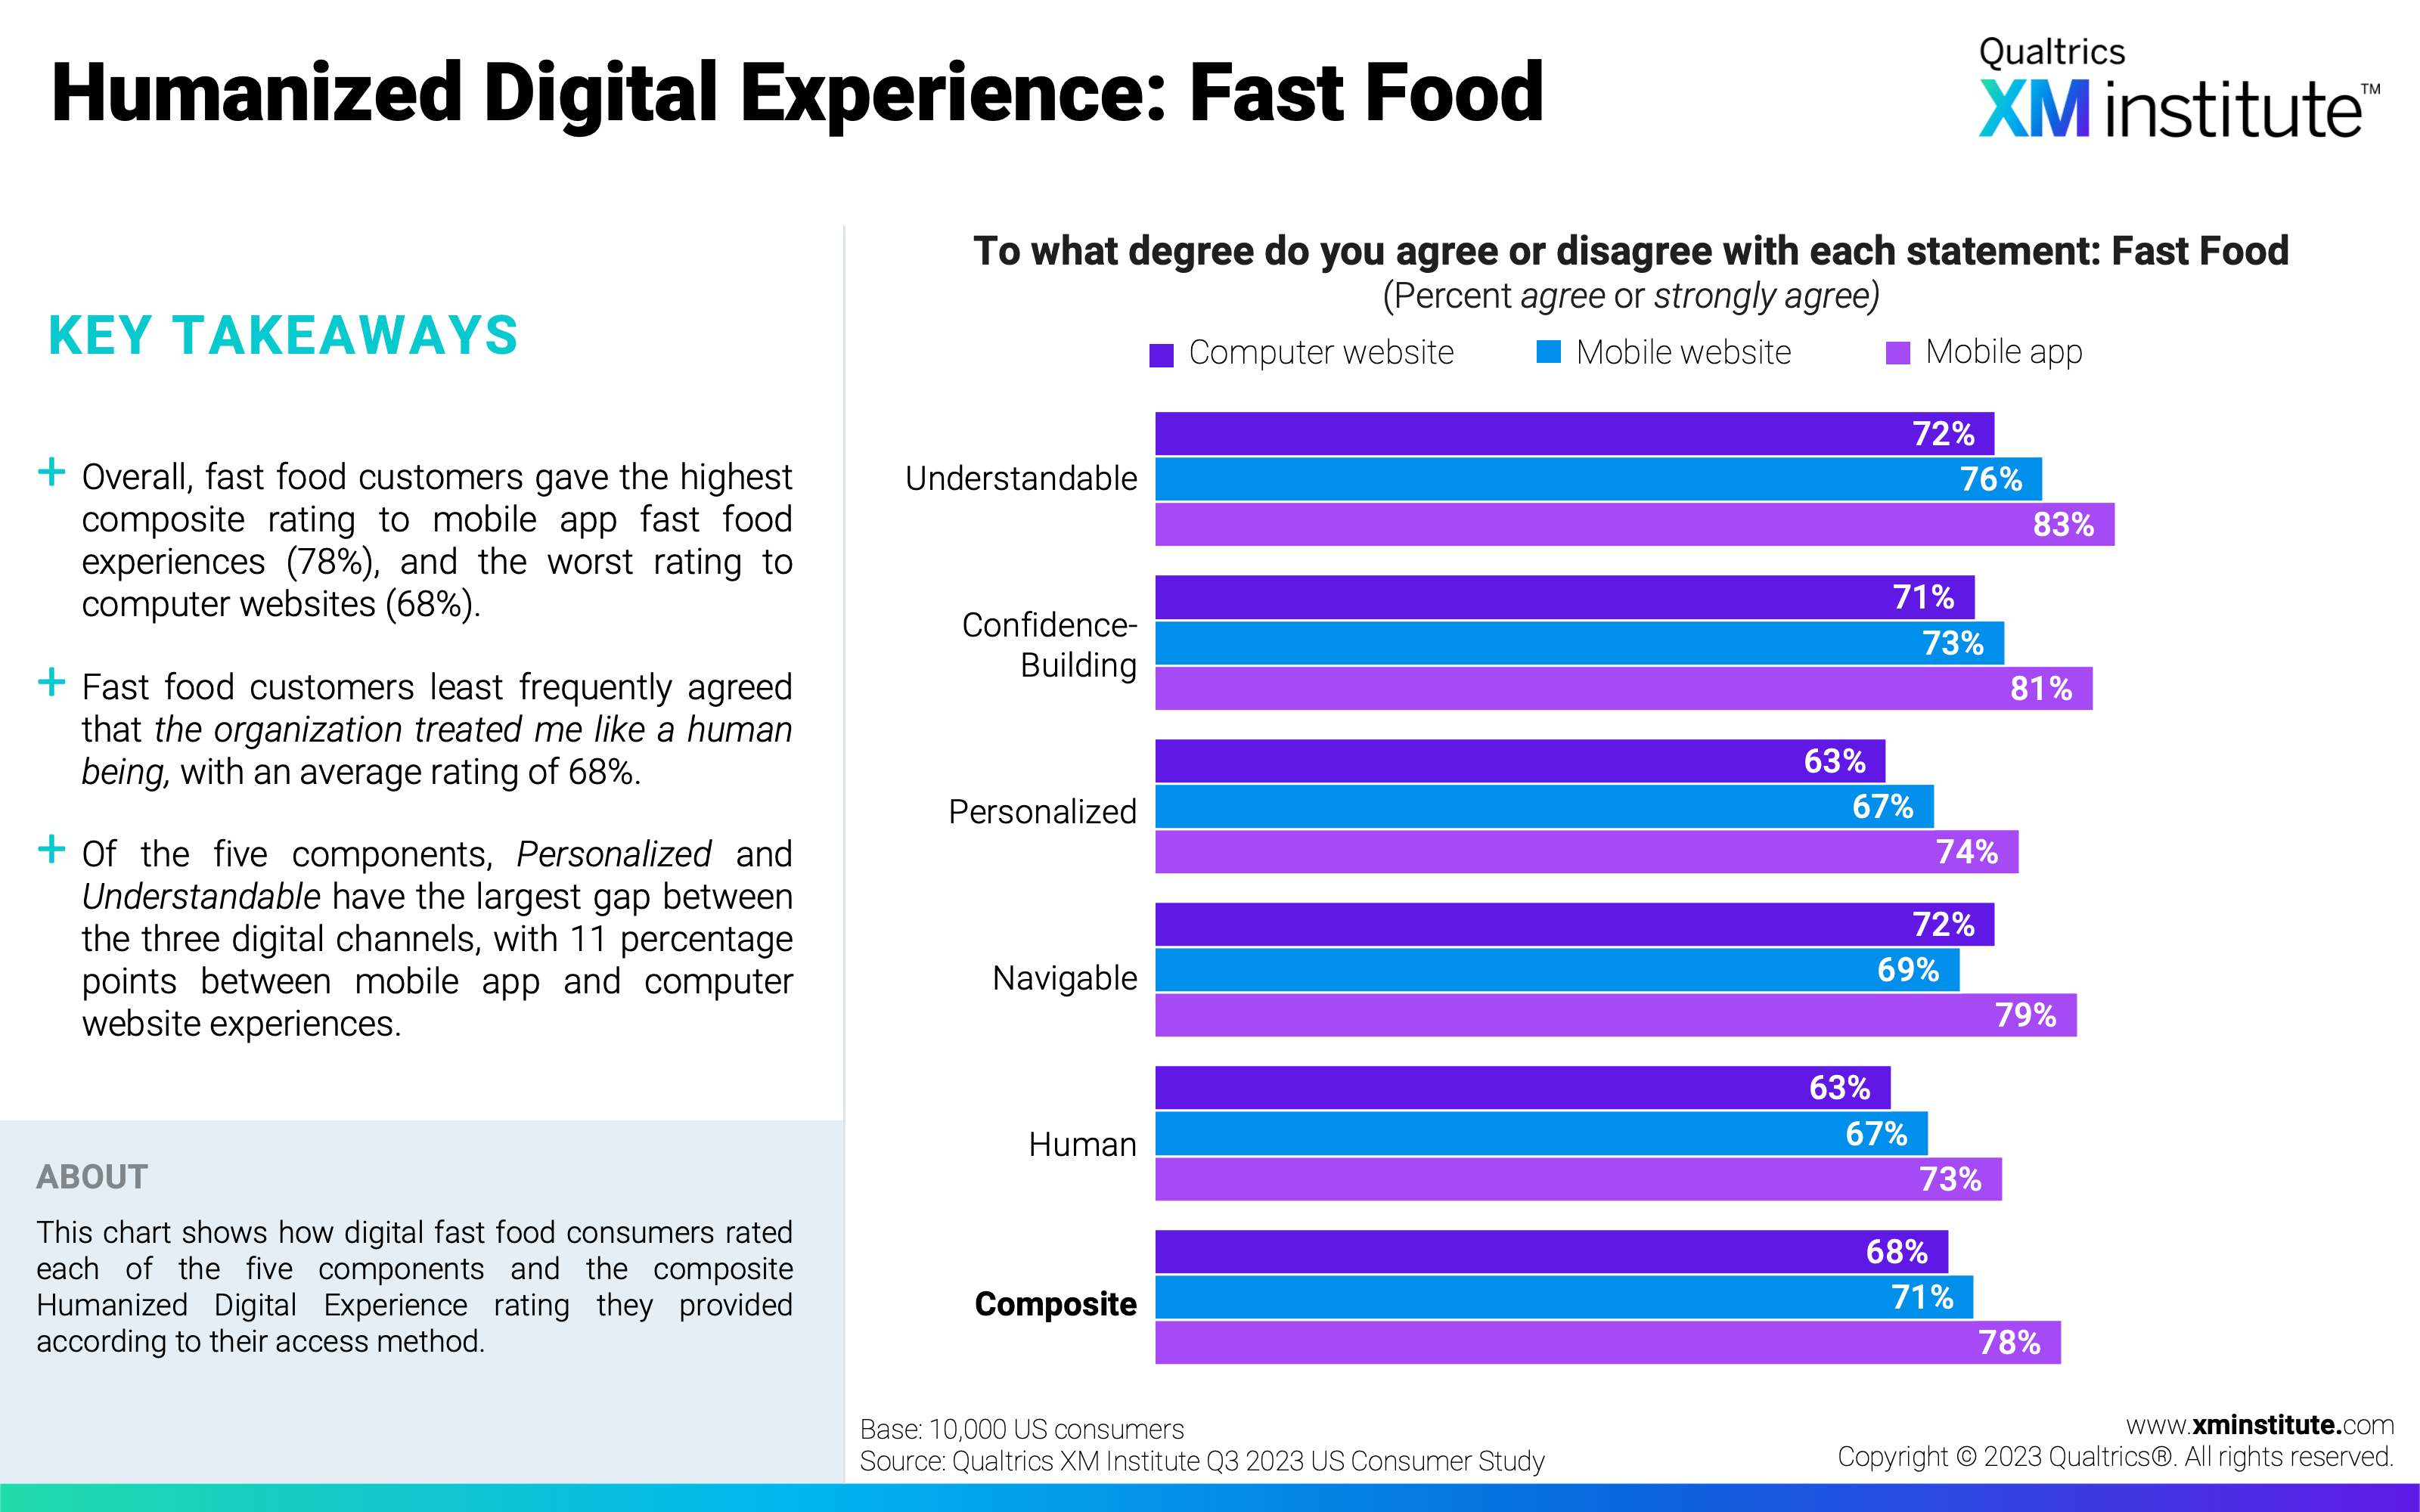
- Humanized Digital Experience: Fast Food
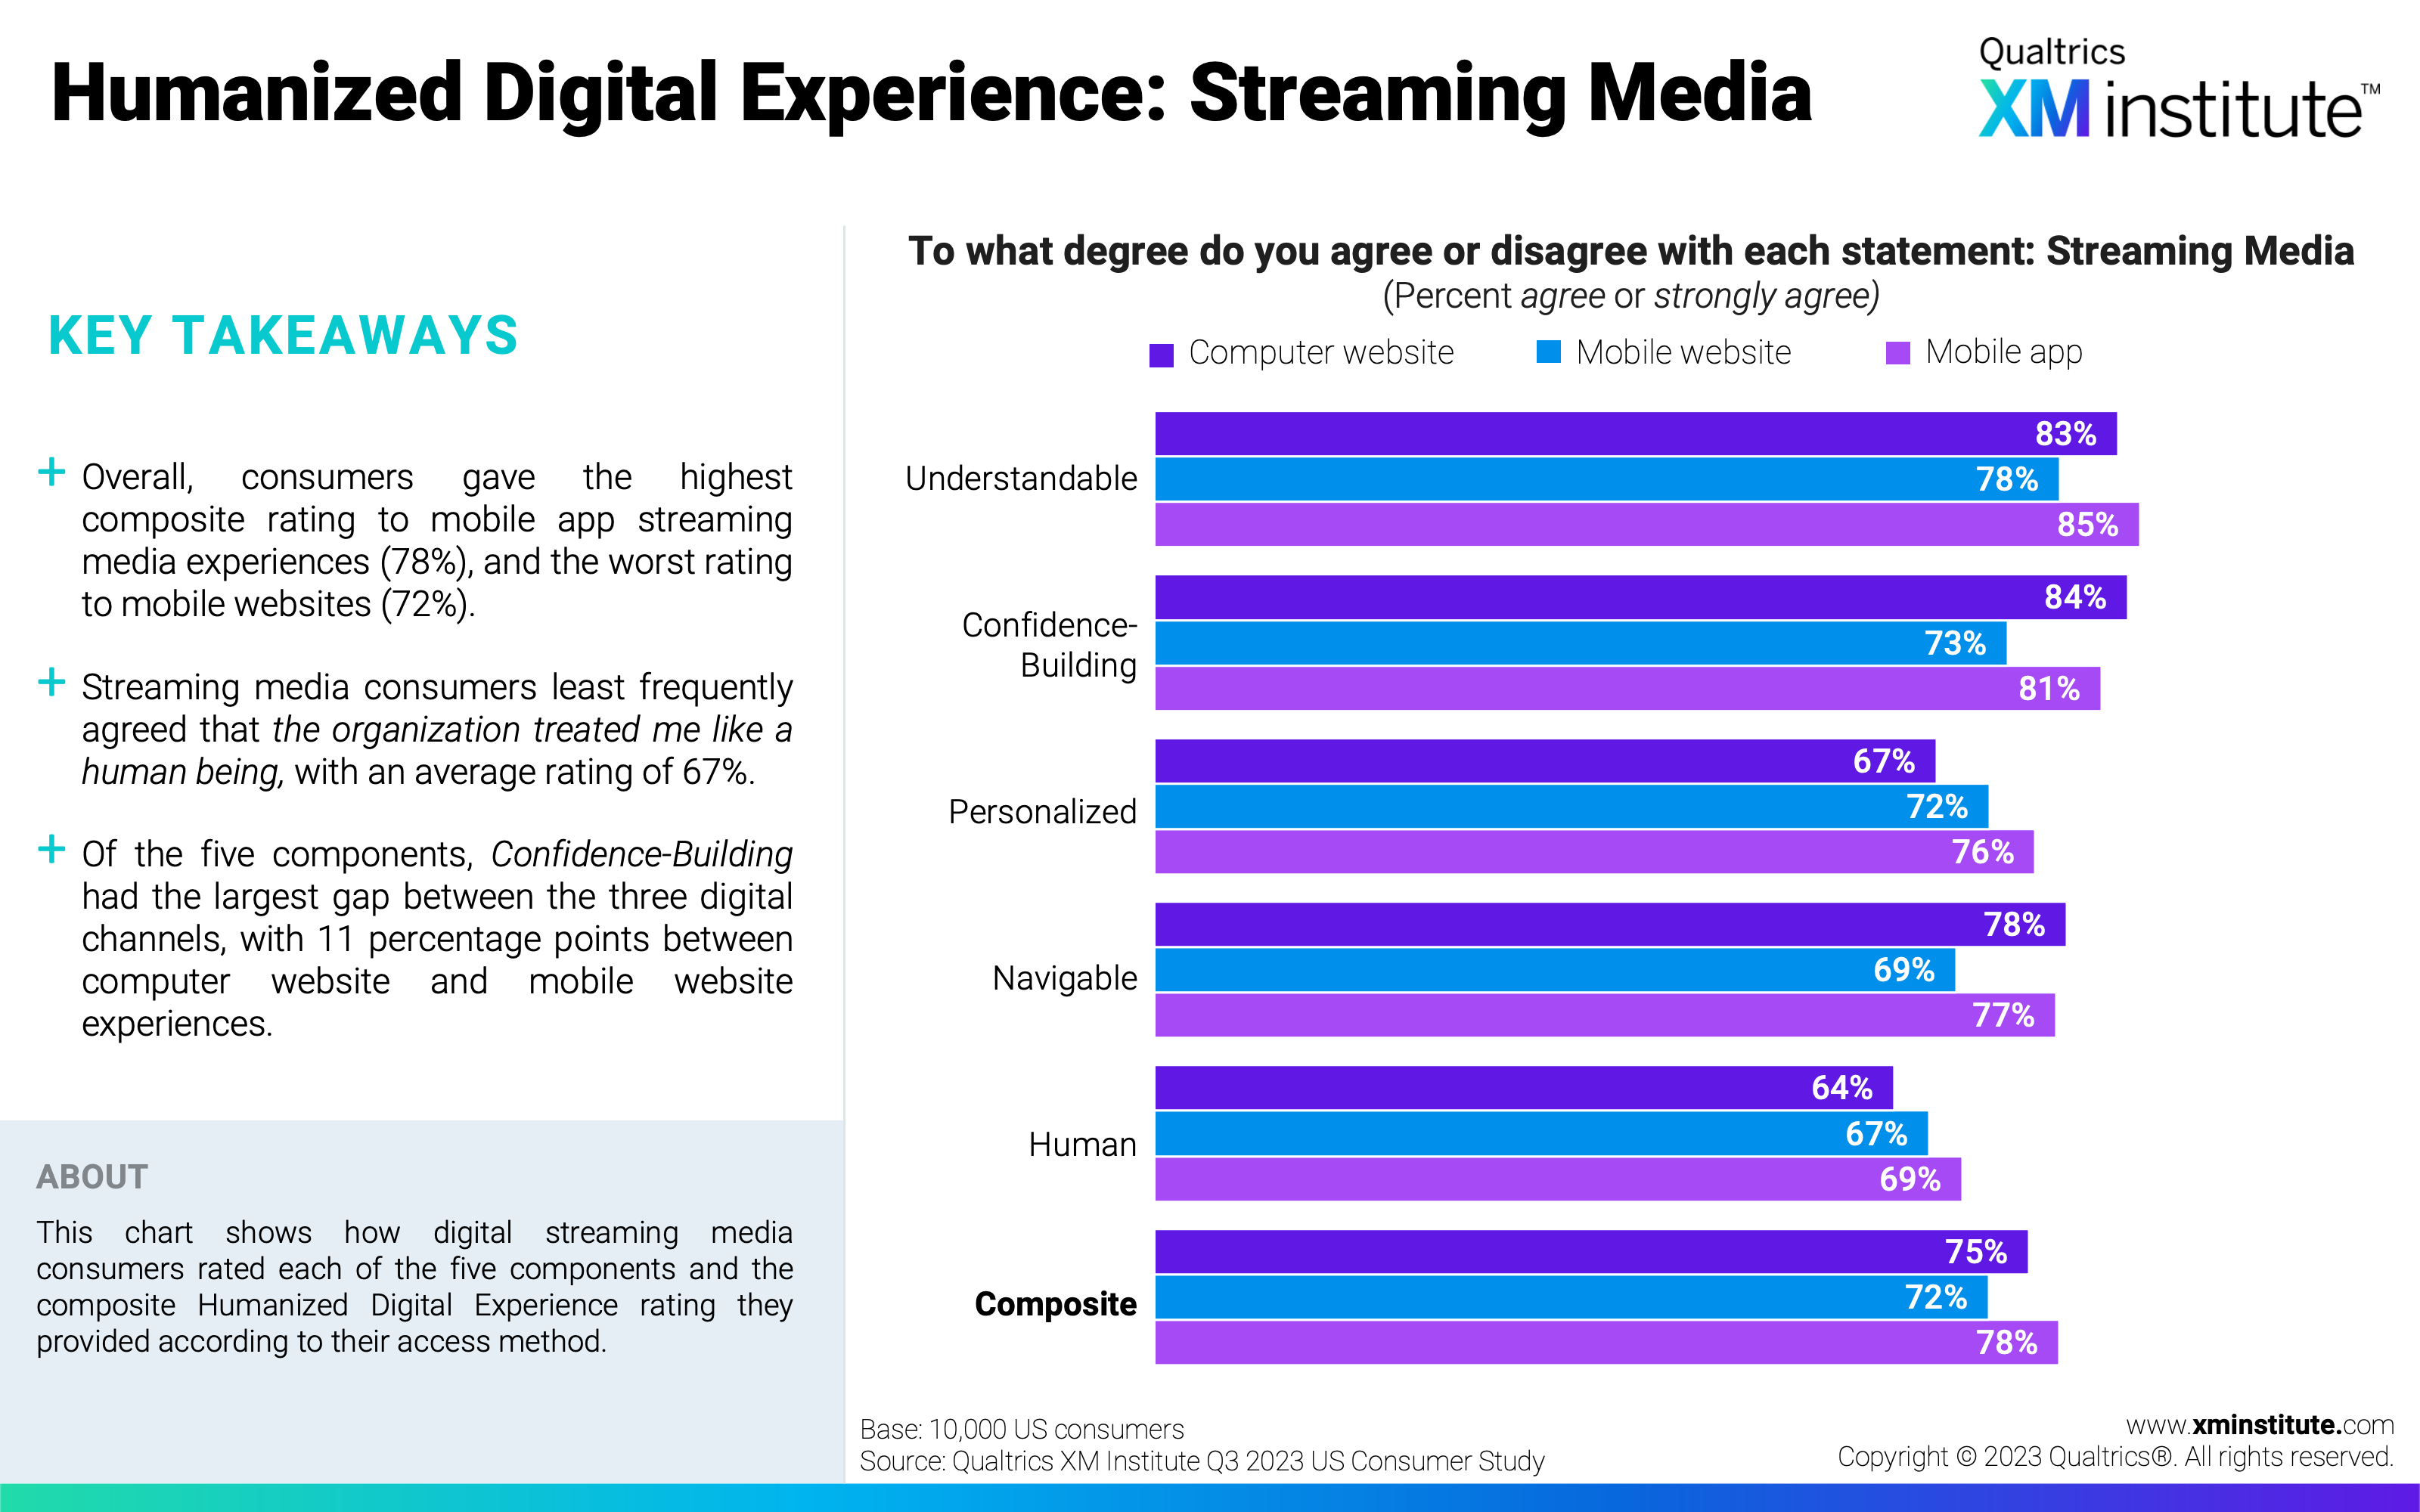
- Humanized Digital Experience: Streaming Media
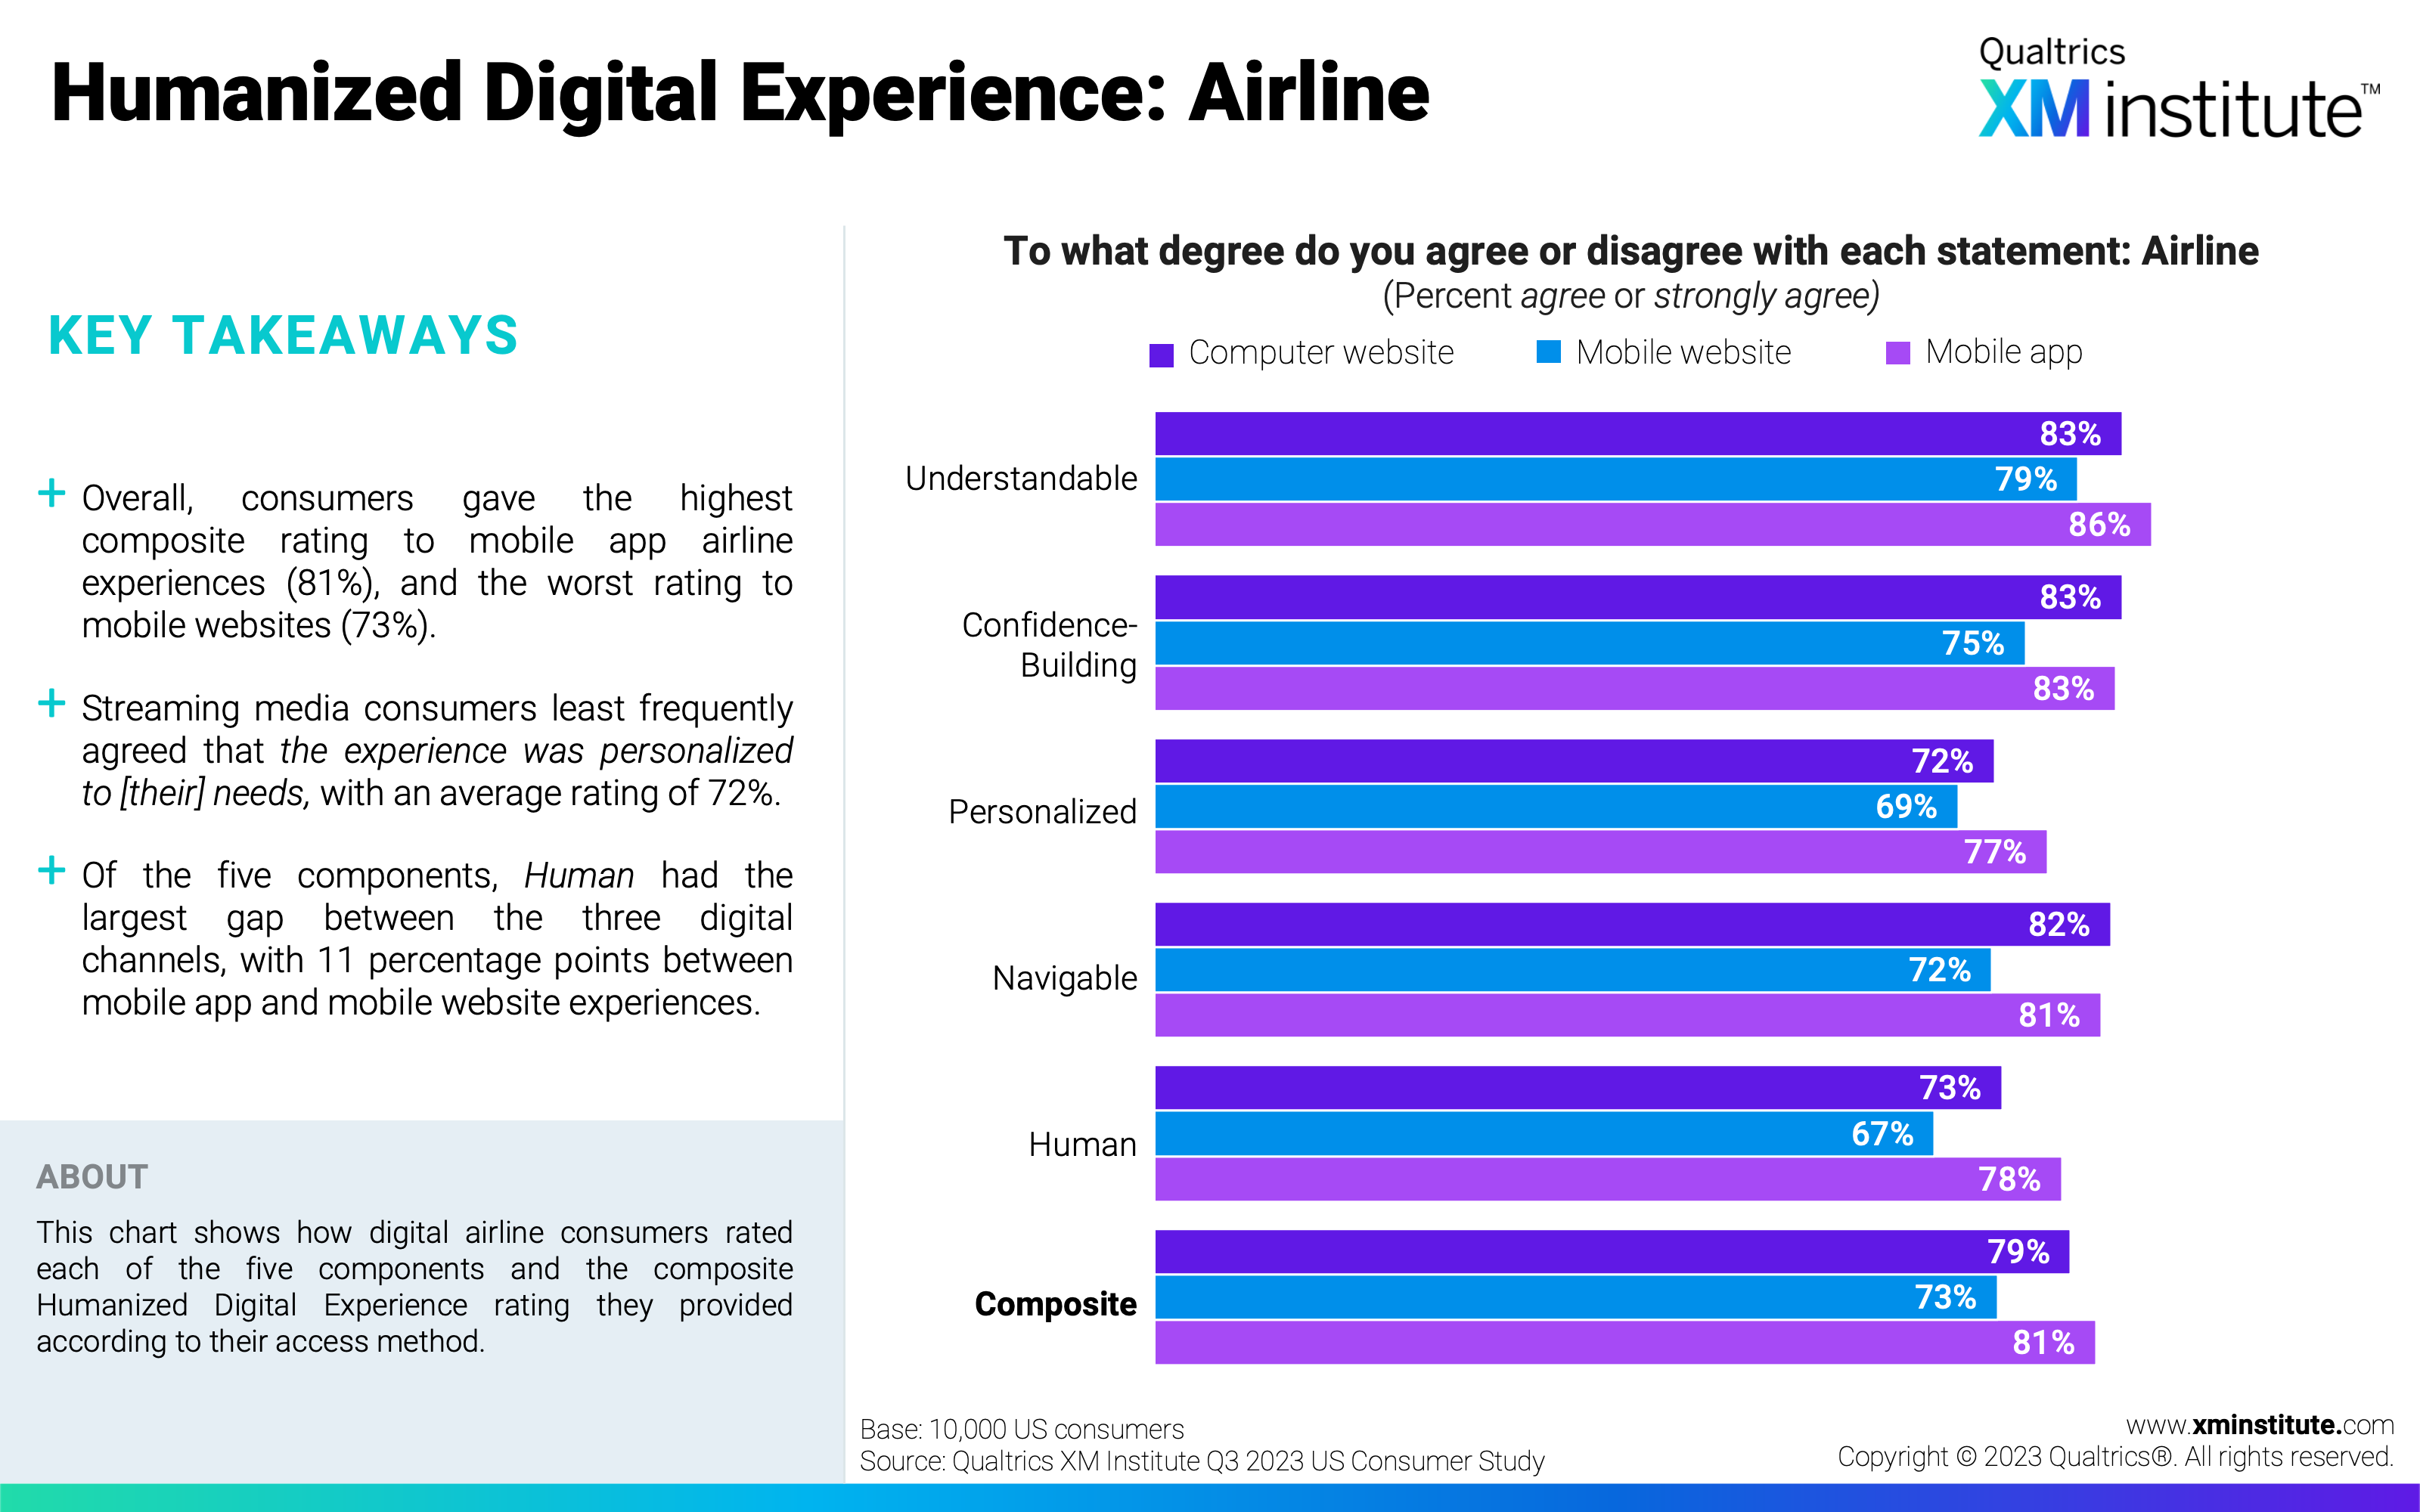
- Humanized Digital Experience: Airline
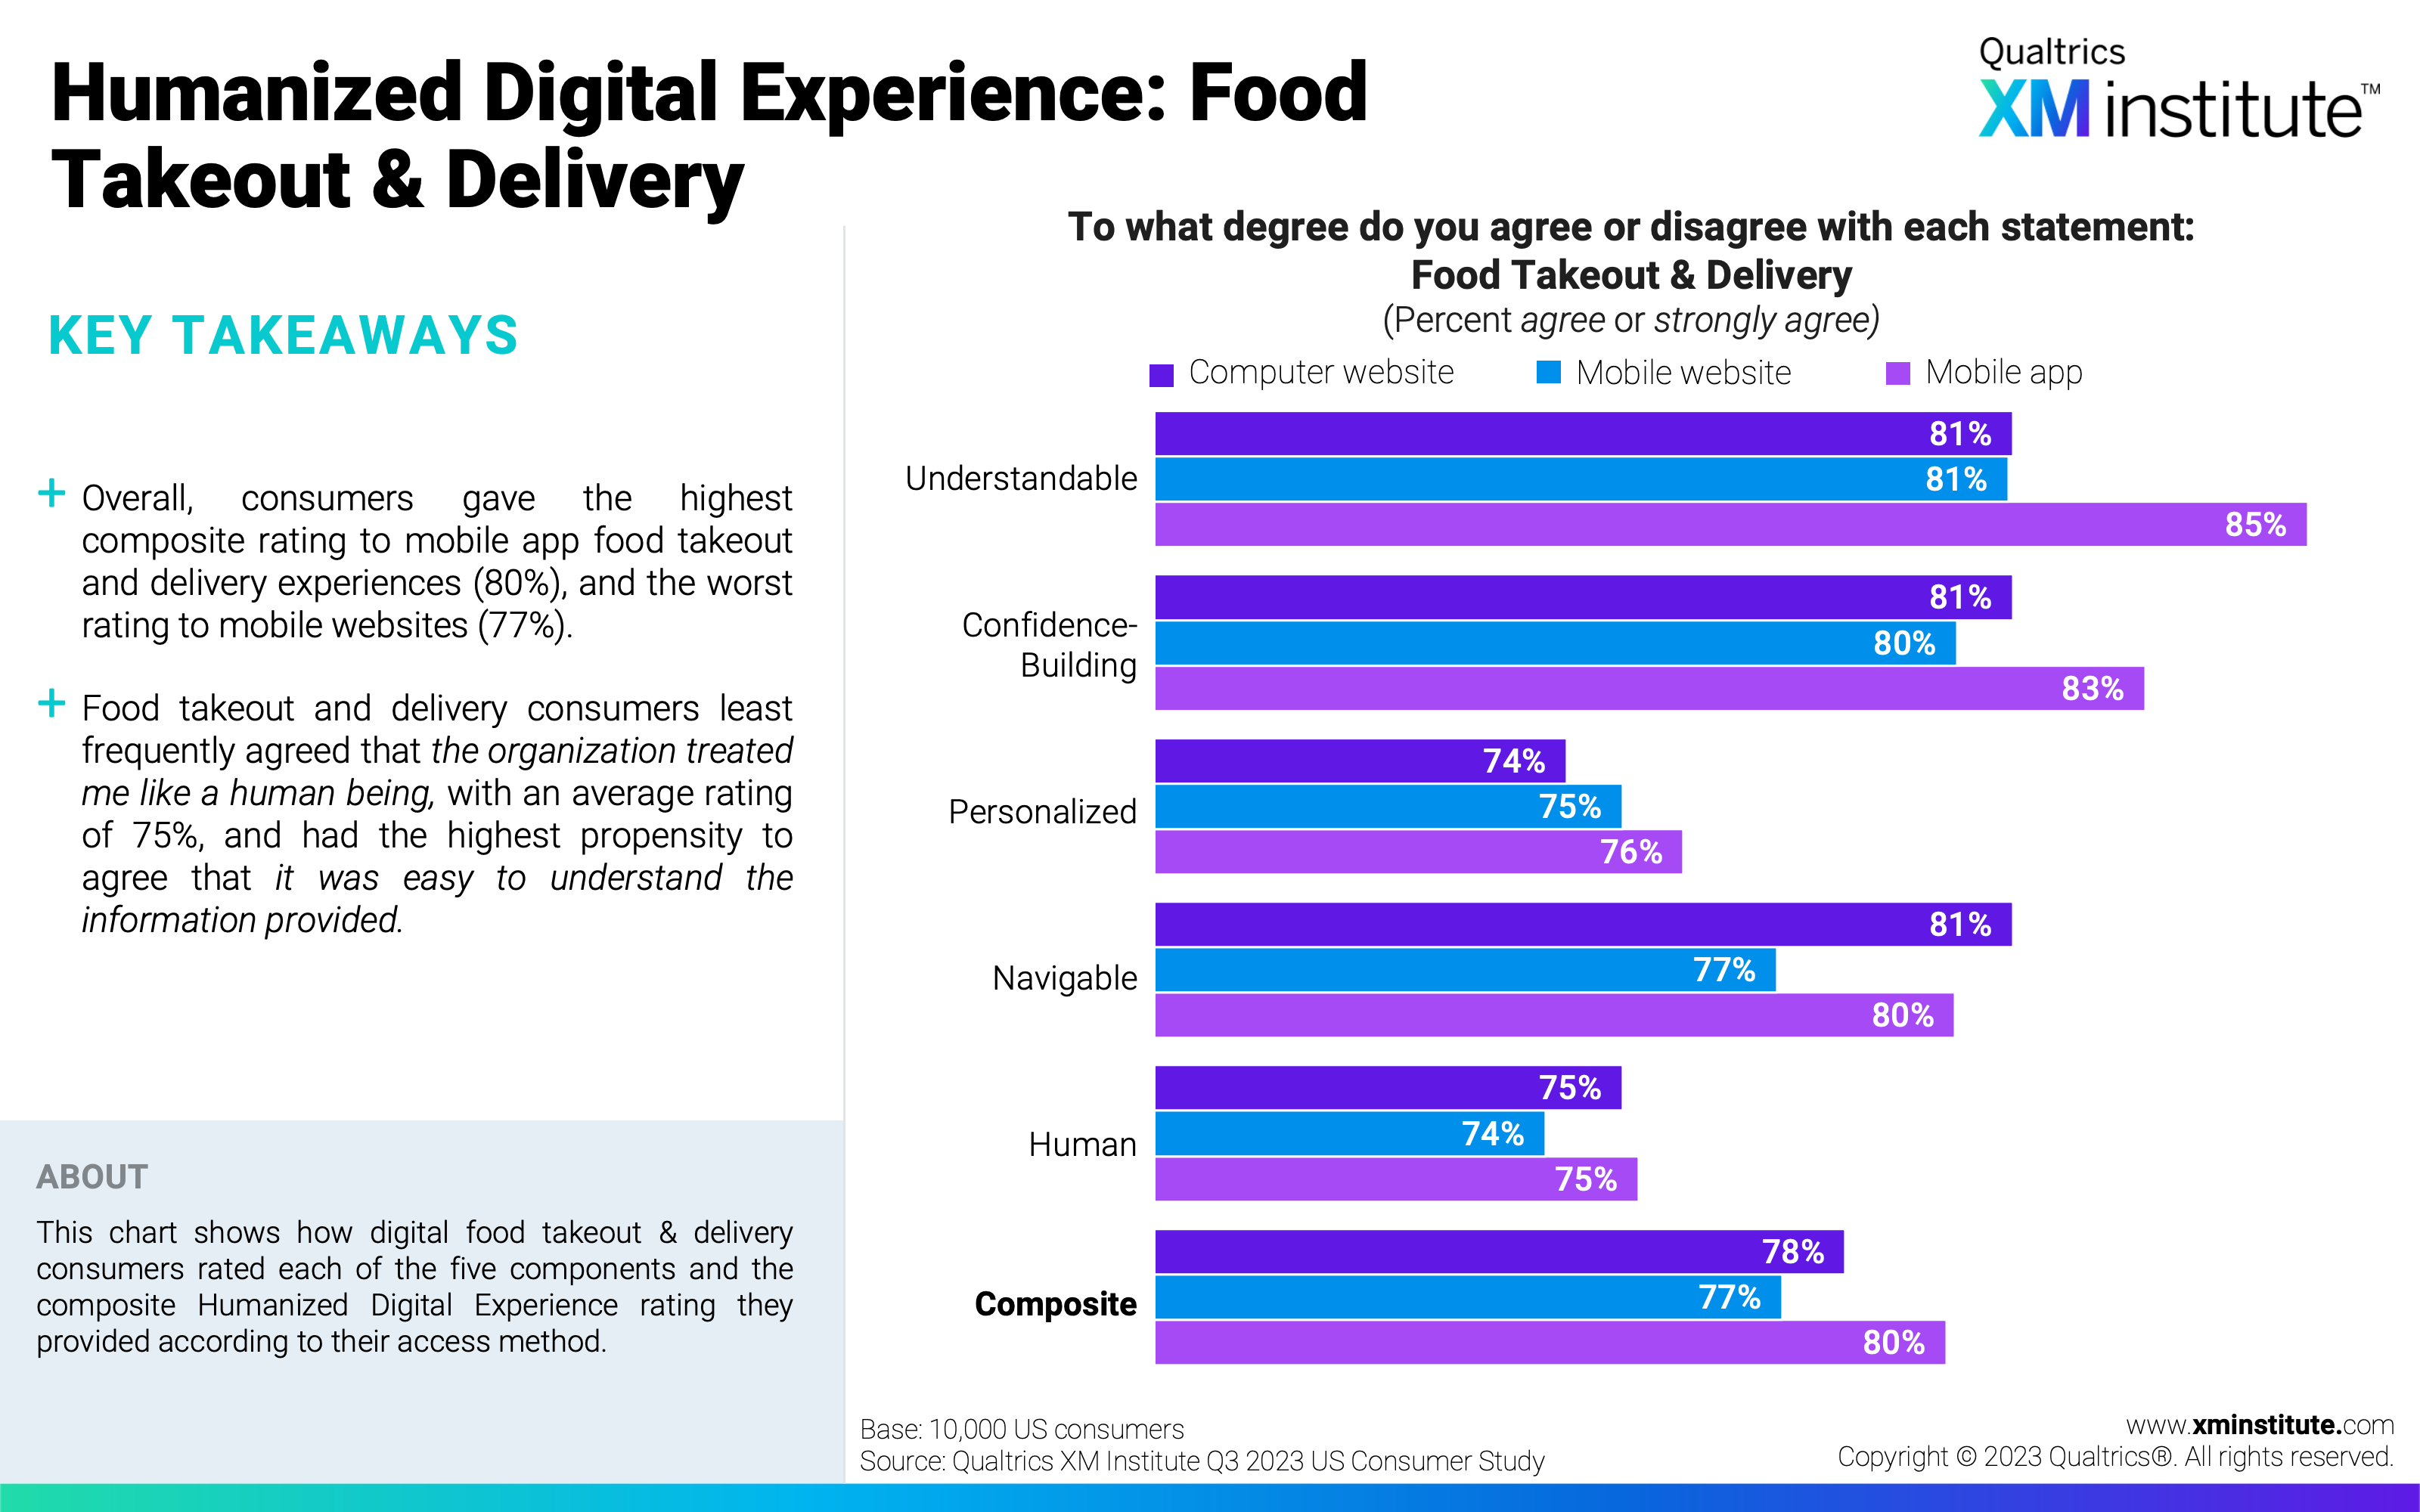
- Humanized Digital Experience: Food Takeout & Delivery
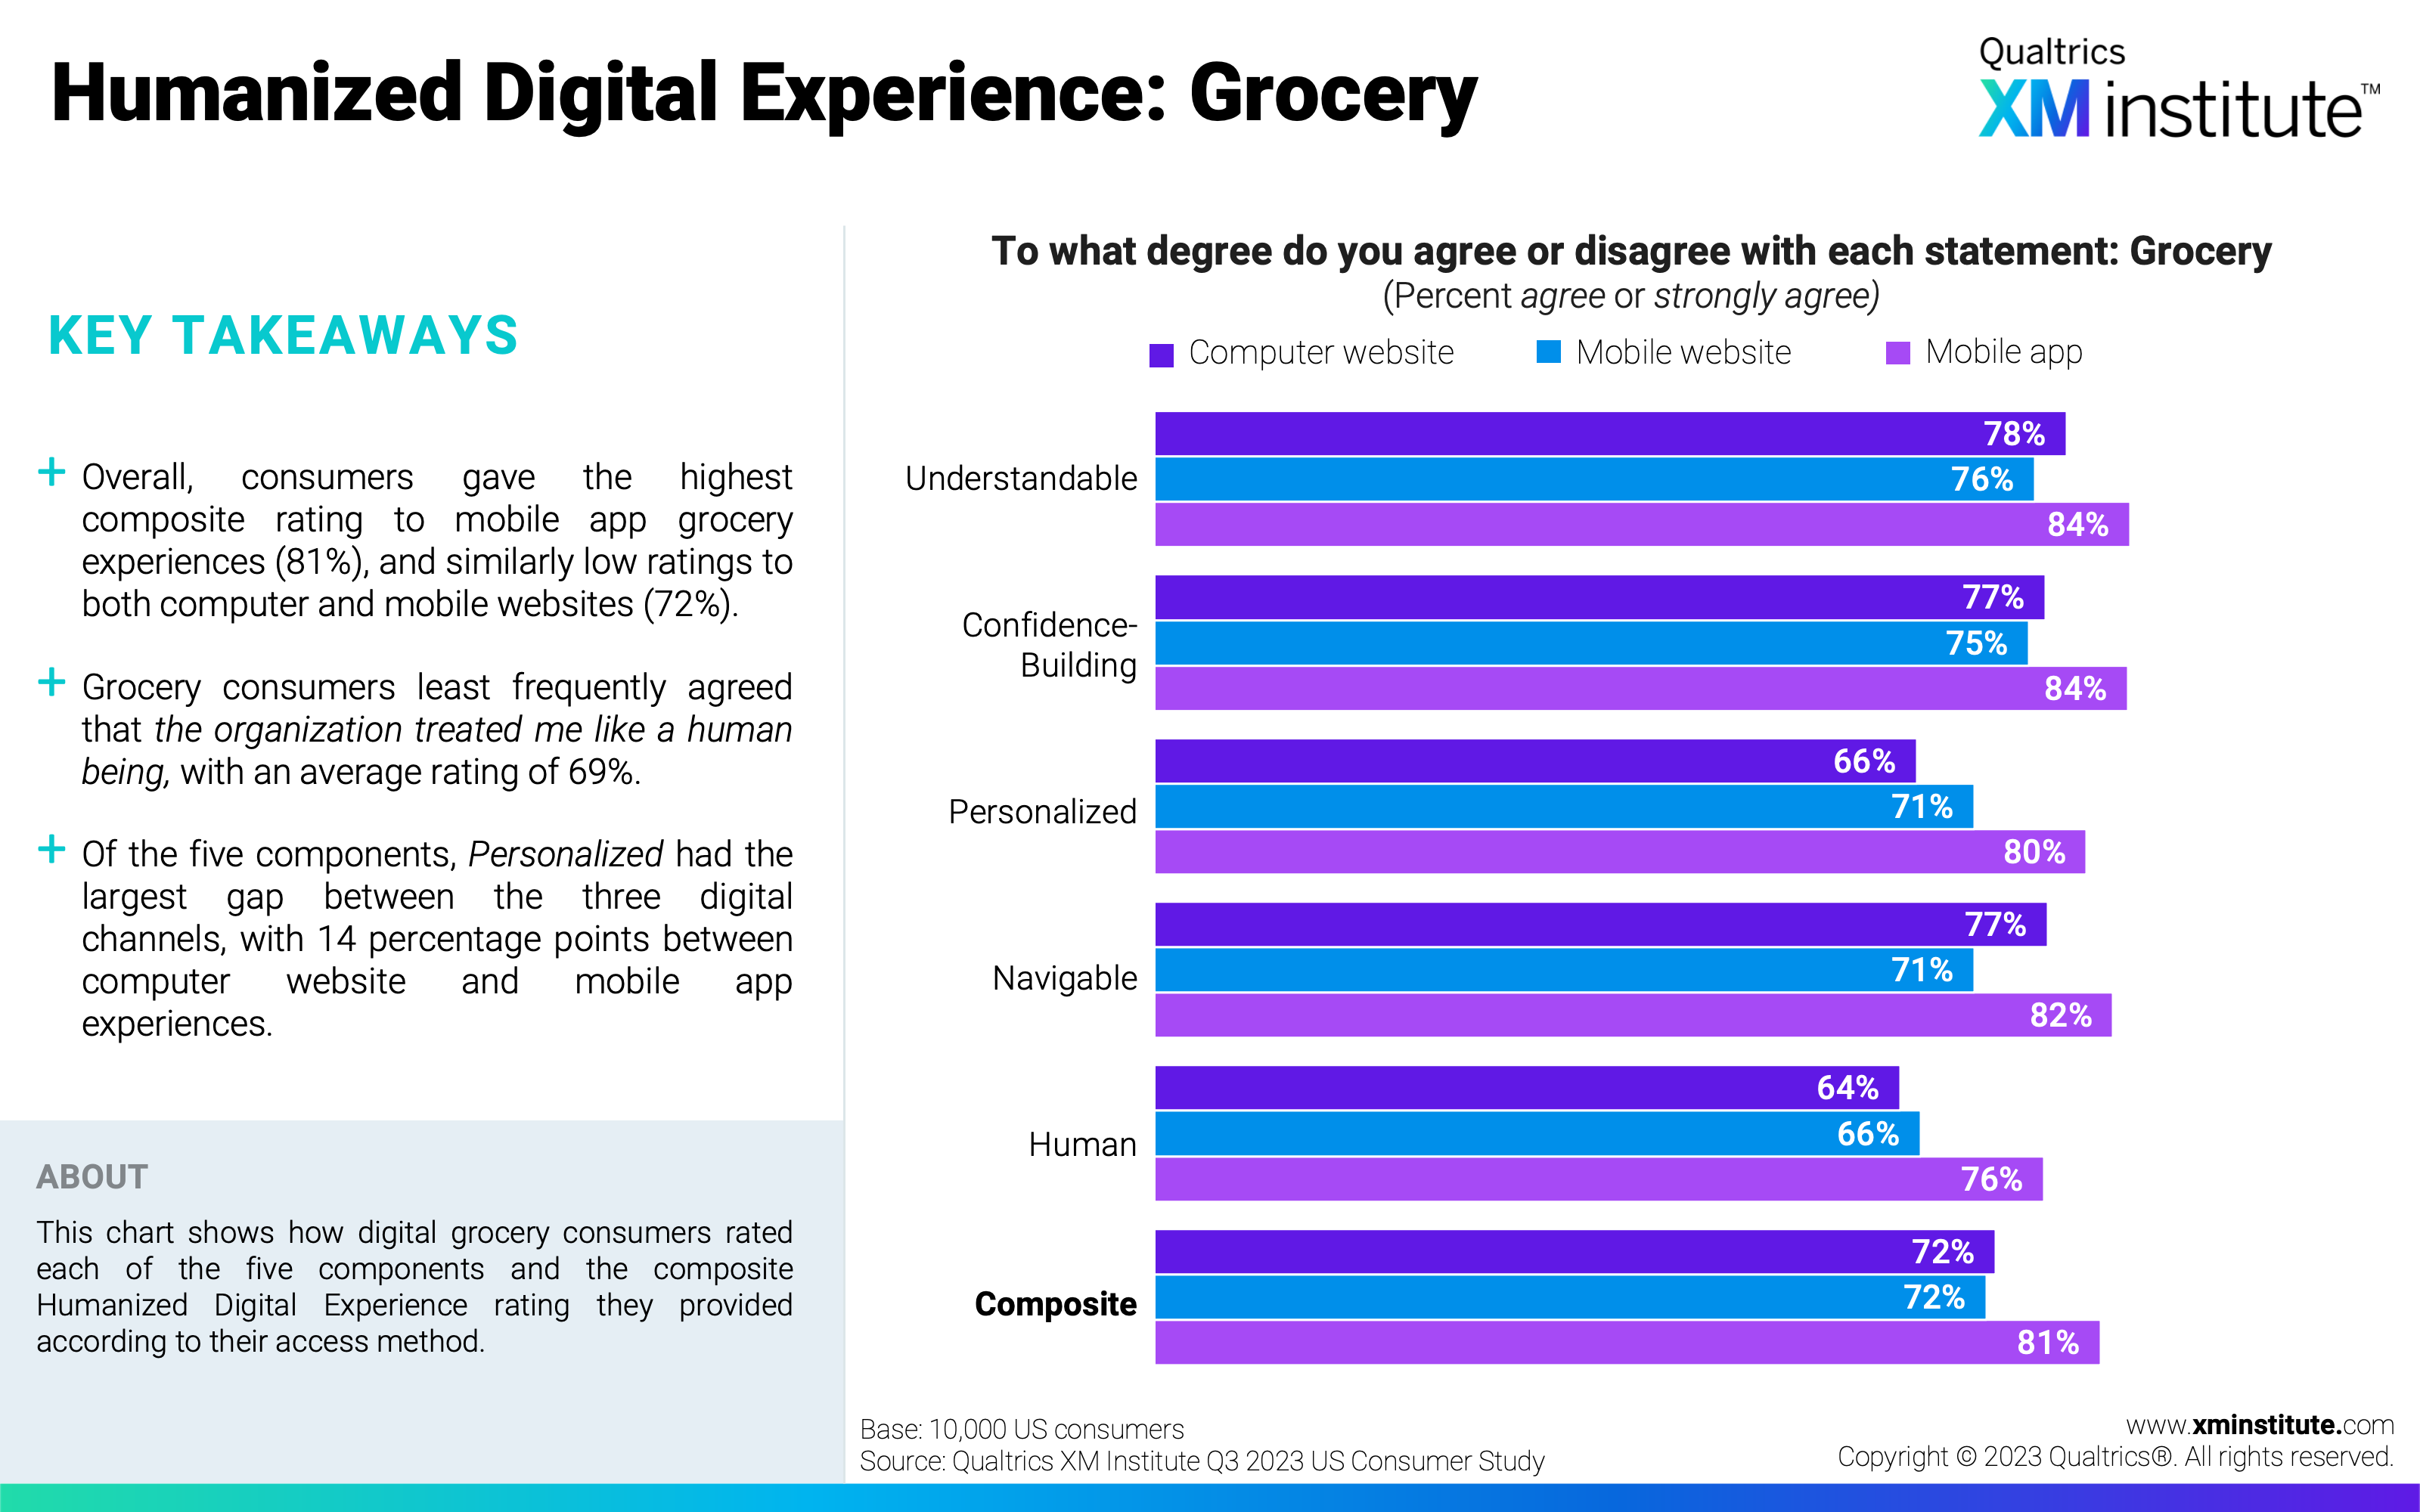
- Humanized Digital Experience: Grocery
- Humanized Digital Experience: Rideshare
- Humanized Digital Experience: Federal Government
- Digital Experience Problem Rates
- Methodology