Every year, as part of our annual US consumer study of 10,000 consumers, we ask respondents to evaluate their recent interactions with hundreds of organizations across 20+ industries across the three dimensions of an experience:
- Success: the degree to which they accomplished their goal
- Effort: the level of difficulty or ease in accomplishing their goal
- Emotion: how the interaction made them feel
We then average these three scores for each organization and industry to generate the XMI Customer Experience Ratings – Overall benchmark. In this blog post, we examine the current state of customers’ experience across these three dimensions and how these ratings have changed over the past few years.1 We also look at their impact on key customer loyalty behaviors, including a customer’s likelihood to trust the organization, recommend it to others, forgive it for a mistake, and purchase more from the business.
Success, Effort, and Emotion in 2023
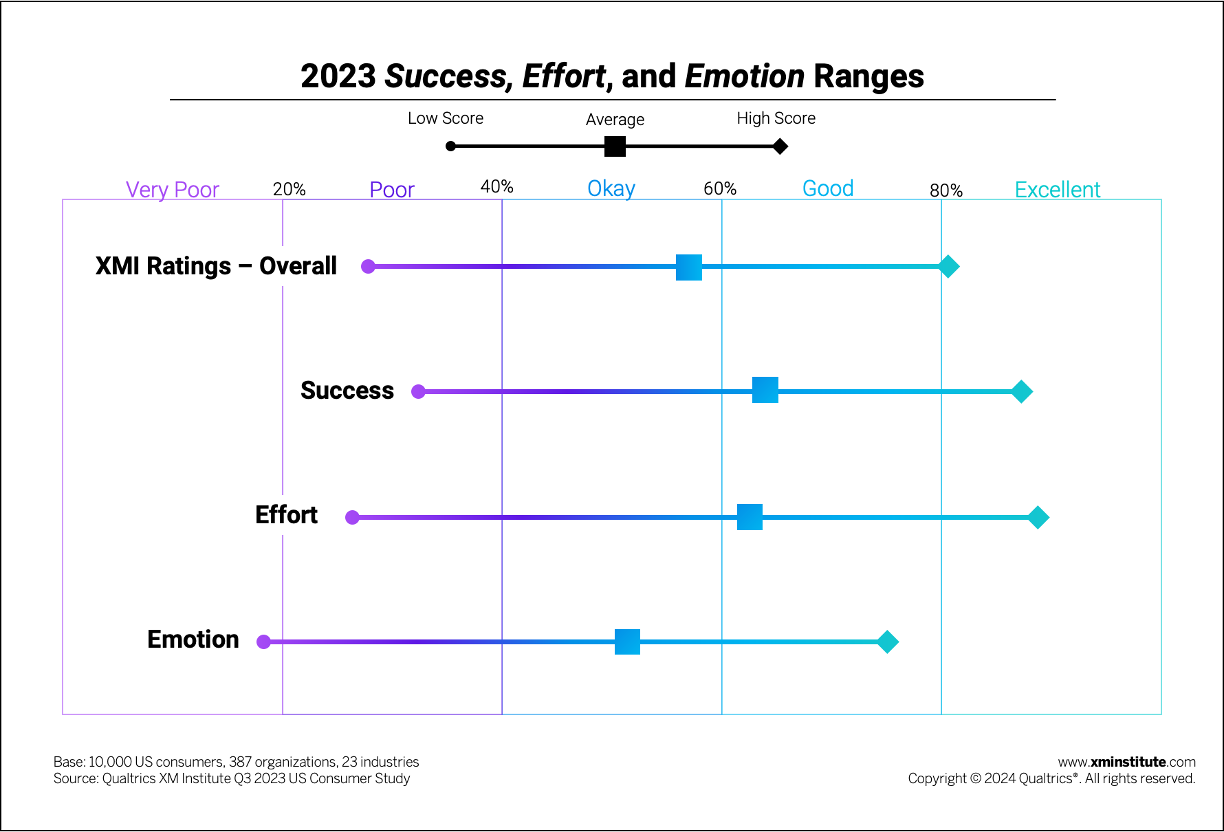
In the XMI Customer Ratings – Overall benchmark, a score of 60% or above is considered good, and a score of 80% or above is considered excellent. In this year’s study, 50% earned a good or excellent overall score, while 4% received a poor or very poor score. The percentage of organizations with at least a good rating has fallen from 74% in 2019, a drop of 24 points.
In this year’s benchmark, we learned that:
- Organizations typically provide an okay customer experience. On average across all organizations and industries, consumers provided an XMI Customer Ratings – Overall score of 58%, which falls into our okay range. Scores ranged from a low of 29% to a best-in-class rating of 81%.
- Success is the strongest component. Of the three components, success earned the highest average rating, at 63%. While individual organizations scored as low as 31% for success, no industries have a poor average score – lower than 40% – for this dimension.
- Emotion is the weakest component. The average emotion score across all 23 industries is 50%, 11 points below the average success rating and 8 points below the average effort rating. Consumers even gave emotion ratings as low as 17%, a very poor score, and no organizations achieved an excellent emotion rating (80% or more).
- Effort has the broadest range. Organizations’ effort scores span the largest range, with individual organizations achieving a maximum rating of 87% and a minimum rating of 25%, for a total gap of 62 percentage points. On average, consumers provided an effort rating of 61%, a good score. Leaders in this dimension will be setting customer expectations around what constitutes an “easy” experience – even across industries – so organizations with lower effort scores should consider this aspect of customer experience.
Success, Effort, and Emotion Over 5 Years
We’ve been measuring success, effort, and emotion for over a decade, so we’re able to compare their performance both pre- and post-pandemic. Since recovering from their early-pandemic dive, these three CX dimensions have begun to stabilize.2
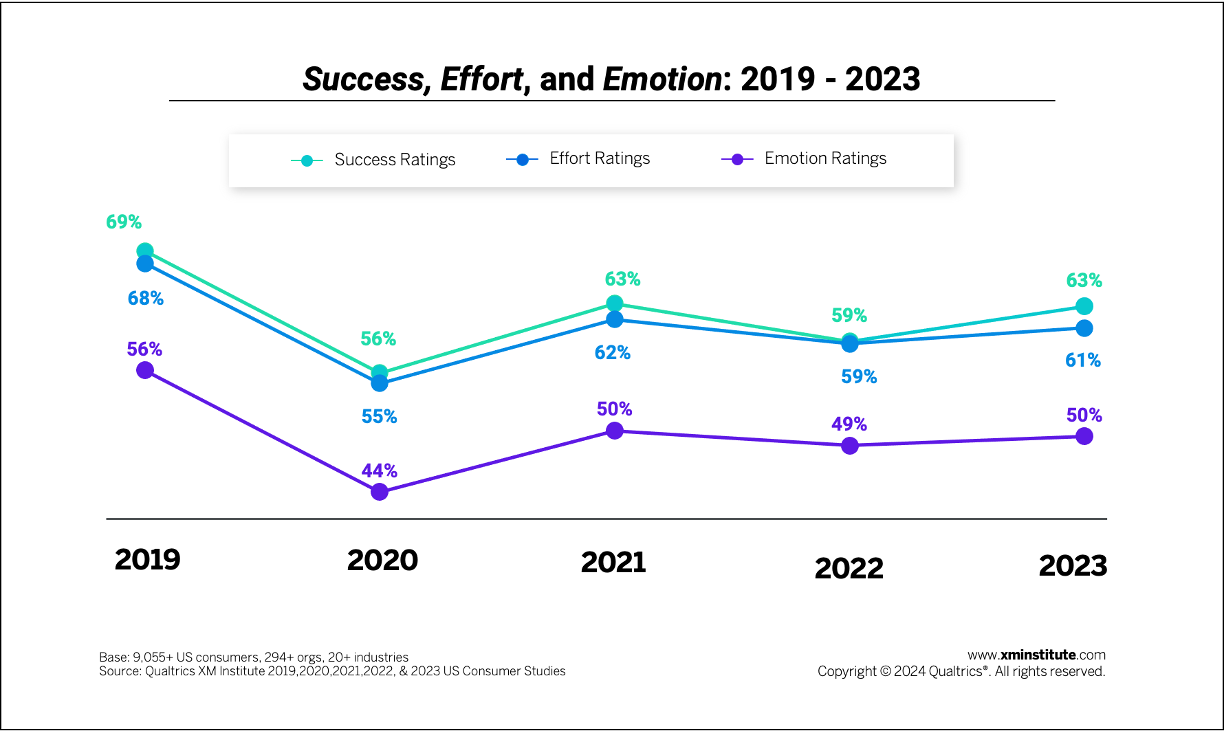
- Success, effort, and emotion ratings remain below their pre-pandemic levels. Compared to 2019, industries’ average effort rating is 7 points lower, while the average success and emotion ratings are each 6 points below their 2019 scores.
- The largest change in ratings occurred (surprise, surprise) between 2019 and 2020. From 2019 to 2020, the 20-industry average success and effort scores each dropped by 13 points, while the average emotion score fell by 12 points.
- Emotion consistently lags behind. Emotion has been the lowest-scoring component since 2019, each year scoring 10 or more percentage -points below both success and effort. Success is the top-scoring component over time, beating out effort each year except in 2022, when the two components earned the same average rating of 59%.
Grocery Brands Earn the Highest CX Ratings
In addition to examining overall trends, we also looked at the success, effort, and emotion scores for each of the 23 industries included in the 2023 study and compared their performance to their 2019 scores.
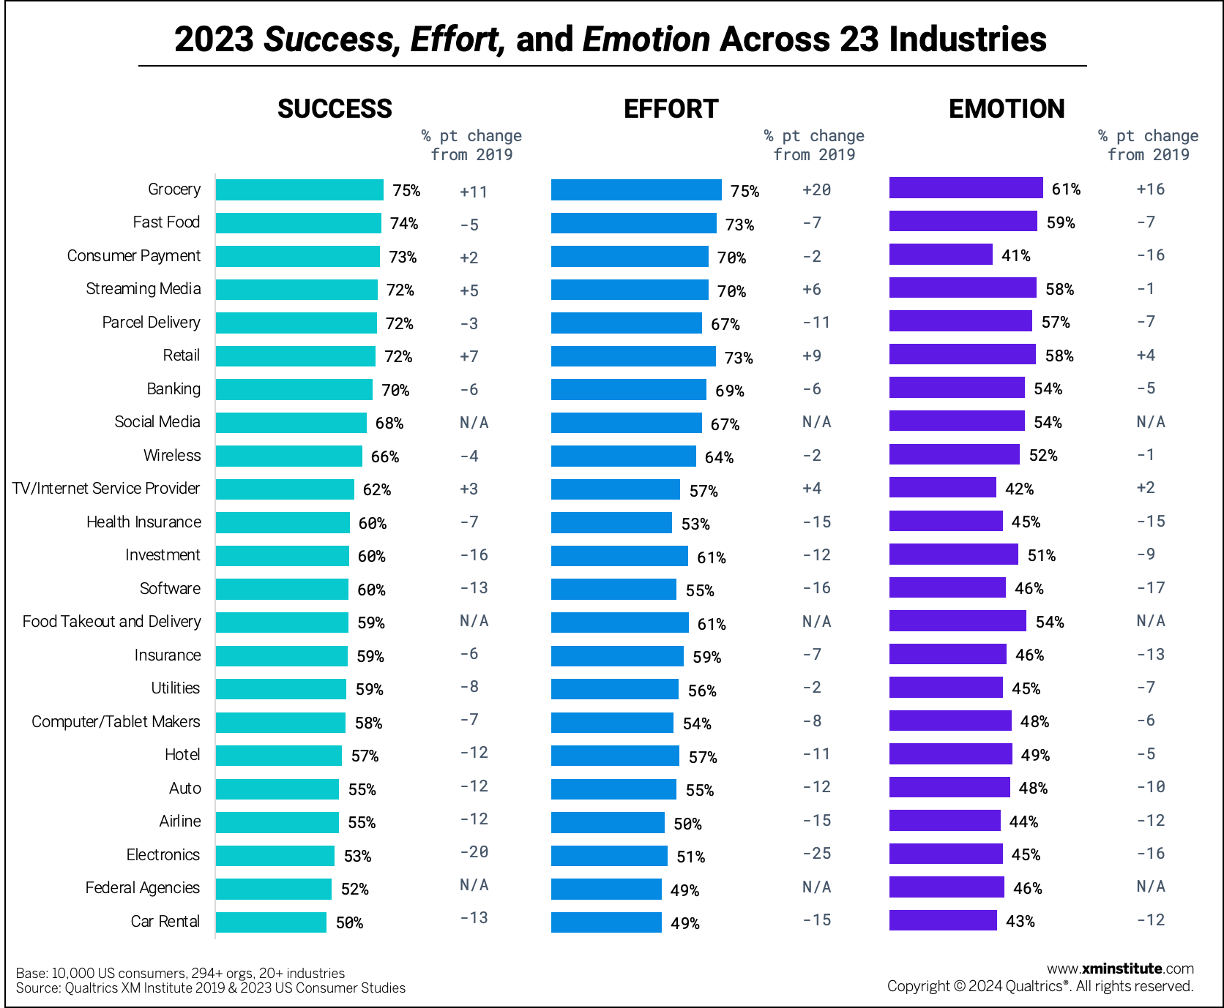
- Grocers earn top scores for success, effort, and emotion. On average across 23 industries, consumers reported having the greatest success (75%), the easiest time (75%), and the most delightful experiences (61%) with grocery brands. Grocers’ success, effort, and emotion scores also improved the most of any industry between 2019 and 2023. Their average effort score rose by 20 points over the past five years, the sharpest increase across any dimension or industry. In fact, just two other industries earned higher scores for all components in 2023 than in 2019: retailers and TV/internet service providers.
- Car rentals and federal agencies fall to the bottom. Consumers gave the lowest success scores to car rentals (50%) and federal agencies (52%). These two industries also received the lowest effort ratings, each averaging a score of 49%. The consumer payment (41%) and TV/ISP (42%) industries earned this dubious honor for the emotion dimension.
- The electronics industry’s scores fell the most over the past 5 years. Between 2019 and 2023, electronics brands saw their average success rating drop by 20 points, their average effort rating decline by 25 points, and their average emotion rating fall by 16 points. Cumulatively, the industry saw its XMI Customer Rating – Overall score decline by 29%.
- Software providers fall behind on emotion. The software industry is not able to delight consumers like it once was. The average emotion score for the industry fell from 63% in 2019 to just 46% in 2023, a difference of 17 points and the greatest change in emotion ratings across 20 industries. The consumer payment industry experienced a similar decline, with its emotion rating dropping 16 points to 41% – the lowest average in the benchmark and barely an okay score.
Why Care About Success, Effort, and Emotion?
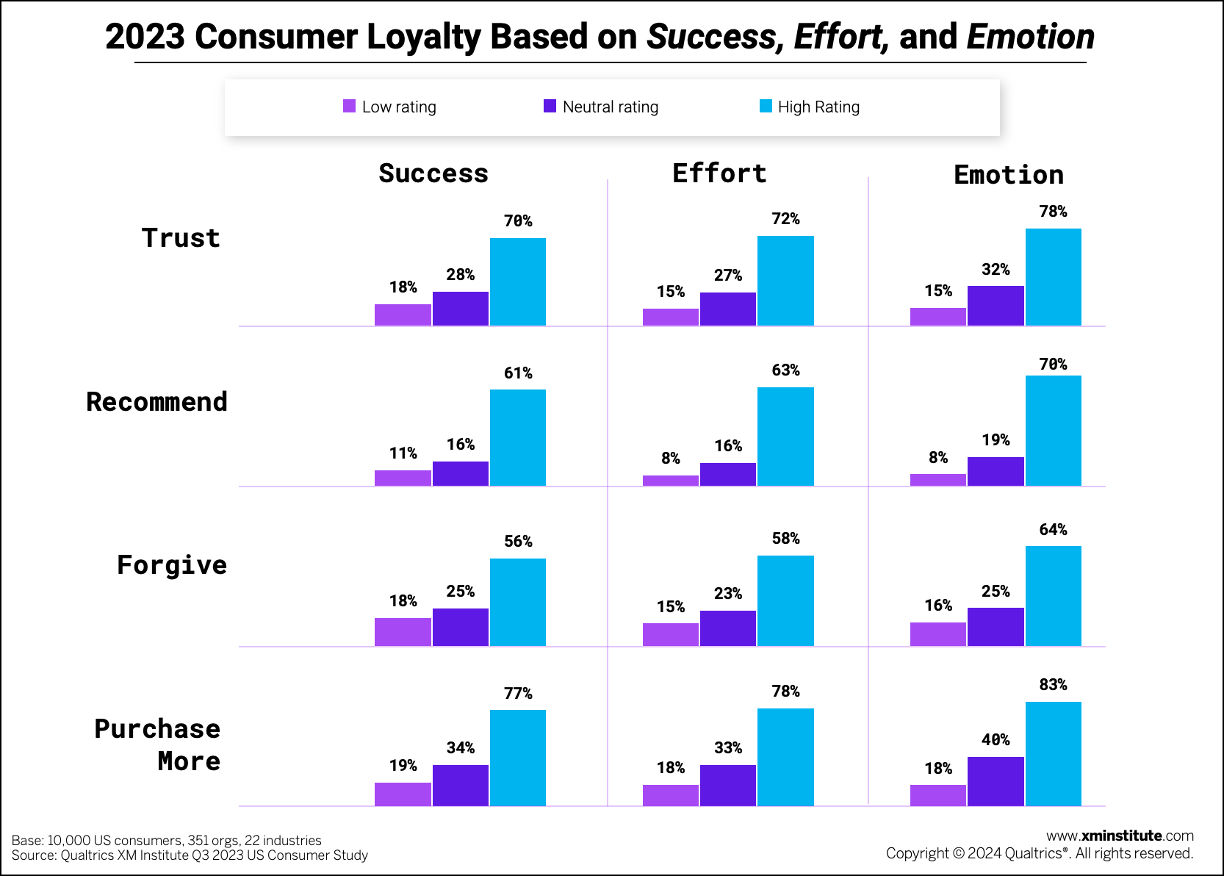
As part of this study, we also ask consumers how likely they are to exhibit the following loyalty behaviors towards the organizations they have recently interacted with: degree of trust in the company, likelihood to recommend the company to others, likelihood to forgive the company for a mistake, and likelihood to purchase more in the future. Our analysis shows that when consumers rate a brand highly across success, effort, or emotion, they are also significantly more likely to demonstrate each of these loyalty behaviors. For more information on how these three dimensions affect loyalty across 350+ brands and 22 industries, check out our research report How Success, Effort, and Emotion Affect Customer Loyalty, 2024.
Here are some highlights from this report on how success, effort, and emotion relate to loyalty:
- Emotion has the highest impact on loyalty. Consumers with a high emotion rating are the most likely to exhibit each of the four loyalty behaviors — trust, recommend, forgive, and purchase more – compared to those with a high success or effort rating. Compared to consumers who gave a low emotion rating, those who gave a high rating are 5.1x more likely to trust an organization, 8.8x more likely to recommend the organization, 6.7x more likely to forgive it for a mistake, and 4.6x more likely to purchase more. While all these numbers are all higher than their success and effort counterparts, high emotion ratings are most strongly related to consumer repurchasing behaviors.
- Success and effort also positively affect consumer behavior. While high success and effort ratings are linked to a high likelihood of performing all four loyalty behaviors, these scores both have the strongest relationship with a customer’s likelihood of purchasing more from the organization. Seventy-eight percent of consumers who give a high effort rating say they are likely to repurchase, compared to just 18% of those with a low effort rating. For success, these numbers stand at 77% and 19%, respectively.
The bottom line: While all three components are important, organizations need to invest in improving the emotion dimension of their experiences.
Isabelle Zdatny, XMP, CCXP, is Head of Thought Leadership with XM Institute.
Talia Quaadgras is a Research Program Manager with XM Institute.
- Consumers evaluated the success, effort, and emotion dimensions of their experience with brands they’d recently interacted with on a 7-point scale. We generated each component rating for a brand by subtracting the percentage of 1, 2, and 3 scores from the percentage of 6 and 7 scores. We then calculated an industry average across all brands included in the study for each industry. Only brands with 100+ responses are included in this analysis.
- Only the 20 industries for which we gathered data in both 2019 and 2023 are included in the 2019 v. 2023 analysis. Federal agencies, social media, and food takeout and delivery were not included in this analysis.


