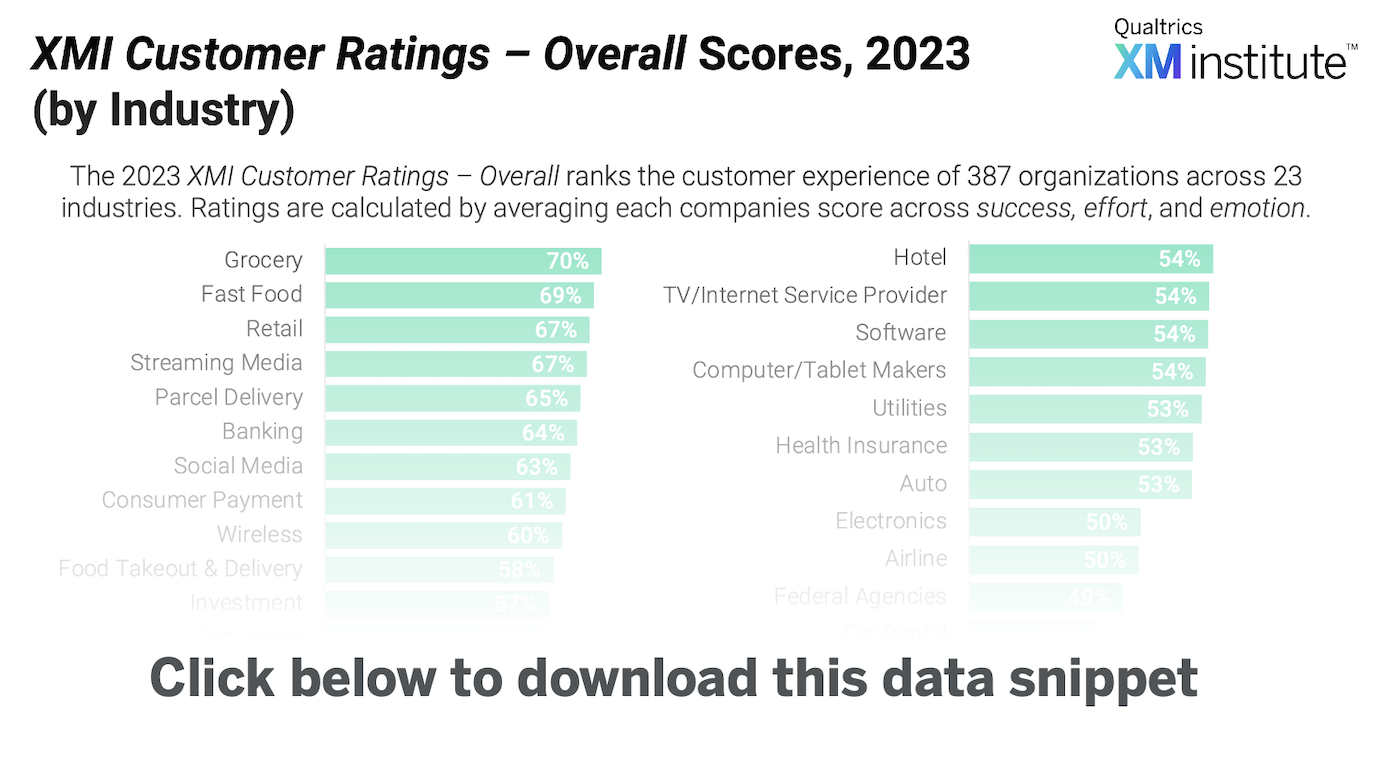
As part of our annual U.S. consumer benchmark study, we asked respondents to evaluate their recent experiences with organizations across 23 industries.These questions – rated on a seven-point scale – covered the three components of an experience: success (were they able to accomplish their goals?), effort (how easy or difficult was it for them to accomplish their goals?), and emotion (how did the interaction make them feel?).
To produce the XMI Customer Ratings – Overall scores for each of the organizations included in these studies, we average the scores of these three experience elements. Industry scores are an average of those company scores.
We found that the grocery industry received the highest XMI Customer Rating – Overall scores, at an industry average of 70%, while the car rental industry received the lowest scores, with an industry average of just 47%. Use these insights to understand where your organization’s customer experience ranks both within your industry and across consumer-facing industries.
This U.S. consumer benchmark study surveyed 10,000 consumers across 387 companies and 23 industries on success, effort, and emotion. To see how industries’ performance in 2023 compares to their scores in 2022, check out last year’s version of the data snippet: XMI Customer Ratings – Overall Scores, 2022 (by Industry). If you are a Qualtrics CX client and interested in methodology, additional benchmark metrics, or a list of companies included in this research, you can access the benchmark editor through Qualtrics.
To use this Data Snippet, download and include it in presentations. The graphic is free to use but must retain the copyright notice.


