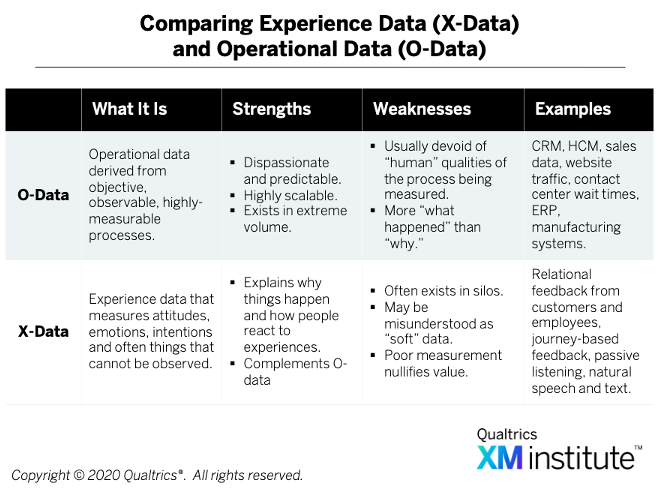
I’ve worked with many organizations that are starting to blend together their experience data (X-data) and operational data (O-data). This is a key component of Experience Management (XM) programs, which are fueled by a continuous flow of both X-data and O-data pulsating through its decision ecosystem.
X-data and O-data on their own are useful. For example, sales and channel volume are critical data to monitor, as are customer loyalty metrics such as repurchase intention and overall satisfaction. But X-data plus O-data in the right combination is powerful. It enables an organization to see what customers and employees are doing, what they are thinking, what they want, what the competition is doing, and what disruptions are possible from a myriad of strategic viewpoints.
Achieving the Right X-Data and O-Data Mix
Almost all large companies have robust O-data systems; it’s how they run their business. With the rise of XM efforts, an increasing number of organizations are also starting to build up their stores of X-data. With all of these systems generating data, the chances are that your problem isn’t “not enough data,” but rather “how do I contextualize and use these data?”
One of the first key steps is identifying the right X- and O-data. To know which data to use and which to sideline, I recommend using both data-driven and business acumen-driven approaches.
Data-Driven Approach For Selecting The Right O-Data
An analytics approach to this challenge prevents cognitive biases from creeping into the insights we generate. Here are some steps to follow:
- Identify and control high-impact O-data variables. Improve experiences by focusing on O-data which explain meaningful outcomes. The easiest way to do this is to include what is statistically significant in a driver analysis in your data ecosystem. Simple things like the number of restrooms, whether you serve sandwiches in your store, the economic level of the area, can all have a material impact on customer and employee experiences that we typically explain with X-data variables (e.g. service quality, friendliness, cleanliness, etc). Use analytics to control for these so that you can recalibrate your understanding of what constitutes and drives “good experiences.”
- Carry only the data that you need. Data creates gravity: the more you have around you, the more it sucks you in. We want to carry the volume of data that arms us with knowledge and insights but doesn’t weigh us down. Ensure your data are orthogonal, that is, where each datum tells you something new or unique. For example, there is a surprising redundancy in our data ecosystems; we don’t need 4 KPIs when 1 or 2 will do, and we don’t need hourly sales data when monthly will do. Ensure your data are statistically independent to ensure you’ve got a light, nimble mixture in your data.
- Normalize for volume. By volume, the number of O-data variables is vastly larger than X-data, and in some cases could exceed a ratio of 100:1. If we analyze outcomes with both types mixed in, almost all drivers will be O-data based due to their overabundance. To combat this, do two things: 1) limit the O-data volume by attaching it only to existing X-data records, and 2) ensure both X-data and O-data systems are representative in all analyses.
Choosing the Right O-data with Business Acumen
Don’t discount what people across your organization already know. Talk to the people who understand the specific use cases and keep in mind:
- Proximity is powerful. Include O-data elements which are naturally adjacent to your X-data. For example, when measuring customer experiences, you could include store-level sales, footfall, number of SKUs, etc. When measuring employee experiences, variables such as staffing levels, turnover data, team size, absenteeism, etc. make sense. These variables represent the vocabulary of the frontline and management, helping everyone to understand X-data better.
- Vox populi, vox dei. Sometimes you have to just give the people what they want! (In case you didn’t know, the bold is Latin for “the voice of the people is the voice of God”). In a workshop setting, execute a prioritization exercise by asking stakeholders what they think should be included alongside your X-data and O-data. Oftentimes these opinions are rooted in deep experience that is easier to express than to explain. Not only does this create valuable consensus, it engages and embeds stakeholders into your efforts.
- Keep your BRAIN aimed at change. Ultimately, our goal should be to improve experiences in order to create economic value. Focusing on change means preserving the firm’s attention for change, too. When weighing whether or not to include certain facets of O-data, ask yourself: What are the Benefits of including this data? What are the Risks of including this data? What are the Alternatives to this data? What does Intuition say about these data? What happens if these data are Not included? When you hit the last mile of your data refinement, this can be a useful acronym.
After you’ve built the right data ecosystem, be sure to review it periodically with a critical eye and make changes where needed. A rigid and unchanging data ecosystem mixture is as big of a risk – if not bigger – than one which changes too frequently. But with the right data in the right moment, you’re always armed for change!
Luke Williams is an XM Catalyst with the Qualtrics XM Institute.