CX practitioners often ask us to provide a “good” comparative response rate for their surveys. Unfortunately, while this metric can tell you a lot about the health of your program or project, there’s no one-size-fits-all answer to this question. The factors that affect response rates for any particular project are numerous, influential, and unique to that program, making it difficult to compare across companies and industries.
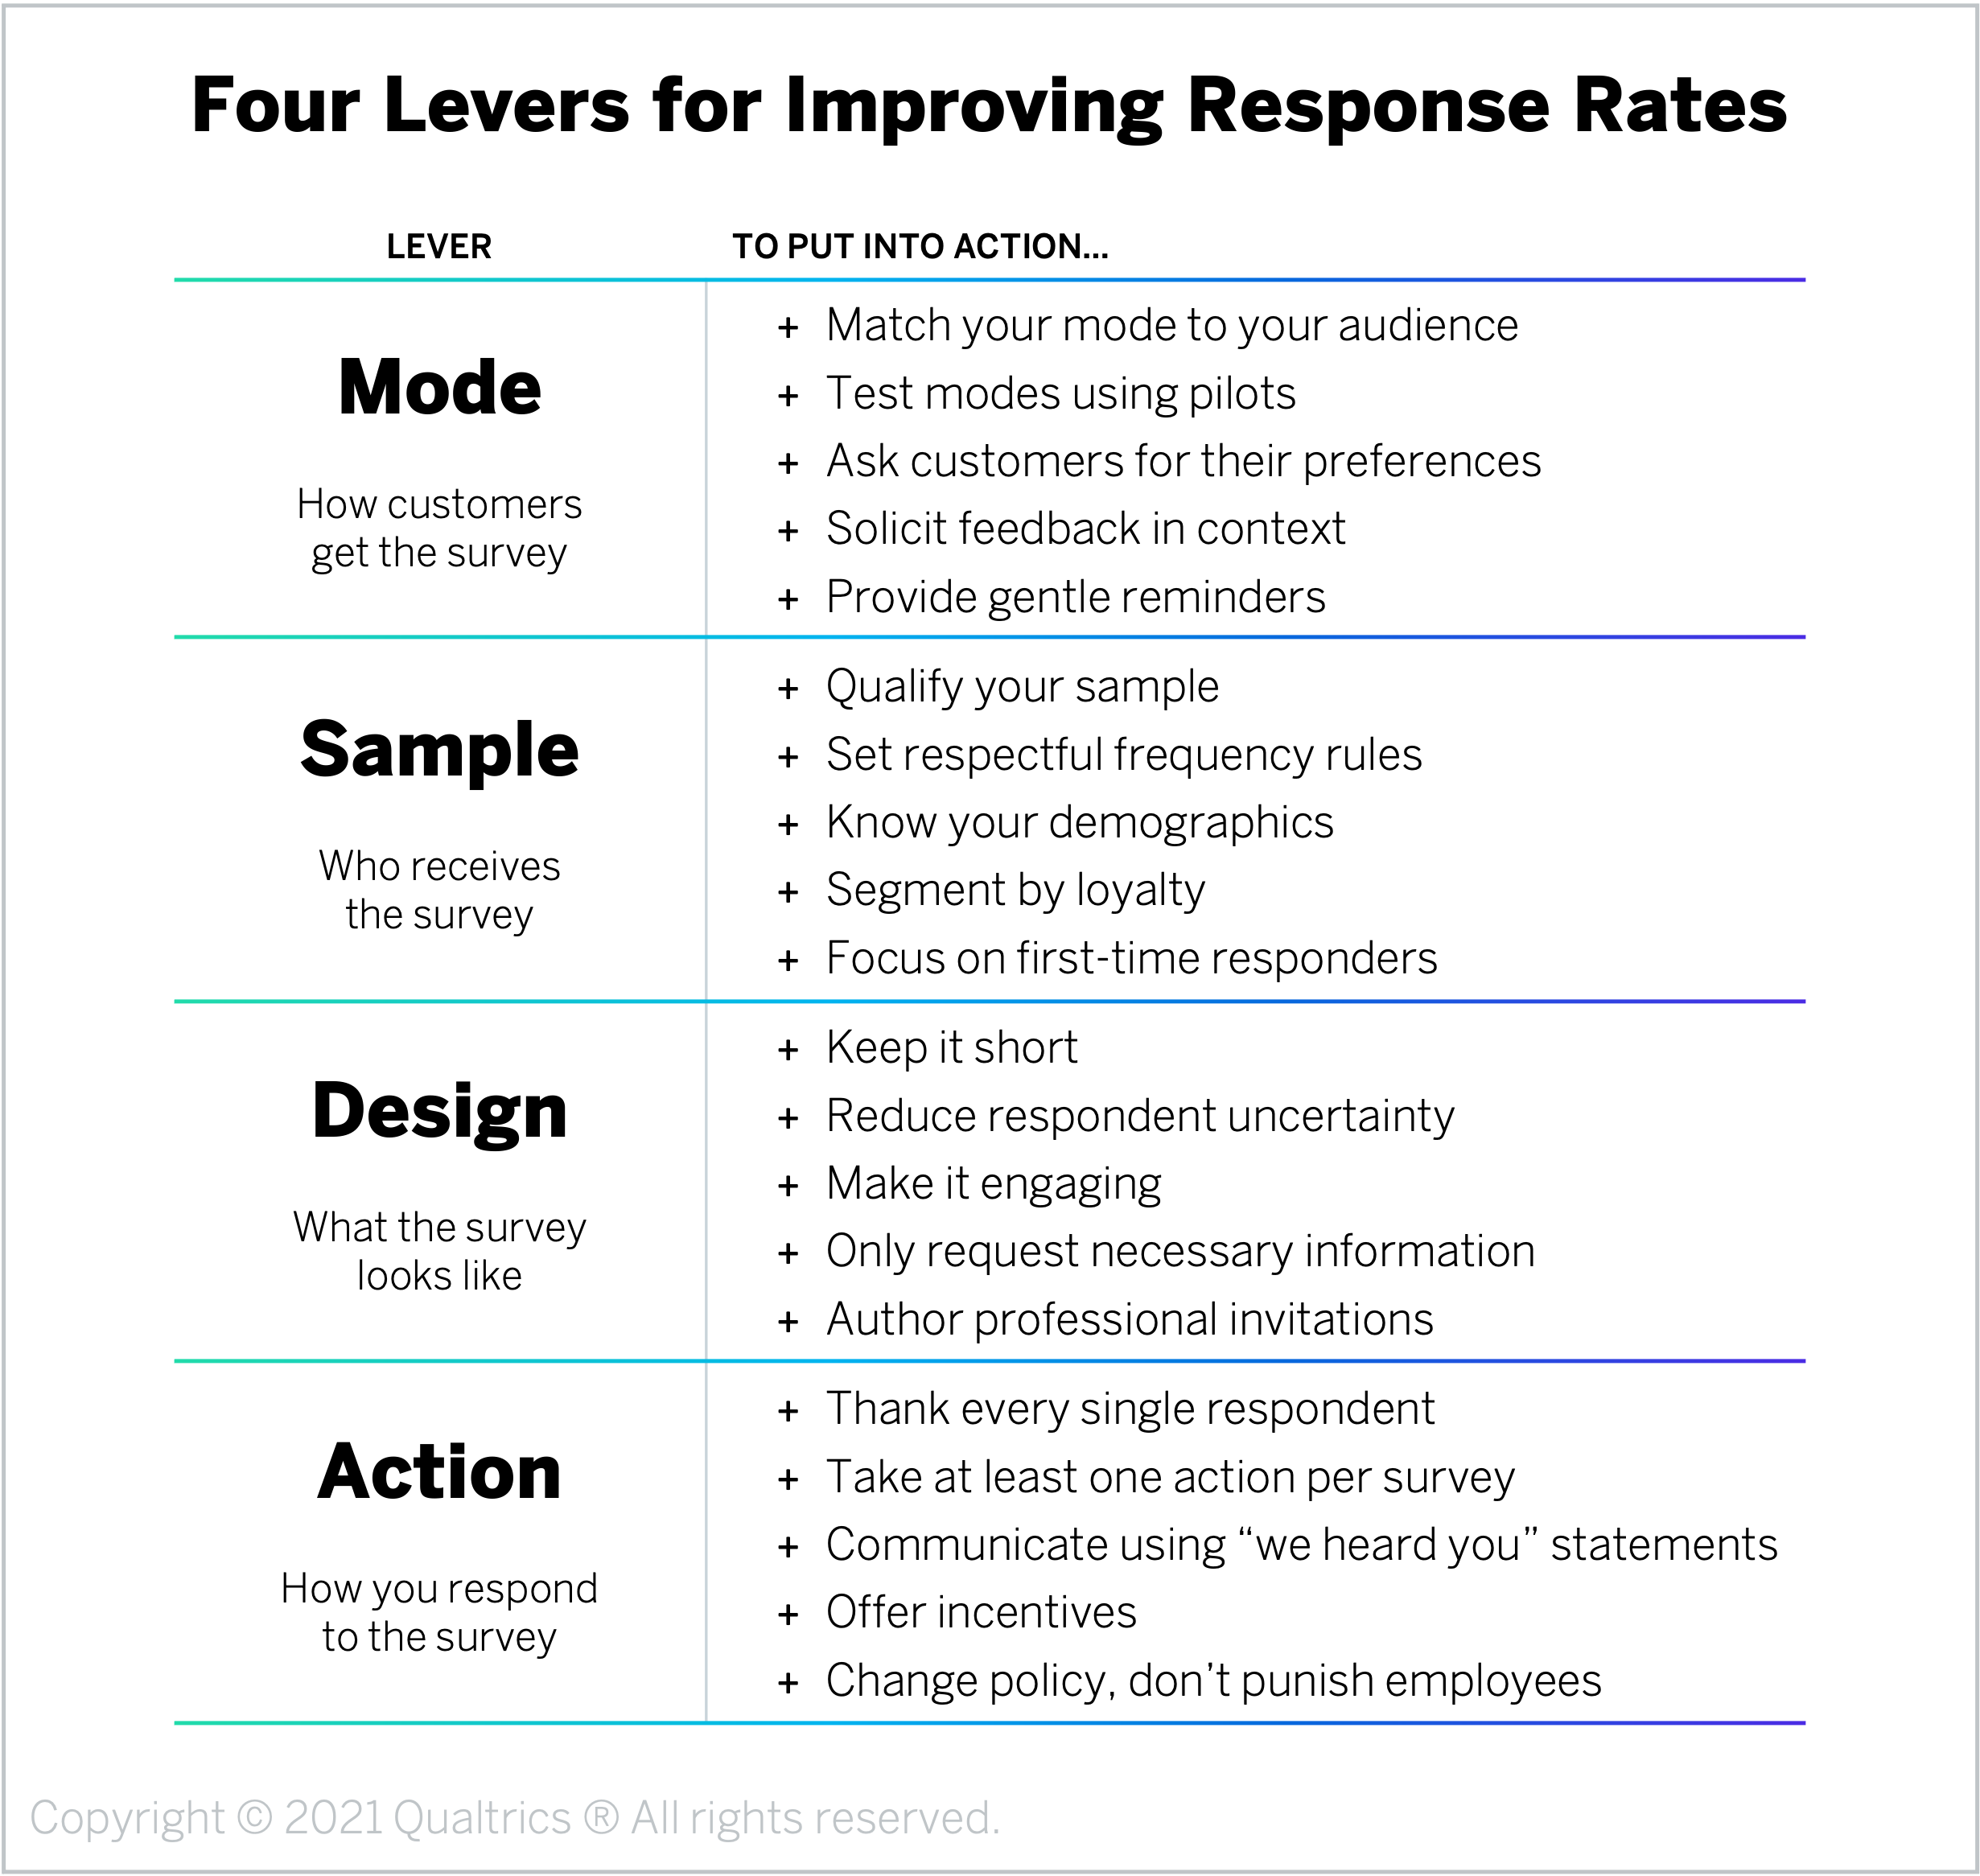
However, while there is no universal answer to what makes a good rate, there are four universal levers organizations can manipulate to boost their project or program’s response rate into a healthy range: mode, sample, design, and action.
Mode: How Customers Get the Survey
As any CX practitioner who has fielded a survey using mixed modes knows – “the media is the message.” Which mode you use to field the survey is going to affect your response rates significantly. Potential distribution modes include Phone, IVR, email, SMS, QR codes, receipts, as well as a number of digital listening posts, such as active intercepts, passive listening, and in-app notifications. Each of these methods will have a different treatment and rate based on the content of the survey and the context in which it is fielded along the journey.
Here are five tips for moving this lever:
- Match your mode to your audience. Different customers will be more or less likely to respond to a questionnaire depending on how they receive it. Field surveys contextually, using timing and channels that meet your target customers where they are. For example, send business customers an email at 7 am on Tuesdays, and use SMS or in-app questionnaires for younger customers. If you have a particularly diverse customer base, you may want to adopt a mixed-method approach to ensure you’re reaching all your different segments.
- Test modes using pilots. To understand which mode produces the highest response rate for your particular company, try fielding your questionnaire using several different modes and analyzing the response rate of each based on demographics or context. Make sure that the make-up of pilot participants reflects your broader customer base or target audience for the survey.
- Ask customers for their preferences. Rather than guessing at which channel customers prefer or using the same distribution method for each person, ask customers to identify their preferred communication channel and send them surveys through that channel whenever possible. This will increase response rates as well as demonstrate your willingness to take action based on their feedback.
- Solicit feedback in context. Field transactional surveys during or as close to the interaction you’re asking about as you can. Whenever possible, embed your request for feedback directly within the flow of the customer’s journey. For example, you could ask customers to stay on the line and answer a few questions following a support call or deploy an active intercept on an order confirmation page to request feedback about the online purchasing journey. This will not only boost response rates, but customer feedback about recent experiences will be more accurate.
- Provide gentle reminders. Send between one and three survey reminders to customers. As most responses will come in within 72 hours, issue your first reminder at the end of that period. We recommend sending your second reminder one week and one day after the initial invitation, as a different day of the week may catch more customers. Ideally, you do not want to keep a survey in the field for more than two weeks. If you reach this deadline with too few responses, you can either push one final reminder and leave it for one more week, or you can close that version of the survey, redesign and shorten it, and field the new streamlined version for a week. We suggest the latter approach.
Company Example: One large online retailer had traditionally conducted its transactional CSAT survey through the telephone, but a few years ago, it started to see a sharp decline in response rates and an increase in the age of customers completing the questionnaire. To improve its rates, the company ran a pilot where it sent the survey to a subset of customers through an SMS two-way mode. This distribution method not only garnered a higher response rate, but upon closer analysis, the retailer also saw that the sample of respondents more closely reflected their target market, which was younger and more willing to engage through text. Ultimately, the company decided to maintain both to ensure a good listening program for both demographic sets.
Sample: Who Receives the Survey
Another factor that will influence your response rates is who you are asking to complete the survey. Your sampling frame will have a considerable influence on your response rates. If you ask customers to provide feedback on topics they’ve had no organic engagement with, they won’t respond or will abandon the survey. If you over-survey loyal customers, you will erode your rate in the group most naturally inclined to respond. To avoid inadvertently training your customers to ignore your questionnaires, take the time to develop a sampling plan that invites customers to participate based on clear qualifications.
Here are five tips for moving this lever:
- Qualify your sample. Customers are not going to respond to surveys inquiring about experiences that are irrelevant to them. So if you send a survey to every customer – even ones who have no frame of reference for the experience you’re asking about – your response rate will inevitably be low. Increase your rates by taking a more targeted approach and inviting only customers whose recent interactions match the goals of the survey.
- Set respectful frequency rules. Avoid survey fatigue by minimizing the number of survey requests you send to any one customer. To ensure loyal customers are not bombarded constantly, embed contact frequency rules into your project or program and offer an “opt-out” option. We recommend not sending any type of feedback request more than once every 30 days.
- Know your demographics. Not all types of customers are equally as likely to complete a survey. Embed demographic characteristics into each data record so that you can analyze your response rates by segment. That way, if you determine that a certain group is not responding to the questionnaire at expected rates, you can tailor the mode, invitation language, or timing to better reach that specific audience.
- Segment by loyalty. In addition to analyzing responses by demographic characteristics, it’s useful to look at who’s completing the survey based on loyalty segments. Loyal customers are inherently more likely to fill out a questionnaire, so if you find low response rates among this group, it bodes differently for your program than if first-time customers decline to participate. For example, it may reflect survey fatigue, a lack of faith that you will act on their feedback, or they might feel like they’ve already shared all their relevant insights. Understanding the mix of customers who are responding can help you make targeted adjustments to boost your rates.
- Focus on first-time responders. Pay special attention to your newly acquired customers. Not only are they potentially more motivated to complete a survey to see what the inquiry yields, but a good initial survey-taking experience will encourage them to complete more questionnaires in the future. Be sure that they see clear benefits to their decision to respond, that the questions are easy, and they know what to expect in the future. We also recommend comparing response rates in this segment to the rates of other segments to ensure you’re nurturing your relationship with this group, who are key to achieving higher response rates over the long term.
Company Example: A Telco’s marketing department sent out a relationship survey once a month to a sample of 5,000 customers. The results of this survey played a crucial role in setting the direction of the firm’s CX and marketing efforts, but the questionnaire was only getting a 4% response rate, leading to questions over the accuracy of the findings. To understand the root of the problem, the CX leader met with the database administrator, who was pulling the sample file. Together they realized the list they were pulling from was sorted by install date, which meant that rather than sending the survey to 5,000 randomly selected customers, it was distributing it to the oldest customers, many of whom no longer had accounts or working email addresses. They improved the sample algorithm by randomizing the sample pull, disqualifying inactive customers, and including customer tenure and demographics into the sample record. This provided a way to improve data quality, analytics, and response rates by tailoring to meaningful customer segments. All these changes ultimately led to response rates over 20% and higher confidence using the findings to shape the Telco’s CX and marketing efforts.
Design: What the Survey Looks Like
Poorly designed surveys won’t just generate bad data, they’ll result in lower response rates, both for that particular survey as well as other future surveys. To increase these rates, you need to design surveys that are easy and engaging – rather than onerous and frustrating – for customers to take.
Here are five tips for moving this lever:
- Keep it short. Customers have better things to do with their time than complete surveys, so the longer your survey is, the lower the completion rate will be. Surveys should not take respondents longer than 10 minutes, especially those fielded through digital channels like in-app notifications, SMS, and intercepts. To keep your surveys short, ask qualifying yes/no questions to skip respondents over irrelevant questions, eliminate questions you’re not prepared to act on, avoid long lists (no more than 8 items), and limit the number of open-ended responses to one per questionnaire.
- Reduce respondent uncertainty. People inherently dislike uncertainty, so the more you can set their expectations accurately upfront, the higher your response rate is likely to be. In the invitation language, identify how long the survey will take…and actually time it, don’t guess! You can also reduce abandonment rates within the survey by including a progress bar to help respondents locate themselves on the path to completion.
- Make it engaging. Rather than asking respondents a string of random, disconnected questions, surveys should follow a logical flow, with smooth transitions between questions and a pace that keeps respondents engaged until the end. Start with easy questions and include transitional questions where appropriate. Use a fun and encouraging style that is on-brand for your organization and brings some personality to the questionnaire.
- Only request necessary information. Don’t ask customers to supply you with information that your company already has, like their email address if you emailed them the questionnaire or automatically generated operational data, such as which pages a visitor viewed on your website or which products a customer already owns. One trick to help you ensure your survey only includes questions you truly need is to start by designing a fake report.
- Author professional invitations. In addition to writing good surveys, you also need to send well-written, authentic, and professional-looking invitations. Within the invitation, communicate your request as clearly as possible and affirm that all feedback collected through the survey will remain confidential. Personalize the invitation with the customer’s name and, where possible, relevant personal information (e.g., “Hi Bill! Can we ask you some questions about your experience opening an account with us today?”). If you’re sending the invitation through a digital channel, include your company’s logo and domain to reassure them the invitation is actually coming from you. Pre-notifying customers that the questionnaire will be coming – and what to expect when it arrives – will also help assure them the request is legitimate.
Company Example: One airline distributed a 50-question post-flight questionnaire to every customer, asking about things like seat comfort, meal quality, and satisfaction with entertainment selection. Response rates dropped precipitously over time as customers who had taken the survey before had no interest in repeating the grueling experience. To improve its rate, the airline shortened the survey to only three questions. It then highlighted these changes in its survey invitations, prominently communicating how simple it was to complete the questionnaire in under two minutes.
Action: How You Respond to the Survey
Customers are not going to waste their time completing a survey if their feedback is just going to be ignored. If your survey doesn’t have an explicit customer benefit or follow-up, respondents will notice and your response rates will decline. Moving this lever isn’t just about using the data you collect to make changes – though that is critical. It’s also about communicating these changes back to customers so they know their feedback leads to tangible improvements.
Here are five tips for moving this lever:
- Thank every single respondent. Follow up with each respondent to thank them for their time. Send this message in the same channels they use to communicate – call people who leave a phone number, email people who provide an email address – to make sure you’re reaching them where they are.
- Take at least one action per survey. Set the expectation internally that your company will take at least one action based on the results of the survey. If you do not have the organizational commitment or resources to act on any of the findings, strongly consider not fielding the survey in the first place.
- Communicate using “we heard you” statements. Deliver news back to all customers – even non-respondents – about what you learned from the feedback and what may change as a result. To reinforce this message, we recommend using “we heard you” statements to describe the actions in marketing materials.
- Offer incentives. One of the most effective ways to boost response rates is to offer customers rewards or incentives for completing the questionnaire. These incentives can take many forms – from monetary enticements to raffles to unique loyalty benefits. One powerful, inexpensive way to incentivize respondents – and make customers feel important – is to provide a sneak peek of key findings with those who complete the survey and solicit their ideas for potential improvements.
- Change policies, don’t punish employees. If you use survey results as a significant means of either punishing or celebrating individual employees, they are likely to engage in unintended behaviors to increase their scores, such as badgering customers for good ratings, over-indexing on activities that raise their numbers or wasting time debating the accuracy of these metrics. This won’t only hurt employee engagement, it will also result in less accurate responses from customers. Rather than using surveys as a carrot or stick for employees, use the insights to adjust policies and processes and shape employee coaching and training.
Company Example: Over the course of a few months, one fast food restaurant saw its response rate to the satisfaction survey they included at the bottom of every customer receipt plummet. Upon closer analysis, the restaurant found that a large percentage of customers were using the survey to complain that their curly fries – the restaurant’s signature offering – were still frozen in the middle. Despite all the complaints, the problem hadn’t been fixed, so customers felt the restaurant didn’t care about their feedback. It turned out that the problem had been ignored because the CEO, who regularly ate curly fries himself, found them all perfectly cooked and told the teams to ignore the feedback. Once the issue was finally acknowledged, the restaurant realized that the frozen centers stemmed from a lack of dethawing time due to increased customer demand. They were able to change the preparation process to avoid the problem, and they added in-store signage letting customers know their feedback had been acted upon. After that, the response rate rose to higher than it had previously been, prompting the restaurant to update the signage regularly to share how it was responding to customer feedback.
The bottom line: Response Rates are contextual, not absolute, but if you use these four levers, you will improve your rates and exceed the norms over time.
Eddie T. Accomando MA(ABD) is a senior CX XM Scientist with Qualtrics.
Isabelle Zdatny, XMP, CCXP, is an XM Catalyst for Qualtrics XM Institute


