Do your customers and employees want to do things on their computers, phones, or in-person? This question is central to determining how much you invest in different types of experiences. As you’ll see in this post (which hopefully won’t be a surprise), digital channels are critical around most of the world.
That’s why just about every organization needs to build robust digital experience management (XM) capabilities. But the preferences for digital experiences aren’t the same from country to country.
In a recent data snapshot, Global Study: Consumer Channel Preferences, we analyzed the channel preferences of nearly 18,000 consumers across 18 countries. How? We asked them to select their preferred interaction channels for completing eight common interactions:
- Get technical support for a computer
- Resolve an issue with a bill
- Purchase a new television
- Schedule a medical appointment
- Apply for a new bank account
- Select a new mobile phone plan
- Get status on an order you made
- Book an airline ticket
We chose to examine these interactions because they represent a cross-section of different activities that can be used to extrapolate preferences across a wide variety of other interactions. If your customers or employees have similar types of interactions, then it’s likely that they will have similar channel preferences.
Our data snapshots are full of insights, so I thought I’d share some of the elements that I found to be most interesting, starting with this figure that summarizes the results by country across all eight interactions.
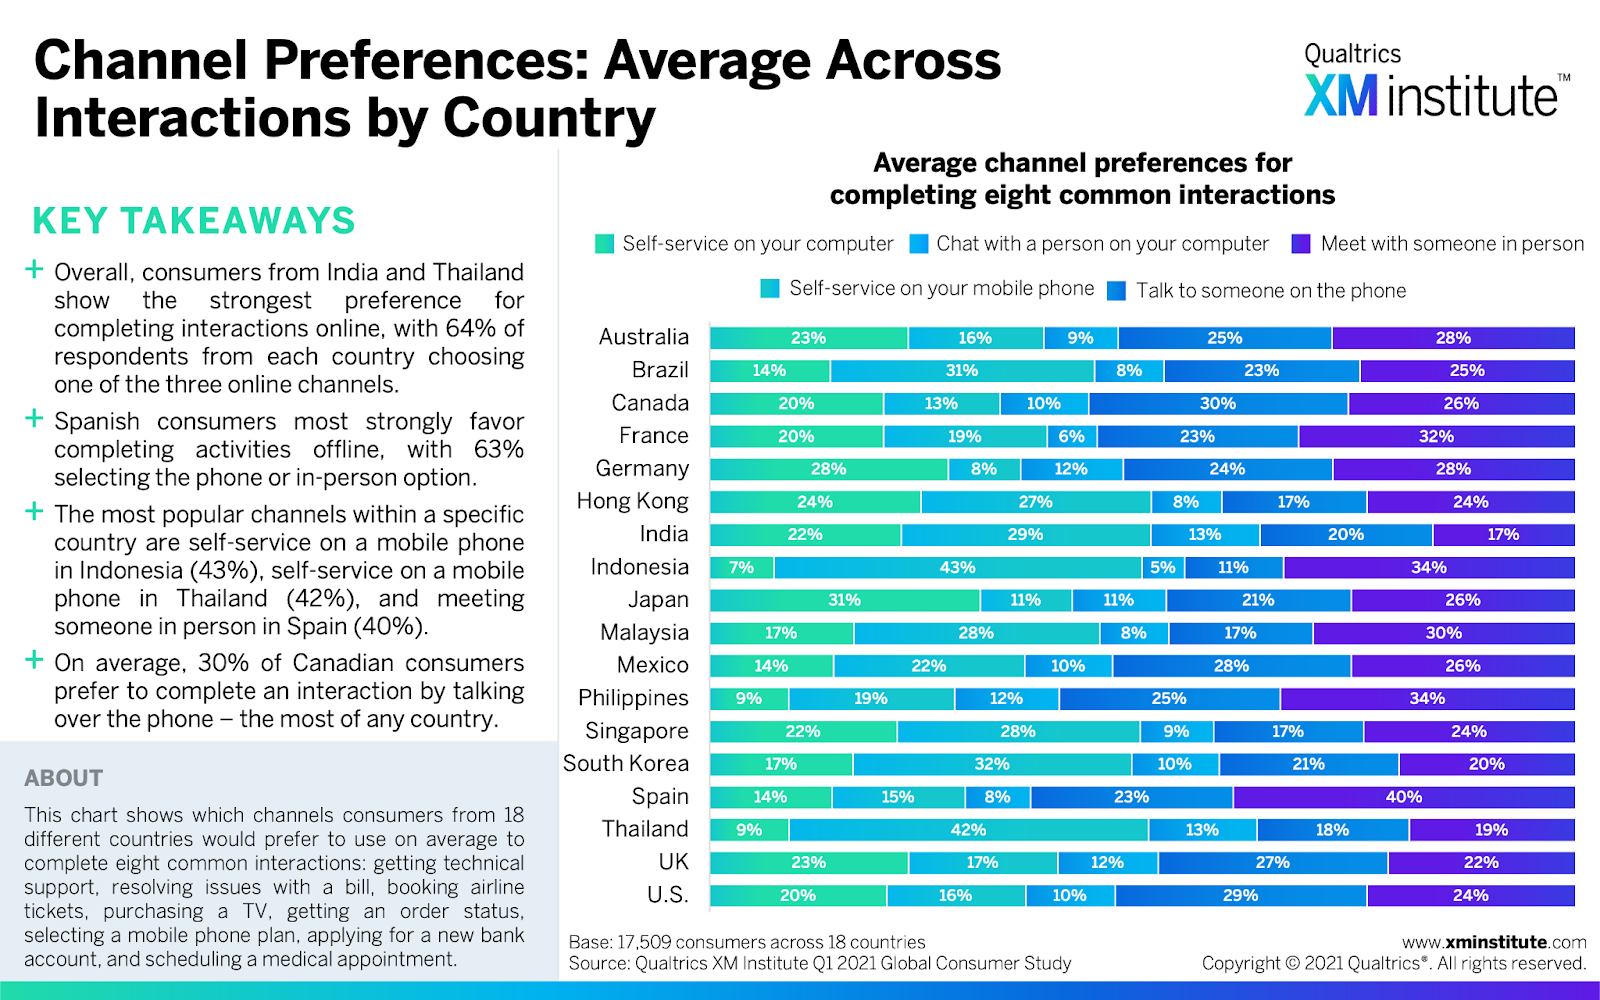
As you can see in the chart:
- Online self-service is (mostly) dominant. When we combine the preference for self-service interactions on the computer with those on a mobile phone, these digital channels are the most preferred in 16 of the 18 countries. The preference for these digital options ranges from 51% in Thailand, India, and Hong Kong down to less than 30% in Spain and the Philippines. In those digital-lagging countries, consumers most prefer to meet someone in person.
- Countries differ on the computer/mobile digital divide. When we look at how consumers split their preference for self-service between devices, we find that 10 countries most prefer their mobile phones, while 8 prefer their computers. Mobile phone preferences (as a percent of all self-service preferences) range from more than 80% in Thailand and Indonesia, down to less than 30% in Japan and Germany.
- North Americans like to talk on the phone. Canada, U.S., and Mexico are the places where consumers are most likely to prefer an interaction over the phone. Canada tops the list at 30%, and Indonesia is at the bottom with 11%.
The report has 17 additional data figures with a ton of useful insights. Here are some of the highlights that jump out to me:
- Online preferences vary by age. Consumers who are younger than 54-years-old most prefer self-service on their mobile phones, while older consumers most prefer to meet with someone in person. Interestingly, the segment most interested in digital are the people between 35- and 54-years old. Forty-four percent of this middle group prefers online self-service compared with 40% of younger adults.
- Airline bookings are the most digital. Across the 18 countries, 64% of consumers prefer to book their flights online, making it the most digitally-preferred interaction. The preference for online bookings ranges from a high of 76% in Singapore down to a low of 51% in Spain. Japanese consumers show the most preference for booking flights on their computers and Indonesians most prefer to book them on their mobile phones.
- Order status is the most mobile-centric. On average, 37% of consumers prefer to use their mobile phones to get access to order status, the highest level for any activity. This mobile preference ranges from a high of 58% in Thailand down to a low of 15% in Japan.
- New TVs and bank accounts are mostly in-person. The two areas where consumers most prefer an in-person interaction are when they buy a TV (51%) or apply for a new bank account (44%). For TV shopping, the in-person preference ranges from a high of 64% in Spain down to a low of 24% in India. For opening new bank accounts, the in-person preference ranges from 60% in Spain, the Philippines, and France down to 24% in India.
- Complex topics require phone calls. The top two areas where consumers most want to talk on the phone are resolving an issue with a bill (39%) and scheduling a medical procedure (38%). Using a phone call for resolving an issue is most preferred in Canada (57%) and least preferred in Indonesia (16%). The preference for using a phone call for scheduling a medical appointment ranges from a high of 60% in Germany down to a low of 22% in Singapore and Indonesia.
- Chat is pretty much just for tech support. Compared to the other channels in the study, chat is the least popular. However, it’s most popular for resolving a technical issue with computers (17%) although consumers have a higher preference for handling this issue via phone call (29%) and in-person (26%). Preferring to use chat for a technical support issue ranges from a high of 25% in Thailand to a low of 8% in Indonesia.
The bottom line: Channel preferences, like many preferences, vary widely around the world.
Bruce Temkin, XMP, CCXP, is the Head of Qualtrics XM Institute