If you want customers to recommend your company, make sure they have a good experience. In this post, I share data and analysis showing how customer experience correlates to customer recommendations across 20 industries. At the bottom of this post we’ve assembled a number of industry-specific data charts that you can download and use.
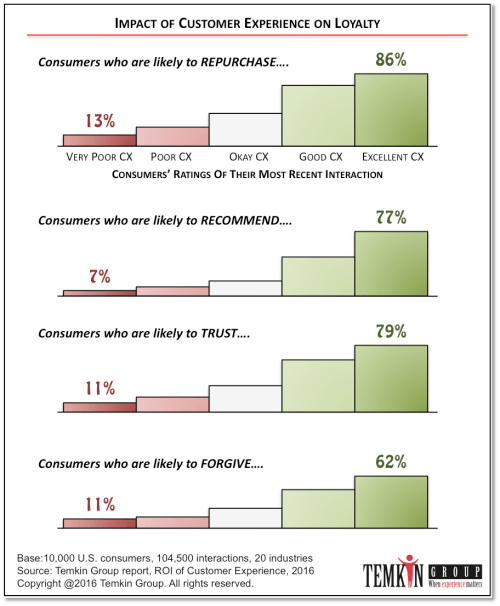
In the report, ROI of Customer Experience, 2016, we provide a lot of data on how customer experience affects a number of different aspects of loyalty for 20 industries. Here’s a summary of some of the data showing the average connection between customer experience and loyalty across all industries.
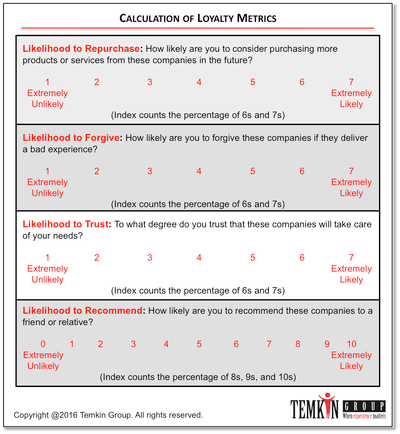
Here’s how we calculate this data:
- We ask 10,000 U.S. consumers to identify the companies that they’ve interacted with during the previous 90 days
- We have those consumers rate their experiences and segment the respondents into five buckets based on their Temkin Experience Ratings feedback
- For each of the five buckets of consumers, we calculate the average loyalty of the group across different dimensions using the calculations below…
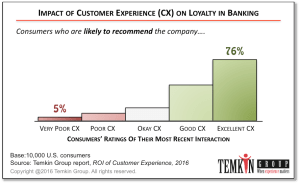
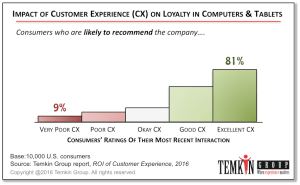
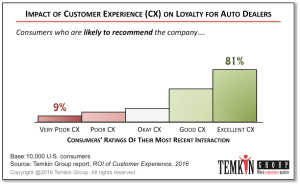
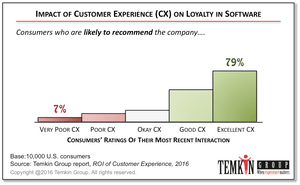
CX and Recommendations Charts for 20 Industries
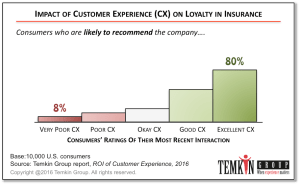
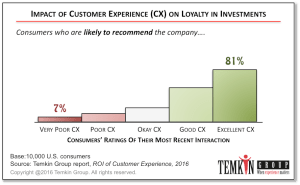
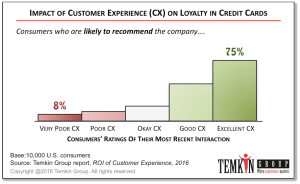
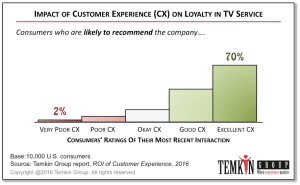
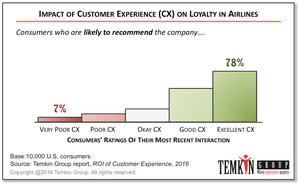
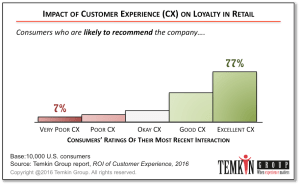
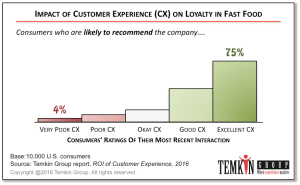
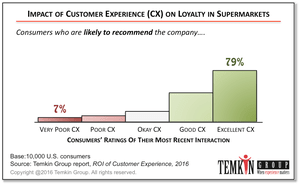
If you’re looking for good data for your industry, we’ve put together these 20 industry charts that show the relationship between customer experience and customers making recommendations. Feel free to use them within your presentations in accordance with our citation policy.
Here’s a way to share the data internally…
At [Your Company’s Name], we work hard to improve our Customer Experience, and this industry chart from Temkin Group shows why it’s important and meaningful. As our Customer Experience improves, research shows that consumers are more likely to recommend us, which is one of the many ways in which our customers show their increased loyalty.


This blog post was originally published by Temkin Group prior to its acquisition by Qualtrics in October 2018.