In my previous post, I identified five strategies for leaders to combat discrimination within their organizations. That was the start of Qualtrics XM Institute’s efforts to eliminate discrimination. One of the other ways that we can hopefully drive improvements is to use our research to shine a light on some of the issues.
Given that reports have shown that COVID-19 is disproportionately affecting communities of color in the United States, we decided to look at two recent data-oriented posts with a new lens, differences across self-reported ethnic groups.
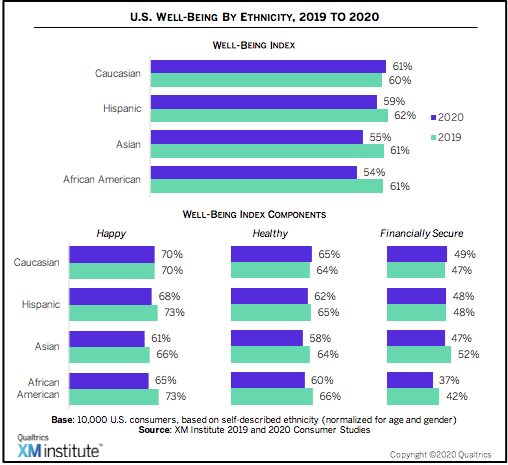
African Americans’ Well-Being Dramatically Declines In 2020
We recently identified a drop in the well-being of 10,000 U.S. adult consumers, examining the percentage of respondents who agree with these statements:
- I am typically happy
- I am healthy
- I am financially secure
This year’s data comes from a study that we completed in early May. We analyzed the results based on self-described ethnicity. To help distinguish ethnicity differences from other demographic differences, we weighted responses based on the overall age and gender mix in the U.S. population. Here’s some of what we found:
- African Americans have the lowest well-being… Looking at the overall Well-Being Index, African Americans have the lowest score, 54%. Asians are only slightly higher at 55%.
- … and dropped the most from last year. When we looked at the differences between 2019 and 2020, we found that African Americans dropped seven percentage-points, the most of any group. Caucasians actually increased one point.
- Financial security is the biggest gap. Only 37% of African Americans reported that they are “financially secure,” which is 12 percentage-points below Caucasians.
- Asians are the least happy and healthy. For two of the components, happiness, and healthiness, Asians have the lowest scores.
- African American happiness drops the most. The single-component to drop the most between 2019 and 2020 is the happiness of African Americans, which fell eight percentage points.
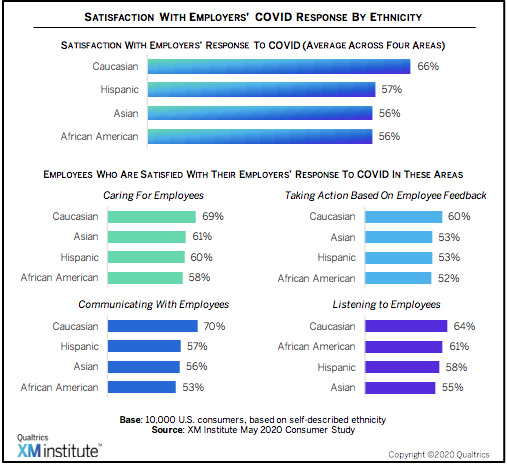
African Americans Are Least Satisfied With Employers’ Response To COVID-19
To understand the impact that COVID is having on employees, we asked more than 5,000 U.S. employees how satisfied they were in four areas of their employers’ response to the pandemic: caring for employees, communicating with employees, listening to employees, and taking action based on employee feedback. As you can see in the chart below, there are substantial differences across ethnic groups. Most notably:
- Caucasians are a lot more satisfied. Looking at an average across the four areas, 66% of Caucasians report they are satisfied with their employers’ response to COVID, which represents a roughly ten percentage-point gap with Hispanics, Asians, and African Americans.
- African Americans are the least satisfied in most areas. When it comes to caring, communicating, and taking action, African Americans give their employers the lowest ratings of any group.The only exception is that Asians are the least satisfied with how well companies are listening to employees.
- Communication is the biggest gap. The largest difference in satisfaction across groups is in the area of communicating with employees. Seventy percent of Caucasians report feeling satisfied, compared with only 53% of African Americans.
Closing Thoughts
One of the six traits of human beings is that we are self-centered. As a result, people don’t naturally make decisions based on the thoughts and feelings of others, instead, we rely heavily on our personal experiences of the world. Since the data shows that African Americans are suffering more than other groups, this can lead to a potentially problematic disconnect in the perspective between Caucasian leaders and African American employees.
As XM professionals, we should find ways to close the gaps in both perspectives and experiences. As always, I’d love to hear your ideas for how we can collectively make this happen.
Notes On Methodology
For those of you who are interested, here’s how we do the study:
- Survey 10,000 U.S. consumers online through a third-party panel provider.
- Set respondent quotas based on mirroring the U.S. census for age, income, gender, ethnicity, and region.
- For the Well-Being Analysis, we:
- Ask consumers the degree to which they agree or disagree with the statements above, using a five-point Likert scale.
- For each of the three components (happy, healthy, financially secure), calculate the percentage of people who agree; the top two points on the scale.
- Calculate the overall Well-Being Index by taking the average of the three components.
- Weight the responses in each ethnic segment based on gender and ages, across three age groups (18 to 34, 35 to 54, and 55 or older). Note: In our broader reporting on the Well-Being Index where we do not look at ethnicity, we weight the data based on seven age groups. Why the difference? We have less data when we break it up by ethnicity.