Net Promoter Score(R) (NPS) is one of the most popular customer experience measurements, with 70% of CX programs using it as a core metric.1 So as part of our annual U.S. Consumer Study, we track the average NPS rating of organizations across 20+ industries.2 In this blog post, we examine how NPS has changed over the past few years.
NPS Stabilized in 2023
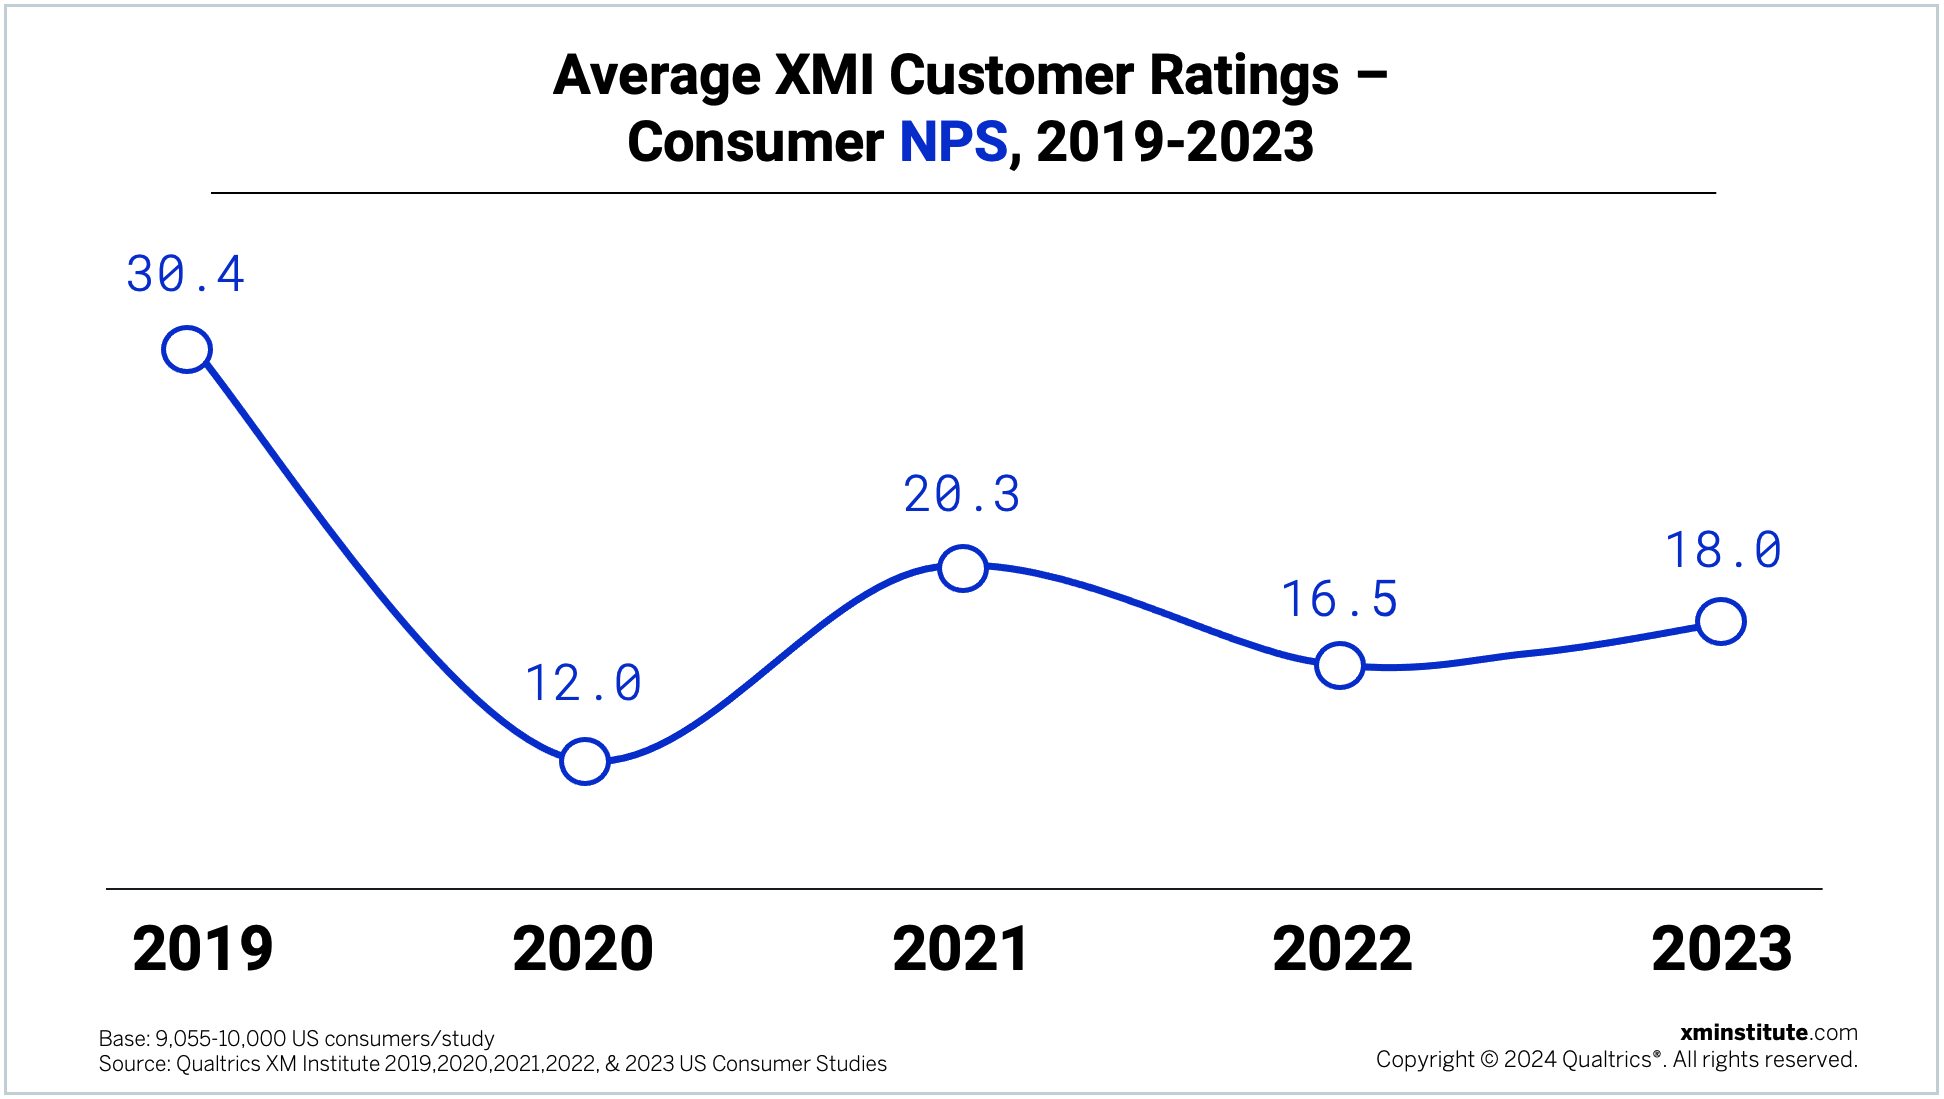
In the wake of the pandemic, the average cross-industry NPS plummeted from its high of 30.4 in 2019 down to just 12.0 in 2020. While it ticked back up in 2021, it dropped again in 2022. In 2023, the average NPS rose slightly, hovering almost exactly halfway between the 2021 and 2022 scores.3 Overall, the cross-industry NPS average increased by 9% (+1.5 points) between 2022 and 2023.
Consumer Payments Fall Behind
As part of this analysis, we also examined how individual industries’ 2023 NPS ratings compare to their performance in 2022. Overall, industries’ average NPS shifted less in 2023 compared to previous years, increasing only by an average of 1.5 points.
We also found that:
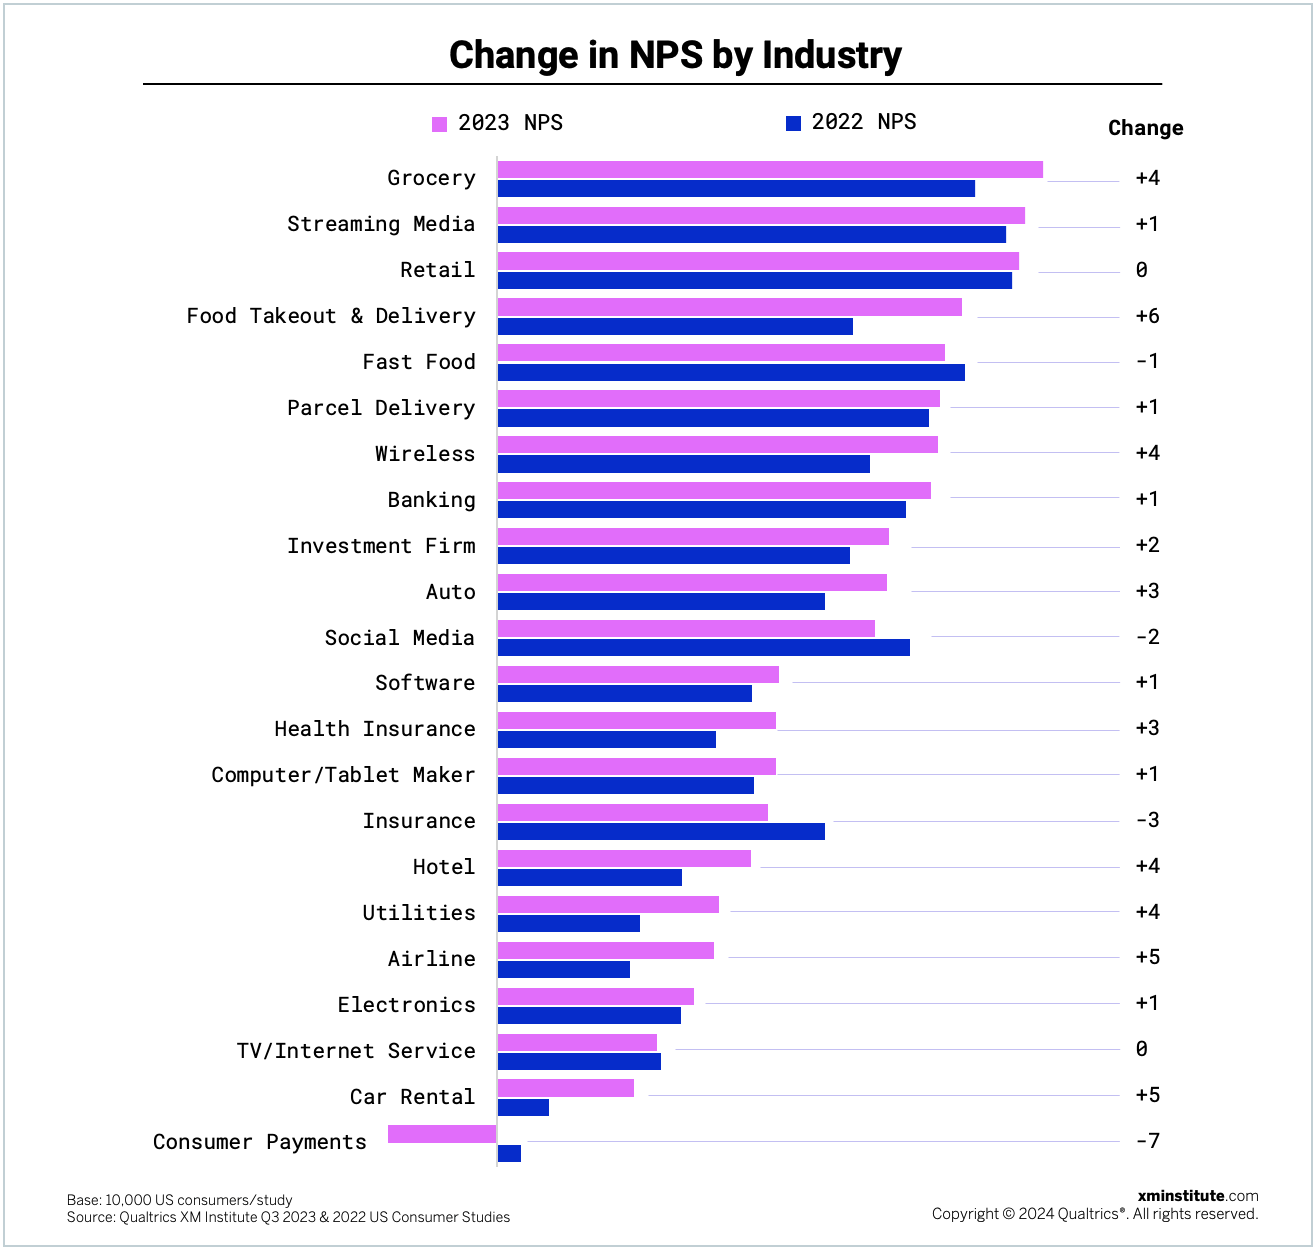
- NPS rose in 17 of 22 industries. Between 2022 and 2023, the average industry NPS increased for all industries, except for fast food, social media, insurance, TV/ISP, and consumer payments.
- Grocers earned the highest scores. Like in 2022, grocers, retailers, and streaming media companies earned the three highest average NPS ratings. However, unlike last year, in 2023 grocers came out on top, with an average NPS of 30.1. The streaming media and retail industries were close behind with 29.1 and 28.8 respectively.
- NPS fell most for consumer payment providers. Not only were consumer payments once again the lowest-scoring industry in the study, but their average NPS fell from +1 in 2022 to -6 in 2023, a drop of 7 points and the largest decrease across all industries. The insurance industry saw the second sharpest decline, falling 3 points between 2022 and 2023.
- The takeout/delivery industry enjoyed the biggest gains. The food takeout and delivery industry received the most significant NPS increase over the last year, improving from 19.6 in 2022 to 25.7 in 2023. Average NPS for airlines and car rental agencies each rose by 5 points over the last year – the second largest jump. Despite this improvement, car rental agencies are once again in the second-lowest spot in the rankings.
NPS Improves Amongst Young Consumers
We also looked at how average NPS varies across consumers of different ages and how these scores have shifted over the past year.
We found that:
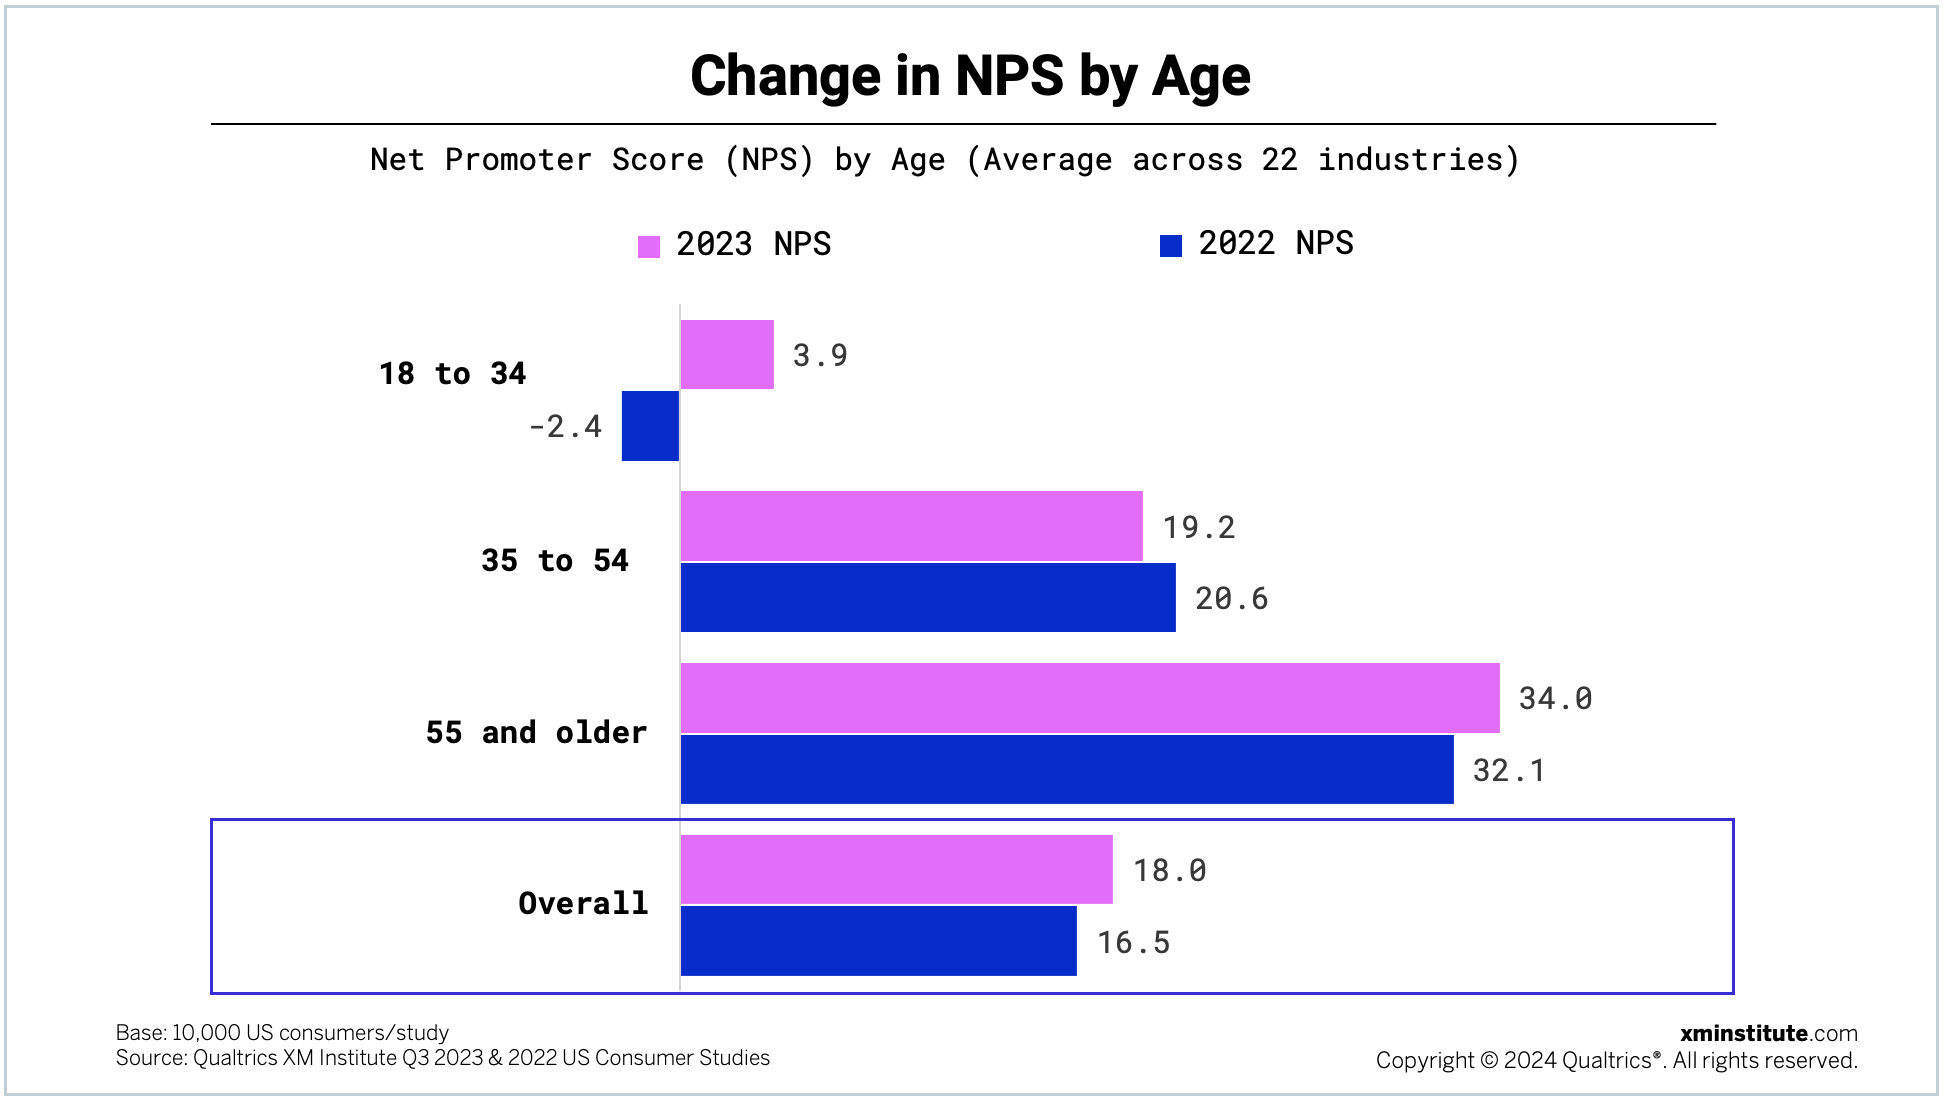
- Young consumers give low scores. The average NPS for U.S. consumers between 18 and 34 years old is just 3.9. Average NPS rises with each age group, with 35- to 54-year-olds giving average ratings of 19.2 and those who are 55 and up giving average ratings of 34.0.
- NPS changed the most for younger consumers. While they continue to give significantly lower ratings than their older counterparts, 18- to 34-year-olds increased their average NPS by more than 6 points over the last year, jumping from -2.4 in 2022 to 3.5 in 2023.
- Middle-aged consumers’ NPS decreased. Of the three age groups, only the middle one – those between the ages of 35 and 54 – gave a lower average NPS in 2023 compared to 2022. NPS for this group declined by 1.4 points, from 20.6 down to 19.2.
The bottom line: After several years of turbulence, customer sentiment appears to be normalizing.
Isabelle Zdatny, XMP, CCXP is the Head of Thought Leadership for XM Institute
Talia Quaadgras is a Research Program Manager with XM Institute
- The Ratings are calculated using the standard NPS® method. Net Promoter Score, Net Promoter, and NPS are registered trademarks of Bain & Company, Satmetrix, and Fred Reichheld.
- This year’s scores come from Qualtrics XM Institute’s Q3 2023 US Consumer study of 10,000 US consumers. To calculate the NPS for each industry, we asked 10,000 people to evaluate 351 companies across 22 industries. Respondents provided Net Promoter Scores for companies they had recently interacted with, and we averaged those individual company scores to produce an average rating for each industry. If you are a Qualtrics CX client and interested in methodology, additional benchmark metrics, or a list of companies included in this research, you can access the benchmark editor through Qualtrics.
- We added 2 industries to our cross-industry scoring in 2021, for a total of 20 industries in 2019-2020 and 22 industries in 2021-2023.


