Digital Experiences Are On The Rise
In recent XM Institute global research, we found that consumers’ use of online channels are on the rise around the world. To measure the growth of online activities, we created an online momentum index, which is calculated by taking the percentage of consumers who expect to do more of an online activity in the future and subtracting the percentage who expect to do less of that activity. Our analysis found that:
- Global digital momentum is very high at +25. When we examined consumers’ future plans across countries, we found that 42% of consumers expect to do more online, while 17% expect to do less. The difference results in an online momentum index of +25.
- Momentum across online activities ranges from +5 to +41. We examined consumers’ plans for 13 individual online activities, and found that they all have positive momentum
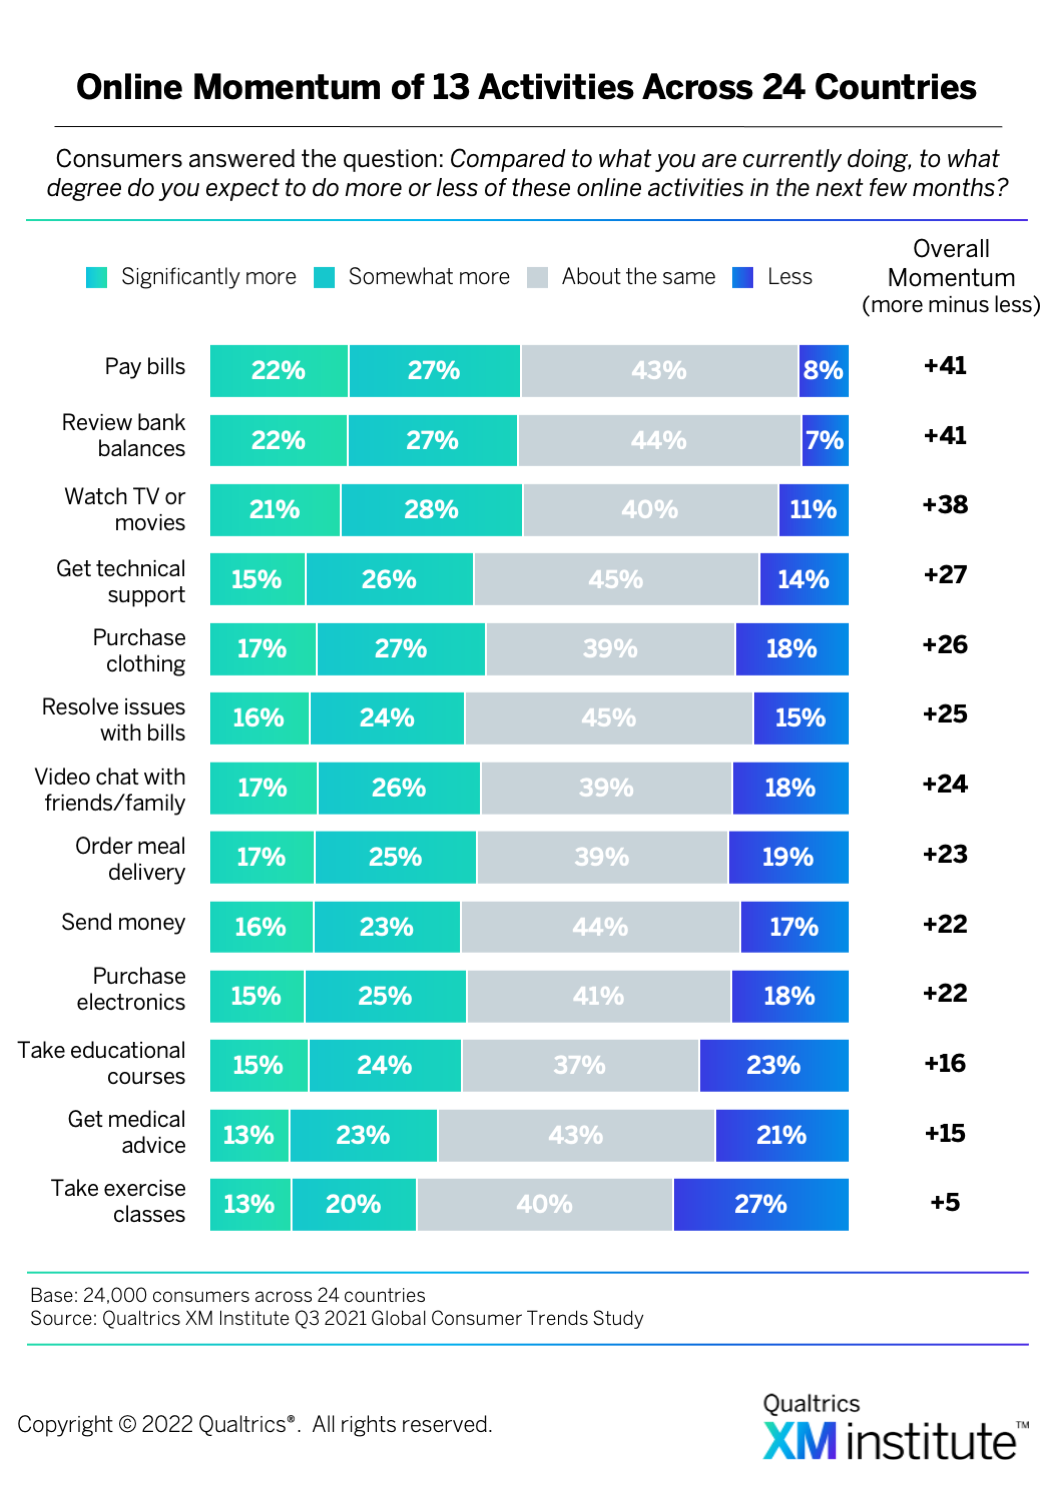 1. At the high-end, online bill paying and reviewing bank balances have momentum scores of +41. At the low end, taking online exercise classes only has a momentum index of +5.
 - Momentum across countries ranges from +63 to 0. We combined the plans for those online activities into a single online momentum index for each of the 24 countries in our study2. At the high-end, Vietnam, India, and Thailand all have online momentum indexes about +50. At the low end, Germany’s online momentum index is 0.
Examining Digital Experience (DX) Metrics
Given the rising importance of online interactions, organizations need to understand the quality of their digital experiences. To help companies gauge the effectiveness of their online offerings, Qualtrics XM Institute analyzed data from several years of its consumer studies to examine three critical elements of the digital experience 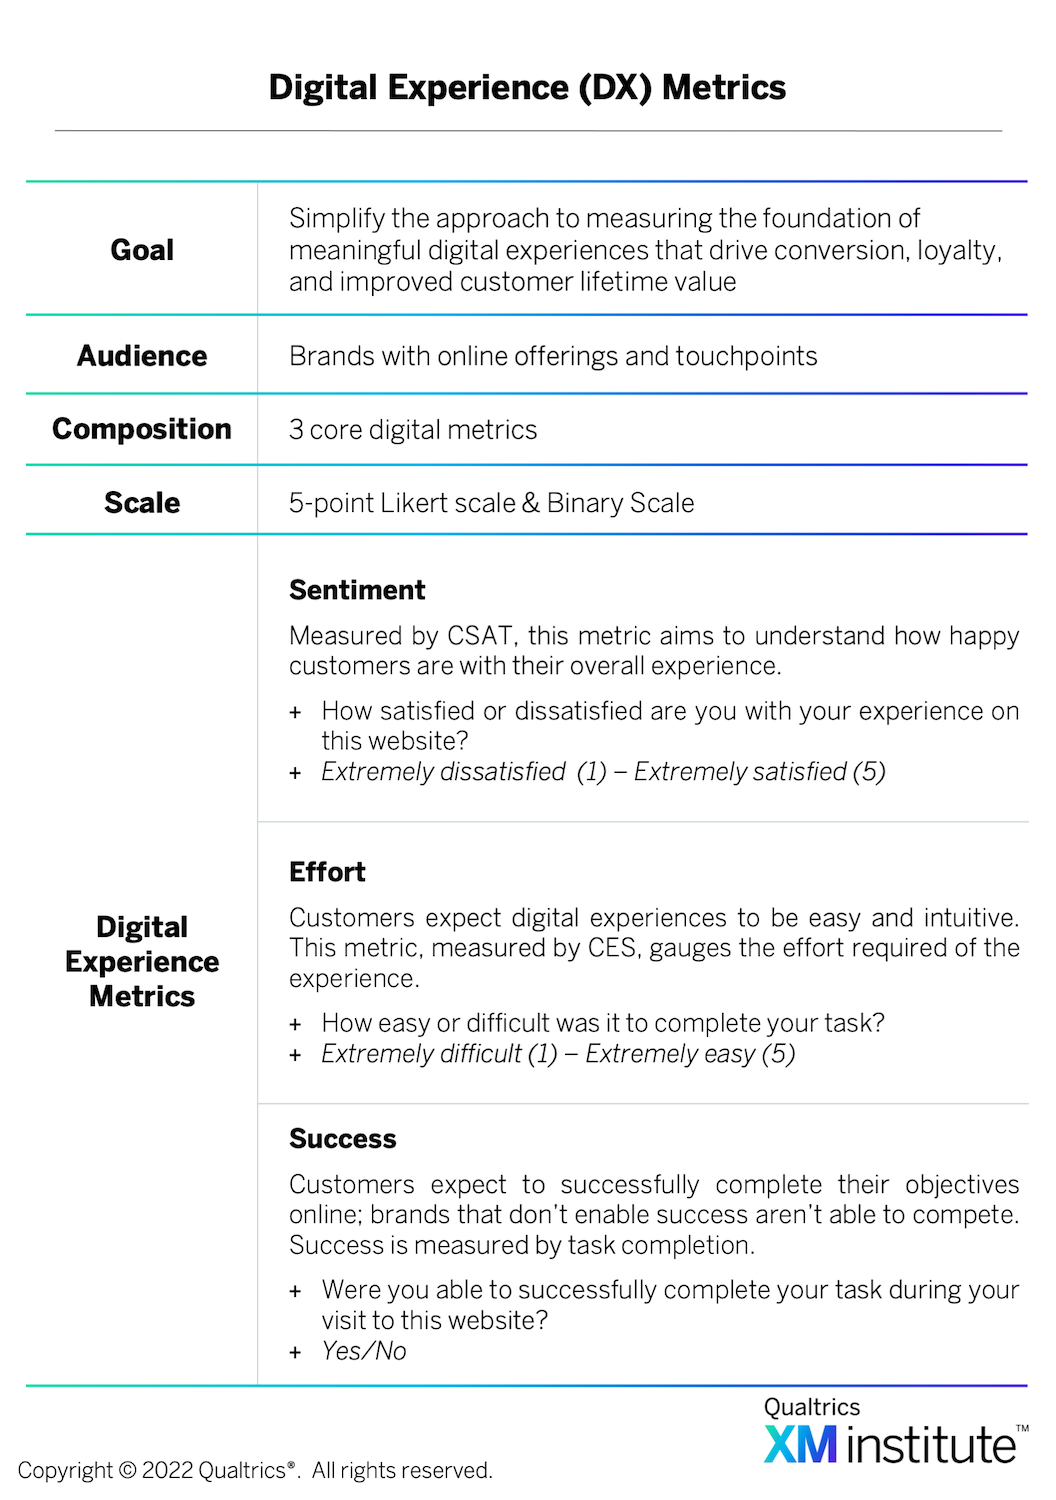 :
:
- Success. It’s 2022, and customers rightfully expect to be able to achieve their goals online. We measure “success” by task completion, simply asking customers if they were able to complete their task or not.
- Effort. People naturally gravitate towards experiences that are easy and intuitive. So we measure “effort” by asking how easy or difficult it was to complete the task at hand.
- Satisfaction. In the end, we want customers to have a positive perception of the overall experience. We measure “satisfaction” by asking how satisfied or dissatisfied customers are with their overall digital experience.
When we examined these individual DX metrics within the 2021 U.S. benchmark, we found that the:
- Success rate is highest for consumer payments. The average success score across industries is 91%, and it ranges from a high of 96% in consumer payments to a low of 85% in travel sites.
- Effort scores are highest for specialty retail. The average effort score across industries is 88%, and it ranges from a high of 93% in specialty retail to a low of 72% in government.
- Satisfaction level is highest for specialty retail. The average satisfaction score across industries is 84%, and it ranges from a high of 93% in specialty retail to a low of 64% in government.
Quality of Digital Experience Impacts Spending
As part of our benchmark research in 2021, we asked consumers about their recent purchase behavior and the amount of money they spent during their digital transaction. Because spend varies widely from one industry to the next, we normalized customer spend to get one, consistent measure of performance. Our analysis cross industries revealed that:
- Increasing satisfaction results in a 37% increase in customer spend. Moving a customer from an ‘extremely dissatisfied’ experience to an ‘extremely satisfied’ experience results in a 37% increase in their spend potential.
- Decreasing effort results in a 23% increase in spend. Moving a customer from a rating of ‘extremely difficult’ to ‘extremely easy’ results in a 23% increase in their spend potential.
- All customer spend requires purchase success. A customer who isn’t able to complete their purchase or simply decides to abandon a cart contributes no revenue to your business. Purchase success rates ranged from 98% for specialty retail down to 86% for automotive.
Digital Experience Gaps Costs 8% of Sales
In the previous analysis, we examined the spending increase associated with an improvement in digital experiences based on differences in individual consumer behaviors. To quantify how these behaviors impact an overall industry, we looked at the distribution of digital experience satisfaction scores for each industry along with the spending differences at each level. By combining the rates for individuals who were unable to complete their intended purchase with the impact of Satisfaction scores for each industry, we were able to estimate the revenue lost for each industry due to a less than ideal digital experience 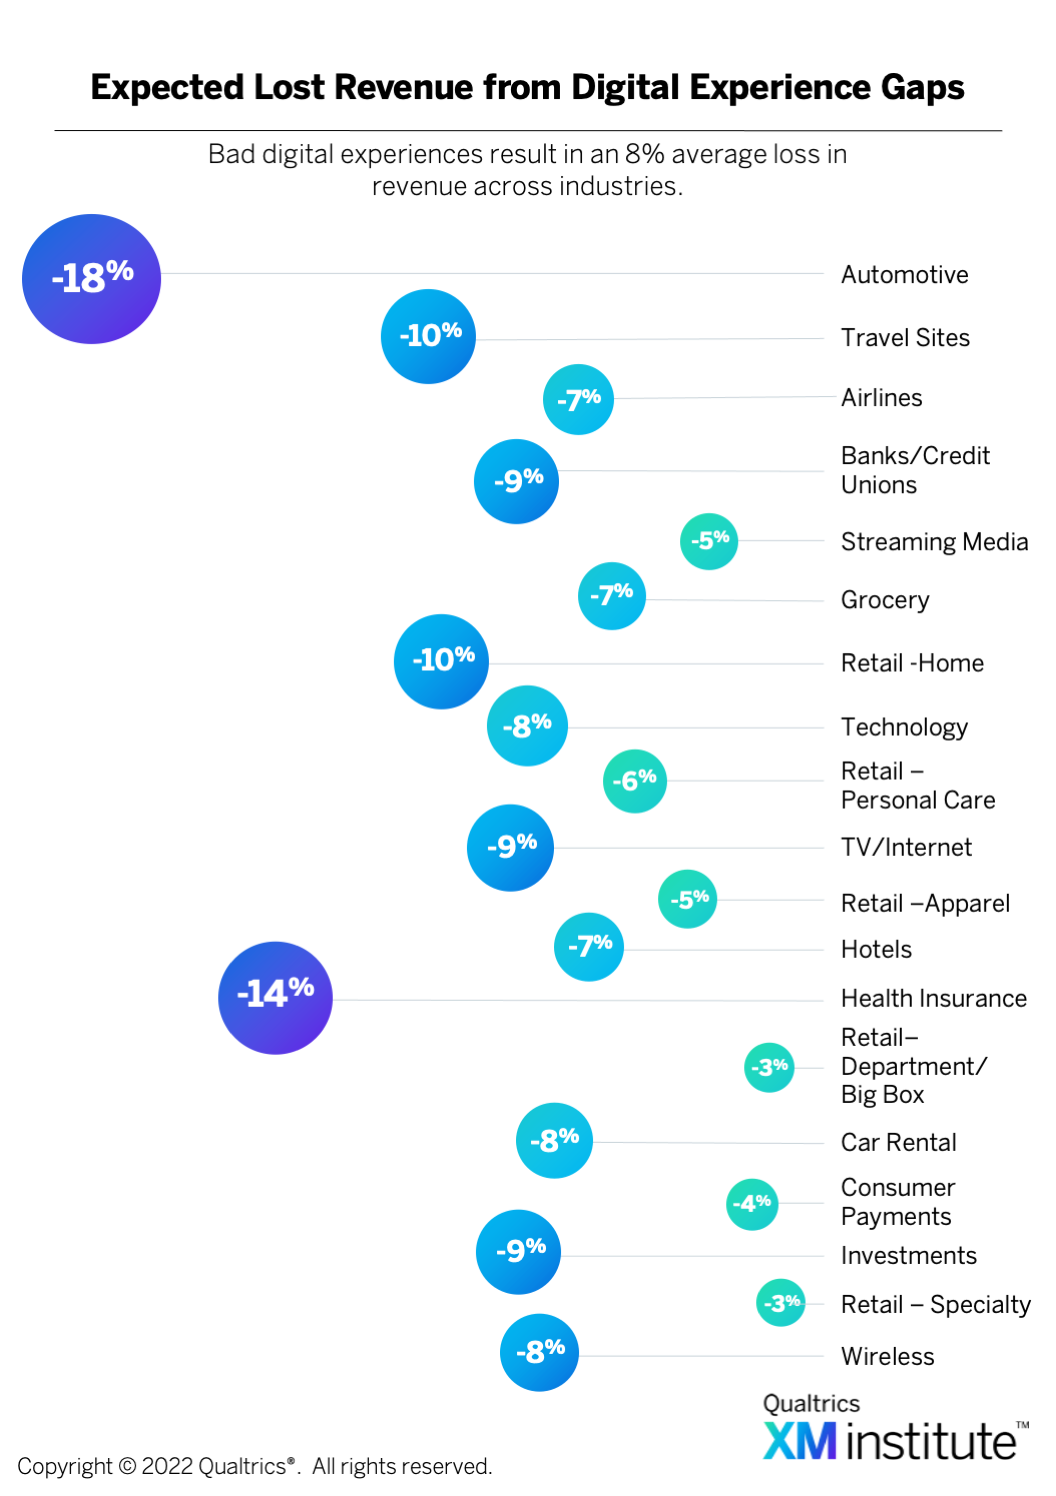 . Our analysis showed that:
- Digital experience gaps results in an estimated 8% loss in revenue. When we normalize data across industries, we find that less than fully satisfying digital experiences drive an average revenue loss of 8% across industries (see Figure 3). The largest losses are in the automotive (18%) and healthcare (14%) industries. At the other end of the spectrum, specialty retailers only face 3% loss of revenues..
- Retail websites generally perform the best. Four of the five retail categories we measured were among the best six industries when it came to minimizing the impact of poor digital experiences; ranging from a 3% loss for specialty retailers at the low end to 6% loss for personal care retailers. The lone exception in retail performance was home retailers, with 10% estimated losses.
- Travel brands outperform travel aggregators. Hotels, airlines, and car rental companies showed an average expected loss of 7%, which is slightly less than the average across all industries. In contrast, dedicated travel sites that aggregate the travel experience have a 10% expected loss which was third from the worst among all industries we measured.
Digital Experiences Impact More Than Sales
Digital experiences are critical for more than just selling. On average, only 22% of customers indicated their primary purpose was to make a purchase. The remainder of customers sought to complete other common tasks: browsing, researching a purchase, comparing prices or managing an account. When we reviewed the success, satisfaction, effort and likelihood to return associated with non-purchase tasks, we found that 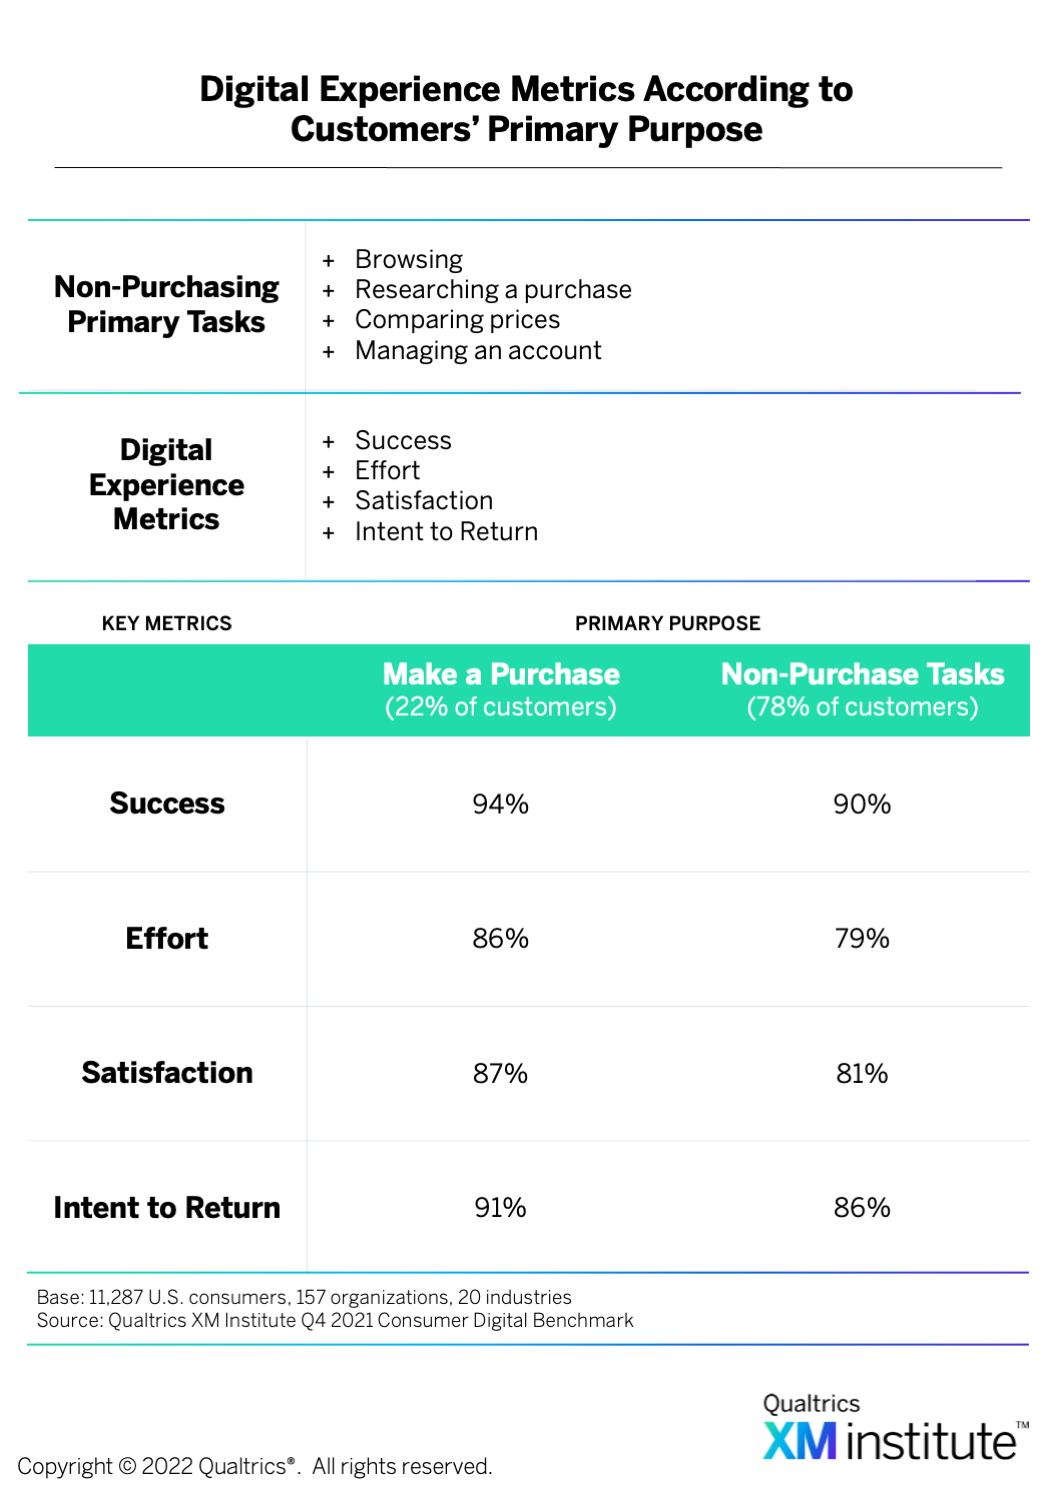 :
:
- Customers are less successful with non-purchase tasks. On average, the customers who intended to complete a non-purchase task were successful 90% of the time while those intending to make a purchase were successful 94% of the time.
- Satisfaction and Effort lag behind for non-purchase tasks. Customers, on average, found their experiences ‘satisfying’ 81% of the time and ‘easy’ 79% of the time, for non-purchase tasks, compared to 87% and 86% respectively for purchasing experiences.
- Non-purchase tasks lead to lower intent to return. When customers engage in a non-purchase task, they say they are likely to return to that website in the future 86% of the time, on average. In contrast, the average for those who are likely to return after an attempt to make a purchase is 91%.
Build Your Digital Experience Management Skills
If organizations fail to focus on and prioritize their online channels, the revenue they lose will likely increase as consumer adoption grows. To make the required improvements, organizations need to treat Experience Management (XM) as a critical discipline. Our research shows that companies with strong XM capabilities have significantly stronger digital interactions 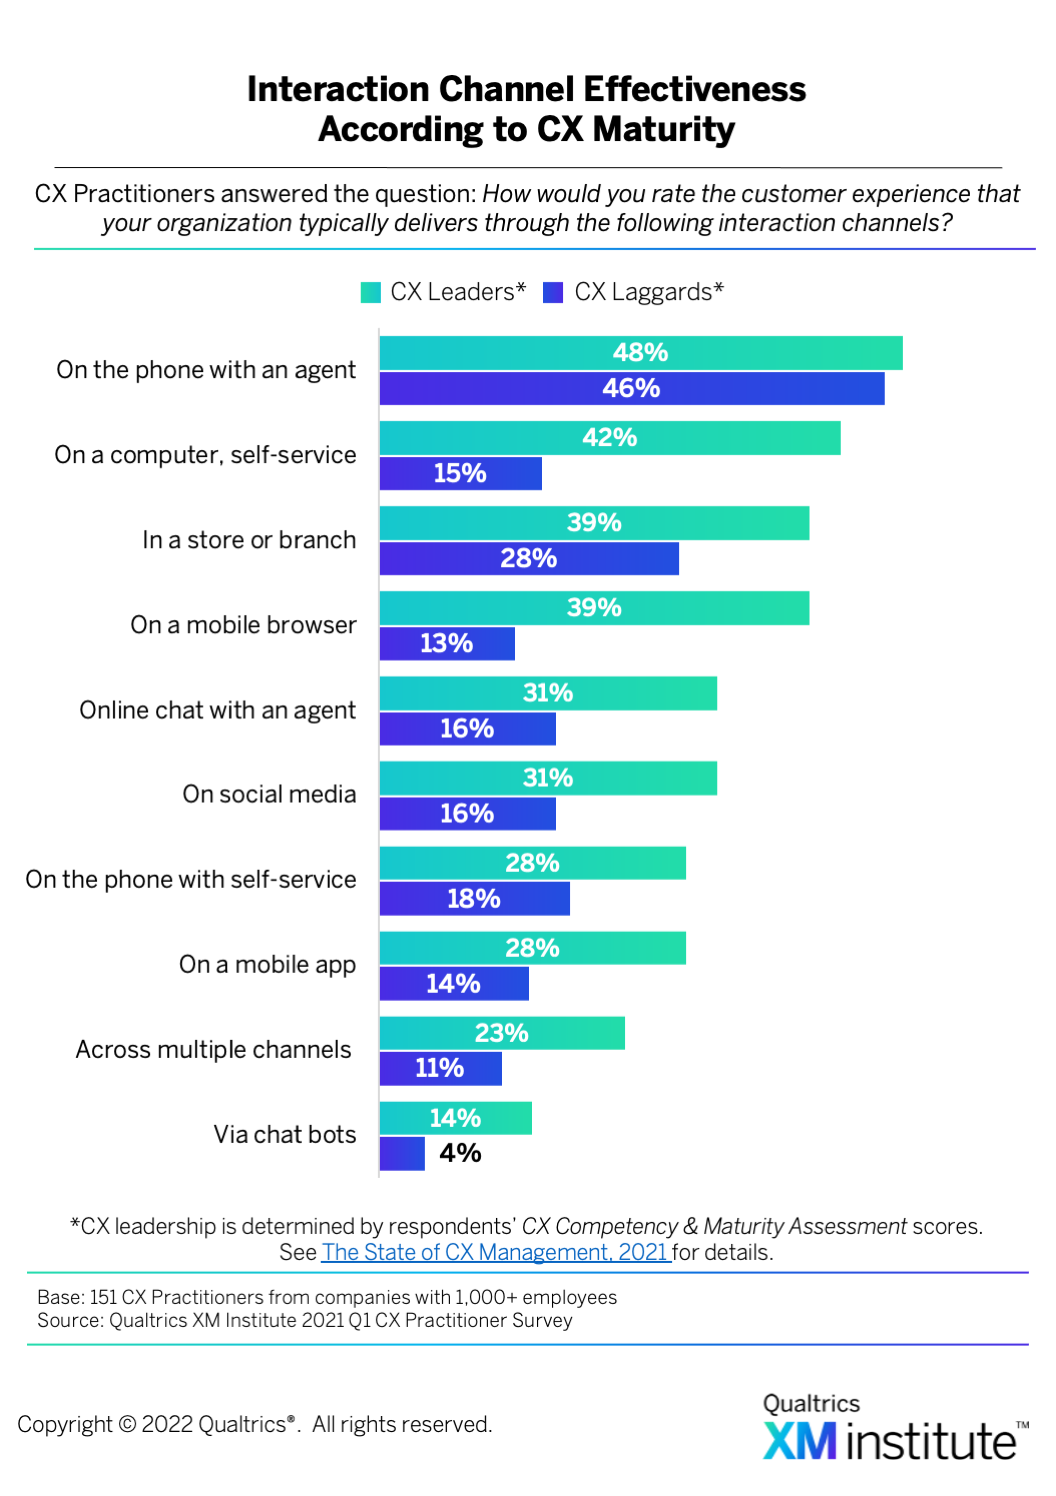 3. How can you start building your Digital XM skills4?
- Assess your digital competencies. An organization’s ability to design and deliver easy, emotionally engaging digital interactions takes commitment of time and resources. Our research shows that organizations evolve through five stages of maturity, from “Investigate” to “Embed.” To understand the current state of your digital CX program and develop plans for making progress towards your goals, take the Digital CX Maturity Assessment6.
- Measure your online experiences. It’s important to establish a measurement system to understand how customers and prospects think about your digital properties. Consider adopting our Digital Experience (DX) Metrics Methodology with the three core dimensions of Success, Satisfaction, and Effort. It’s also helpful to take this a step further and connect the core metrics to customer spend or cart abandonment rates
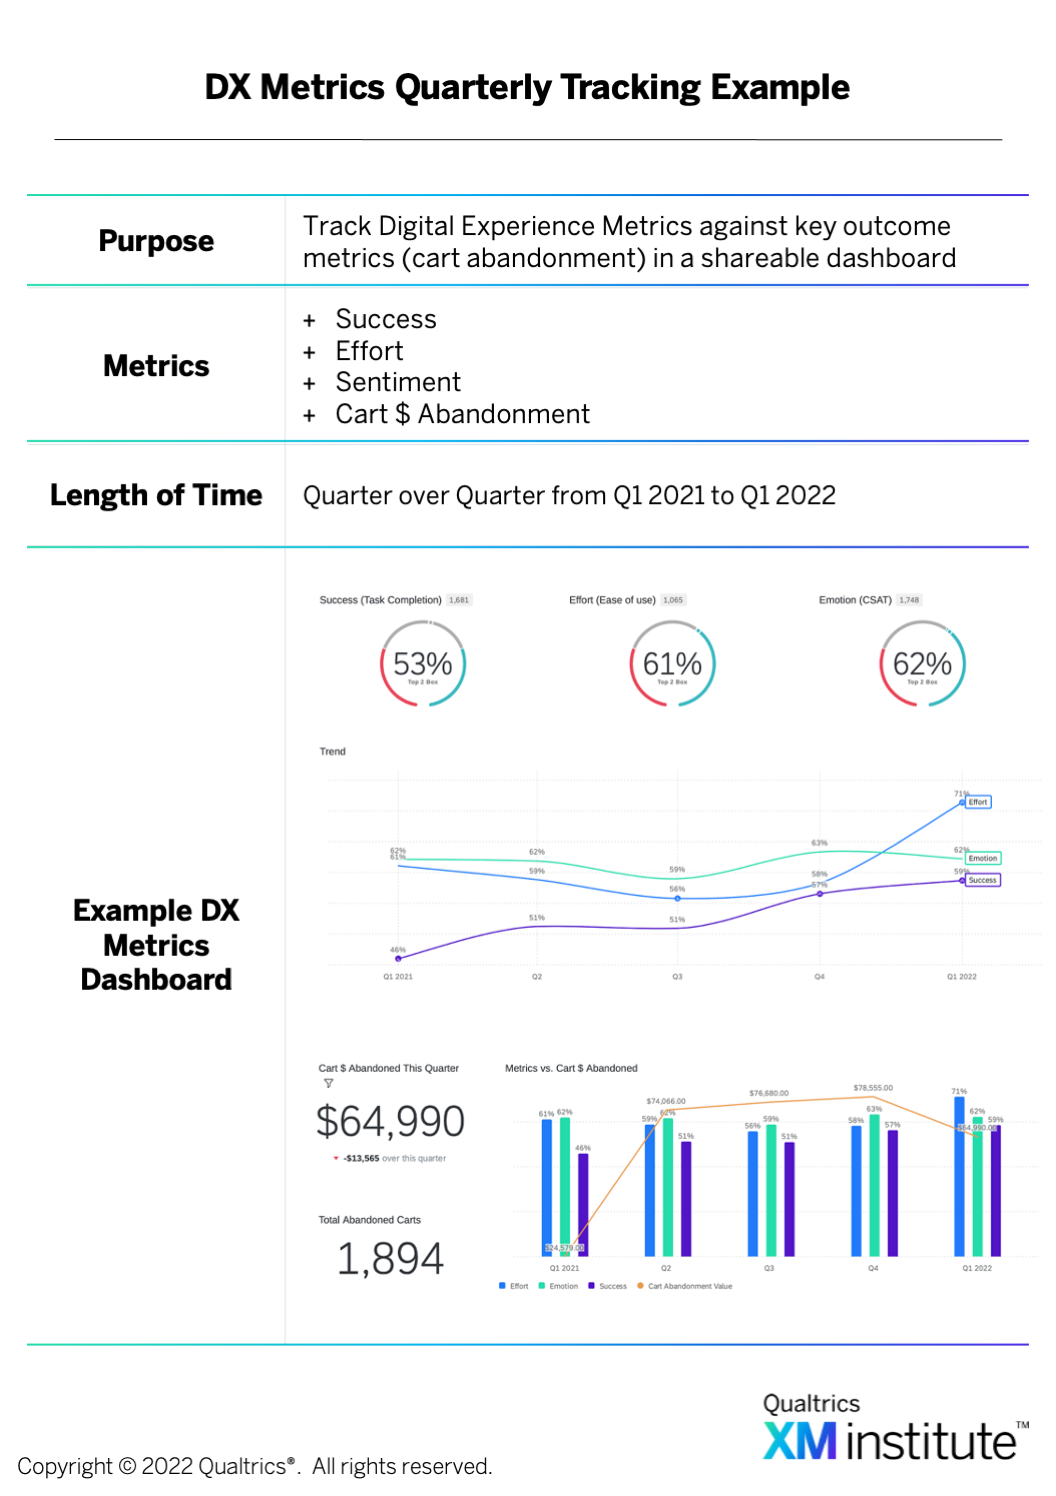 .
. - Tap into multiple sources of X-data. Compared to other interaction channels, digital provides a highly flexible and efficient medium for capturing experience data (X-data). Think about instrumenting your digital interactions using five of the key digital collection mechanisms7: 1) Active, Behavior-Based Listening Posts; 2) Passive, Always-on Listening Posts; 3) Embedded Feedback; 4) Cross-Channel Initiation; and 5) In-app Notifications.
- Integrate associated O-data. Digital channels generate a significant amount of operational data (O-data), which organizations should combine with X-data to develop more actionable and predictive insights 8. Common examples of this type of data include browsing behavior – such as page views, search terms, cart size, new/repeat visitors, and time spent on the site – as well as behaviors “behind the login,” like demographic data, annual spend, and employee organization.
- Create automated workflows. Insights are only as valuable as what you do with them to drive action and improvements to experiences. Establish a digital-specific closed-loop system by using integrations with applications like Slack, Jira, or Salesforce to share the visitor’s feedback out to the right people across the organization in a format that enables them to quickly respond to and take action on these insights.
- Humanize your digital experiences. Don’t just deploy your digital offerings as transactional channels, design them to create stimulating connections. How? By applying what XM Institute calls The Human Conversational Model8, which is made up of seven elements – Intent Decoding, Contextual Framing, Empathetic Agility, Supportive Feedback, Basic Manners, Self-Awareness, and Emotional Reflection.
- See XM Institute Data Snapshot ‘Global Study: Online Momentum Across 13 Activities’ (February 2022).
- See XM Institute Data Snapshot ‘Global Study: Online Momentum Across 24 Countries’ (February 2022).
- See XM Institute Data Snapshot ‘The State of CX Management, 2021’ (October 2021).
- See XM Institute Launchpad ‘The Fundamentals of Digital Experience Management.’
- See XM Institute tool ‘Digital CX Maturity: Assessment.’
- See XM Institute blog post ‘Tapping Into Five Types of Digital X-Data Collection Mechanisms’ (January 2021).
- See XM Institute Launchpad ‘Driving Insights with X- and O-Data.’
- See XM Institute report ‘Humanizing Digital Interactions’ (April 2017).


