Net Promoter® Score (NPS®) is one of the most popular customer experience (CX) metrics. When used appropriately and in the right environments, it can be extremely valuable in helping organizations propel their CX programs. But not all organizations use it correctly. We’ve found that when companies use the metric, they typically fall into one of these four stages of NPS maturity: 1) Survey & Report, 2) Ask & Respond, 3) Listen & Improve, and 4) Learn & Adapt.
The path towards reaching the mature stage of “Learn & Adapt” in NPS requires building a system for driving action based on insights. While the program design is critical, it’s not the only variable. There’s another dimension that must be considered: cultural variations across countries. This is an area that XM Institute explored in a recent global consumer study.
In the report, Calibrating NPS Across 18 Countries, we examine how consumers around the world respond to the NPS question. We asked people from 18 different countries two questions (using the standard NPS 11-point response scale)
- Think about the companies that you like, how likely would you be to recommend them to your friends and relatives?
- Think about the companies that you dislike, how likely would you be to recommend them to your friends and relatives?
Here’s the first figure in the report, which shows a summary of the results:
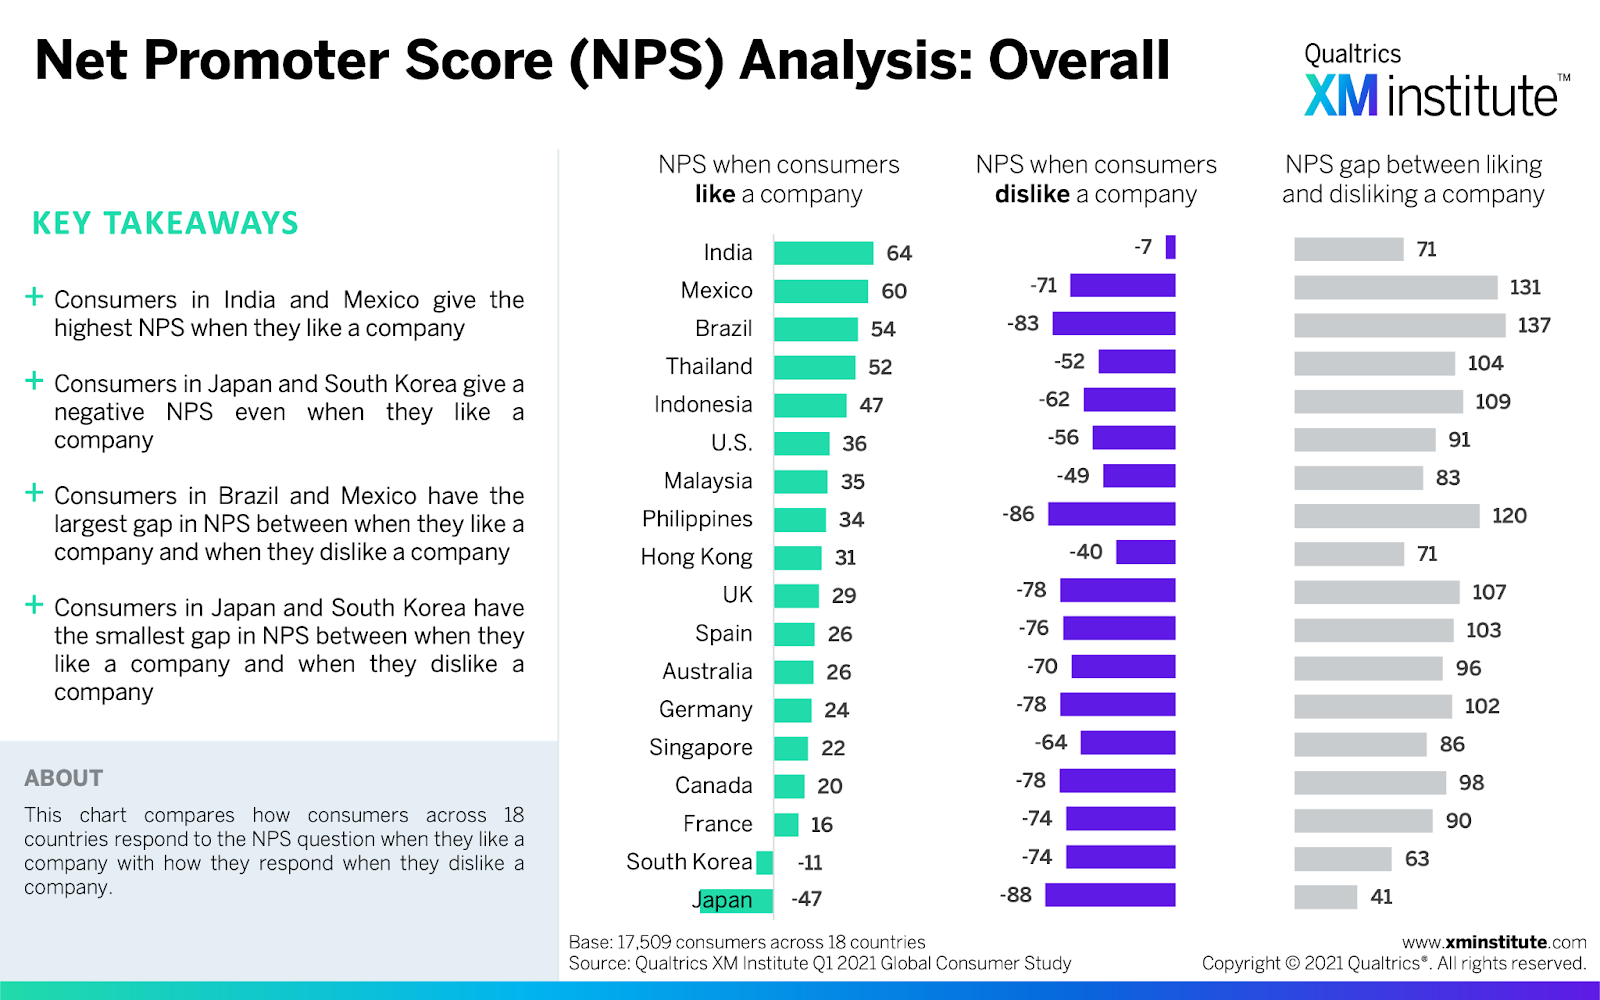
As you can see in the chart, there’s a wide range in NPS scores around the world. When Indian consumers like a company, their responses end up with a 64. On the other hand, Japanese consumers only give companies they like an NPS of -47. This spread can also be seen with companies that consumers dislike. Here are some of my observations:
- NPS is not the same around the world. This may seem the most obvious implication, but it has to be said. A company with a 50 NPS in India may have much less loyal customers than a company with a -20 NPS in Japan. So you can not treat the measurement in the same way across different countries.
- Individual countries need individual NPS goals. Given that NPS is measured differently across countries, it would not make sense to establish a single global NPS goal for all of them. Instead, you need to set goals based on the current competitive NPS in each marketplace in conjunction with the country-specific commitment to improvement.
- Detractors aren’t always disloyal. One of the reasons that the NPS scores are so different is that there’s a cultural difference in how consumers are responding to the question. In some countries, making recommendations is a more common activity than in others. Also, consumers have a different interpretation about what’s good and bad on the 11-point scale. So the NPS segmentation of responses do not represent the same level of loyalty around the world. In some countries, a “promoter” may be someone who responds with a six or higher, while in others it may be the people who select nine or 10.
- NPS is not a great metric for all countries. It doesn’t take much analysis to look at that chart and question the use of NPS in some countries. The metric has the most value when it can clearly distinguish happy, loyal customers from less loyal customers. I recommend that you stay away from NPS when the like/dislike spread (the grey bar chart on the right of the figure) is less than 80-points. So NPS may not be right for India, Hong Kong, South Korea, and Japan.
The bottom line: Don’t treat NPS the same way across countries.
Bruce Temkin, XMP, CCXP, is the Head of Qualtrics XM Institute
Note: Net Promoter, Net Promoter Score, and NPS are registered trademarks of Bain & Company, Inc., Fred Reichheld, and Satmetrix Systems, Inc.


