The 2023 XM Institute Trust Ratings
Qualtrics XM Institute publishes an annual trust rating across industries.1 Based on a review of our 2022 and 2023 results, we found that:
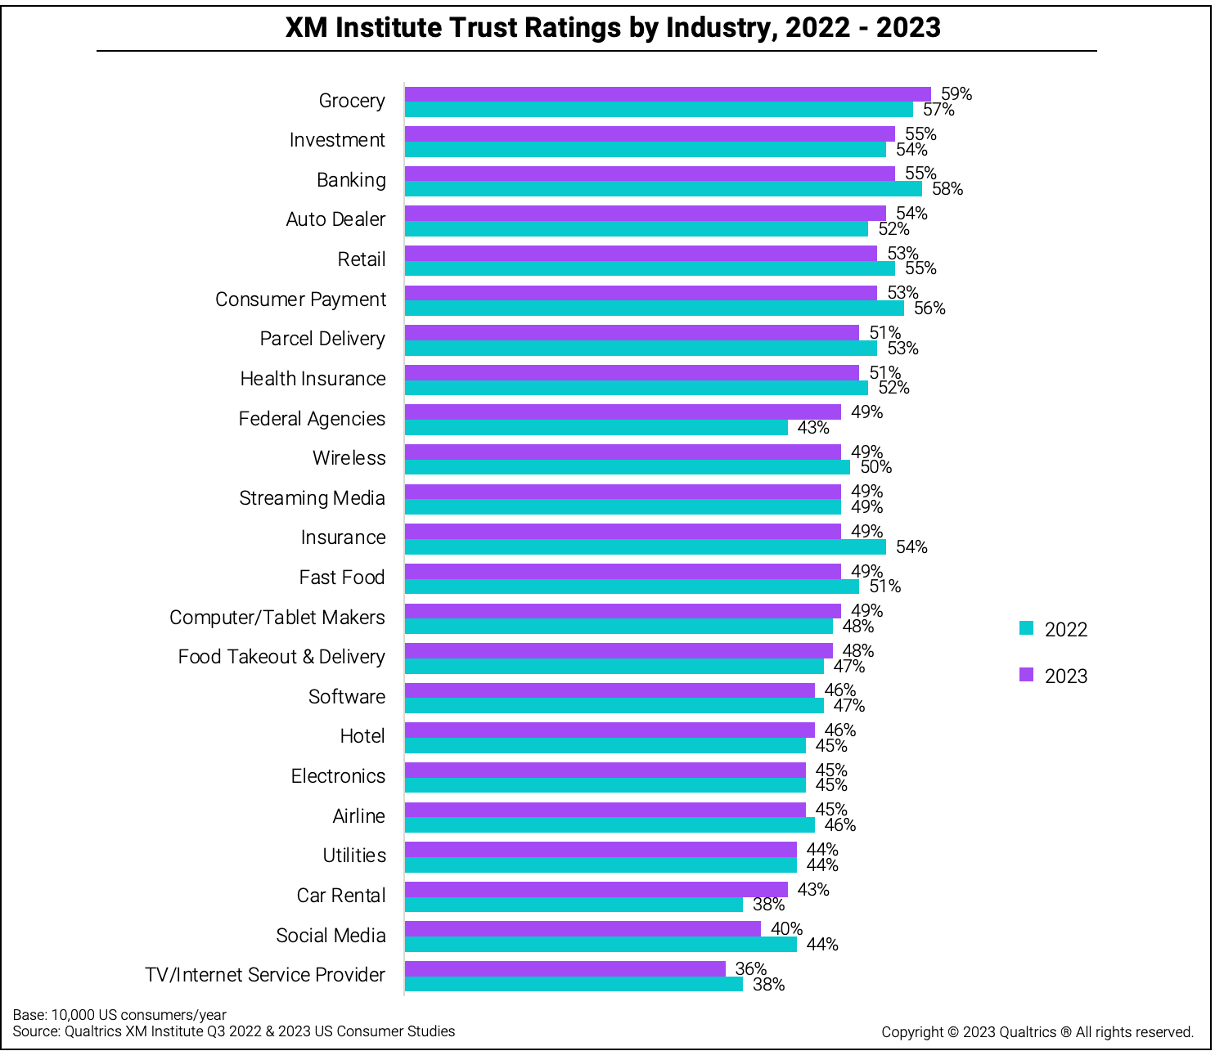
- Groceries are the most trusted. With a trust rating of 59% in 2023, groceries earned the highest score out of the 23 industries included in these studies. Seven other industries earned ratings above 50%: investment firms, banks, auto dealers, retailers, consumer payment providers, parcel delivery services, and health insurers.
- TV and internet service providers are the least trusted. Only one industry earned a trust rating below 40%: TV/Internet service providers (36%). The next lowest industries were social media companies (40%) and car rental agencies (43%).
- The federal government improved the most over the last year. Only eight of the 23 industries earned a higher trust score in 2023 than they did in 2022, and of those, only federal agencies (+6 pp) and car rental agencies (+5 pp) improved by five or more percentage points.
- Insurance dropped the most from last year. Over half of the industries saw their trust ratings drop in 2023. Insurers (-5 pp) and social media companies (-4 pp) experienced the most significant declines.
Trust Variations by Age
We also looked at how trust levels vary across different age groups. Our analysis reveals that:
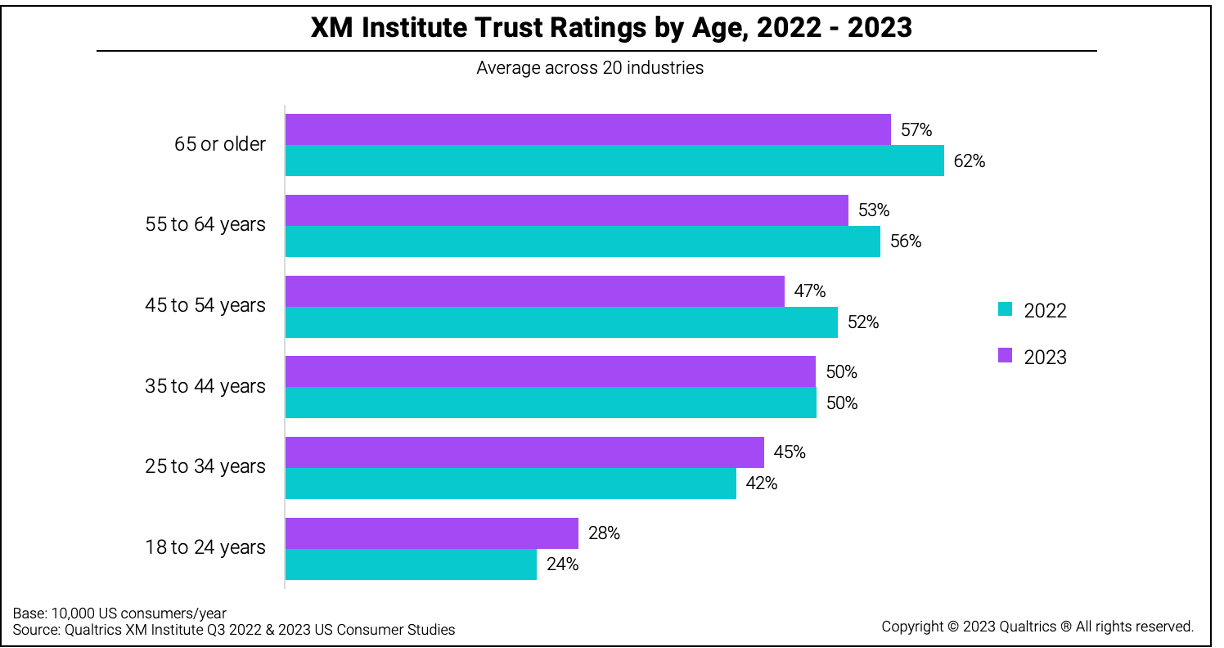
- Trust increases with age. The average trust rating across industries was lowest with 18- to 24-year-olds (28%) and highest with consumers who are 65 and older (57%). Except for a small dip in the 45-to-54 cohort, trust levels increased with every age group.
- Investment firms have the largest generational trust gap. On average, the youngest group’s trust ratings fell 27 percentage points below the oldest group’s ratings in 2023. This gap between older and younger consumers is largest with investment firms (46 pp) and utilities (42 pp). Only three industries have a trust generation gap smaller than 20 percentage points: social media companies (6 pp), streaming media companies (13 pp), and TV/Internet service providers (15 pp).
- Older people have lost trust. In 2023, all age groups older than 35 gave organizations lower trust ratings than they did in 2022.
- Younger people have gained trust. Consumers below the age of 35 report feeling higher levels of trust in 2023 compared to 2022.
Changes in Trust Between 2012 and 2023
To get a sense of how trust levels have evolved over a longer period, we examined our historical trust ratings, which include Temkin Trust Ratings prior to 2019.2 Over the years, we’ve adjusted the industries included in our studies, so we only focused on the 17 industries consistently represented in the ratings between 2012 and 2023. Our analysis across 12 years shows that:
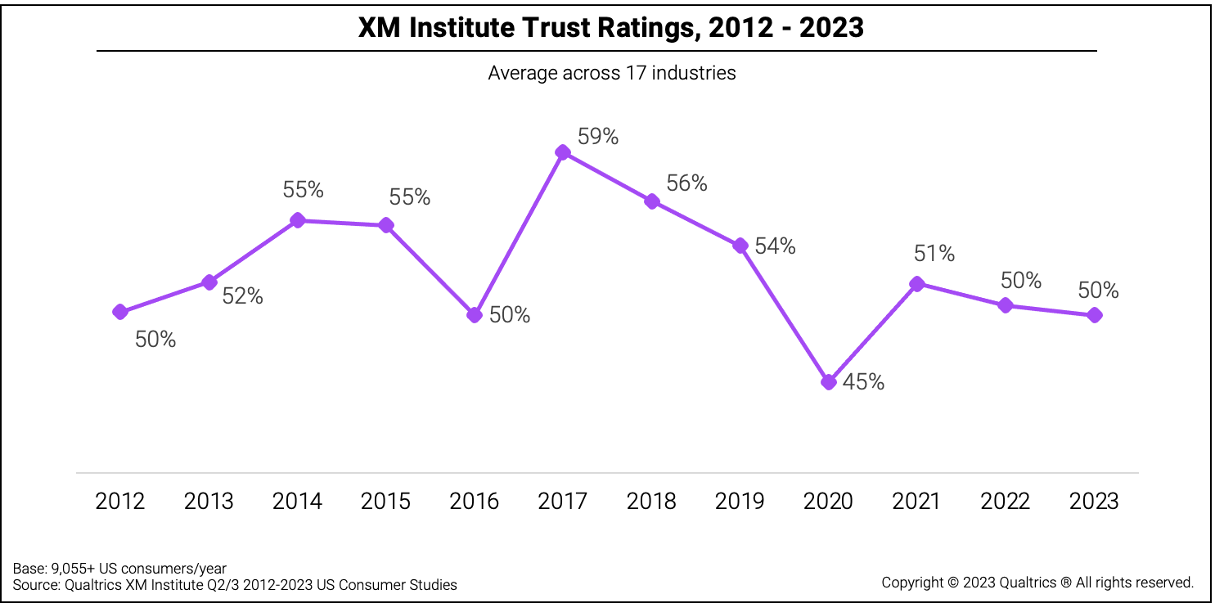
- Trust has no long-term trend line. The trust ratings do not appear to demonstrate any specific pattern of increasing or decreasing. Rather they appear to hover around the average of 52% and seem to be most influenced by macro-level societal changes in the environment.
- Trust dropped sharply in 2016. After increasing between 2012 and 2015, the average trust rating dropped 5 percentage points in 2016. Likely the contentious political environment played some role in these more negative consumer attitudes.
- Trust reached its highest mark in 2017. With a leap of 9 percentage points, the trust ratings made the largest single-year increase between 2016 and 2017, hitting an all-time high of 59%. After that peak, the ratings declined over the next four years.
- Trust collapsed in 2020. In 2020, as the COVID pandemic emerged, the trust ratings dropped by 9 percentage points, the largest single-year decline. The average fell to 45%, its lowest level across the 12 years.
- Trust partially recovered in 2021. In 2021, the trust ratings climbed 6 percentage points, reaching 51%. It has meandered near that level over the previous two years.
Industry Trust Trends Over 13 Years
When we examined how trust levels changed for the 17 industries between 2012 and 2023, we found that:
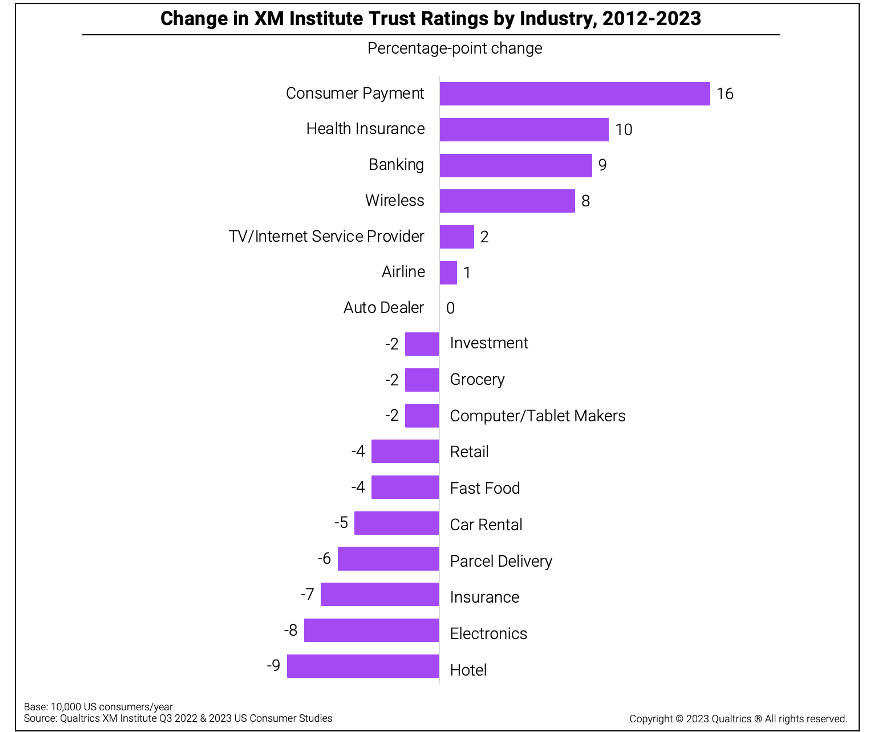
- Trust declined across most industries. Ten of the 17 industries have lower trust levels in 2023 than they had in 2012, while only six have increased their trust scores.
- Consumer payments gained the most trust. Consumer finance has improved its trust levels the most over the previous 12 years, with payments earning the largest increase of any industry (16 pp) and banking earning the third largest (9 pp). Health insurers and wireless carriers also saw their trust levels improve significantly over that time.
- Hotels lost the most trust. Consumers lost the most trust in hotels, as their ratings dropped 9 percentage points over the 12 years. Trust in insurers and electronics makers has also eroded since 2012.
The bottom line: Maintaining high levels of trust is not easy.
Bruce Temkin, CCXP, XMP, is Head of Qualtrics XM Institute
Isabelle Zdatny, CCXP, XMP, is the Head of Thought Leadership for Qualtrics XM Institute
Talia Quaadgras is a Research Program Manager with Qualtrics XM Institute
- Trust question: How likely are you to TRUST that this company will take care of your needs? Scale: 1 = Extremely unlikely through 7 = Extremely likely. Trust rating = (%6s + %7s) – (%1s + % 2s + %3s) for each organization (AKA: T2 – B3 box). Industry scores are an average of individual organizations’ trust ratings in that industry.
- Trust ratings come from an online survey of US consumers with demographic quotas set to represent the US population for age, gender, income, and ethnicity. Respondents provided feedback on organizations they had interacted with in the last 90 days.


