Key Findings
As part of Qualtrics XM Institute’s Q1 2024 Experience Management (XM) Professionals Study, we asked hundreds XM professionals about their planned XM investments, 2024 employee and customer experience priorities, and expected future usage of XM technologies. From our analysis, we found that:
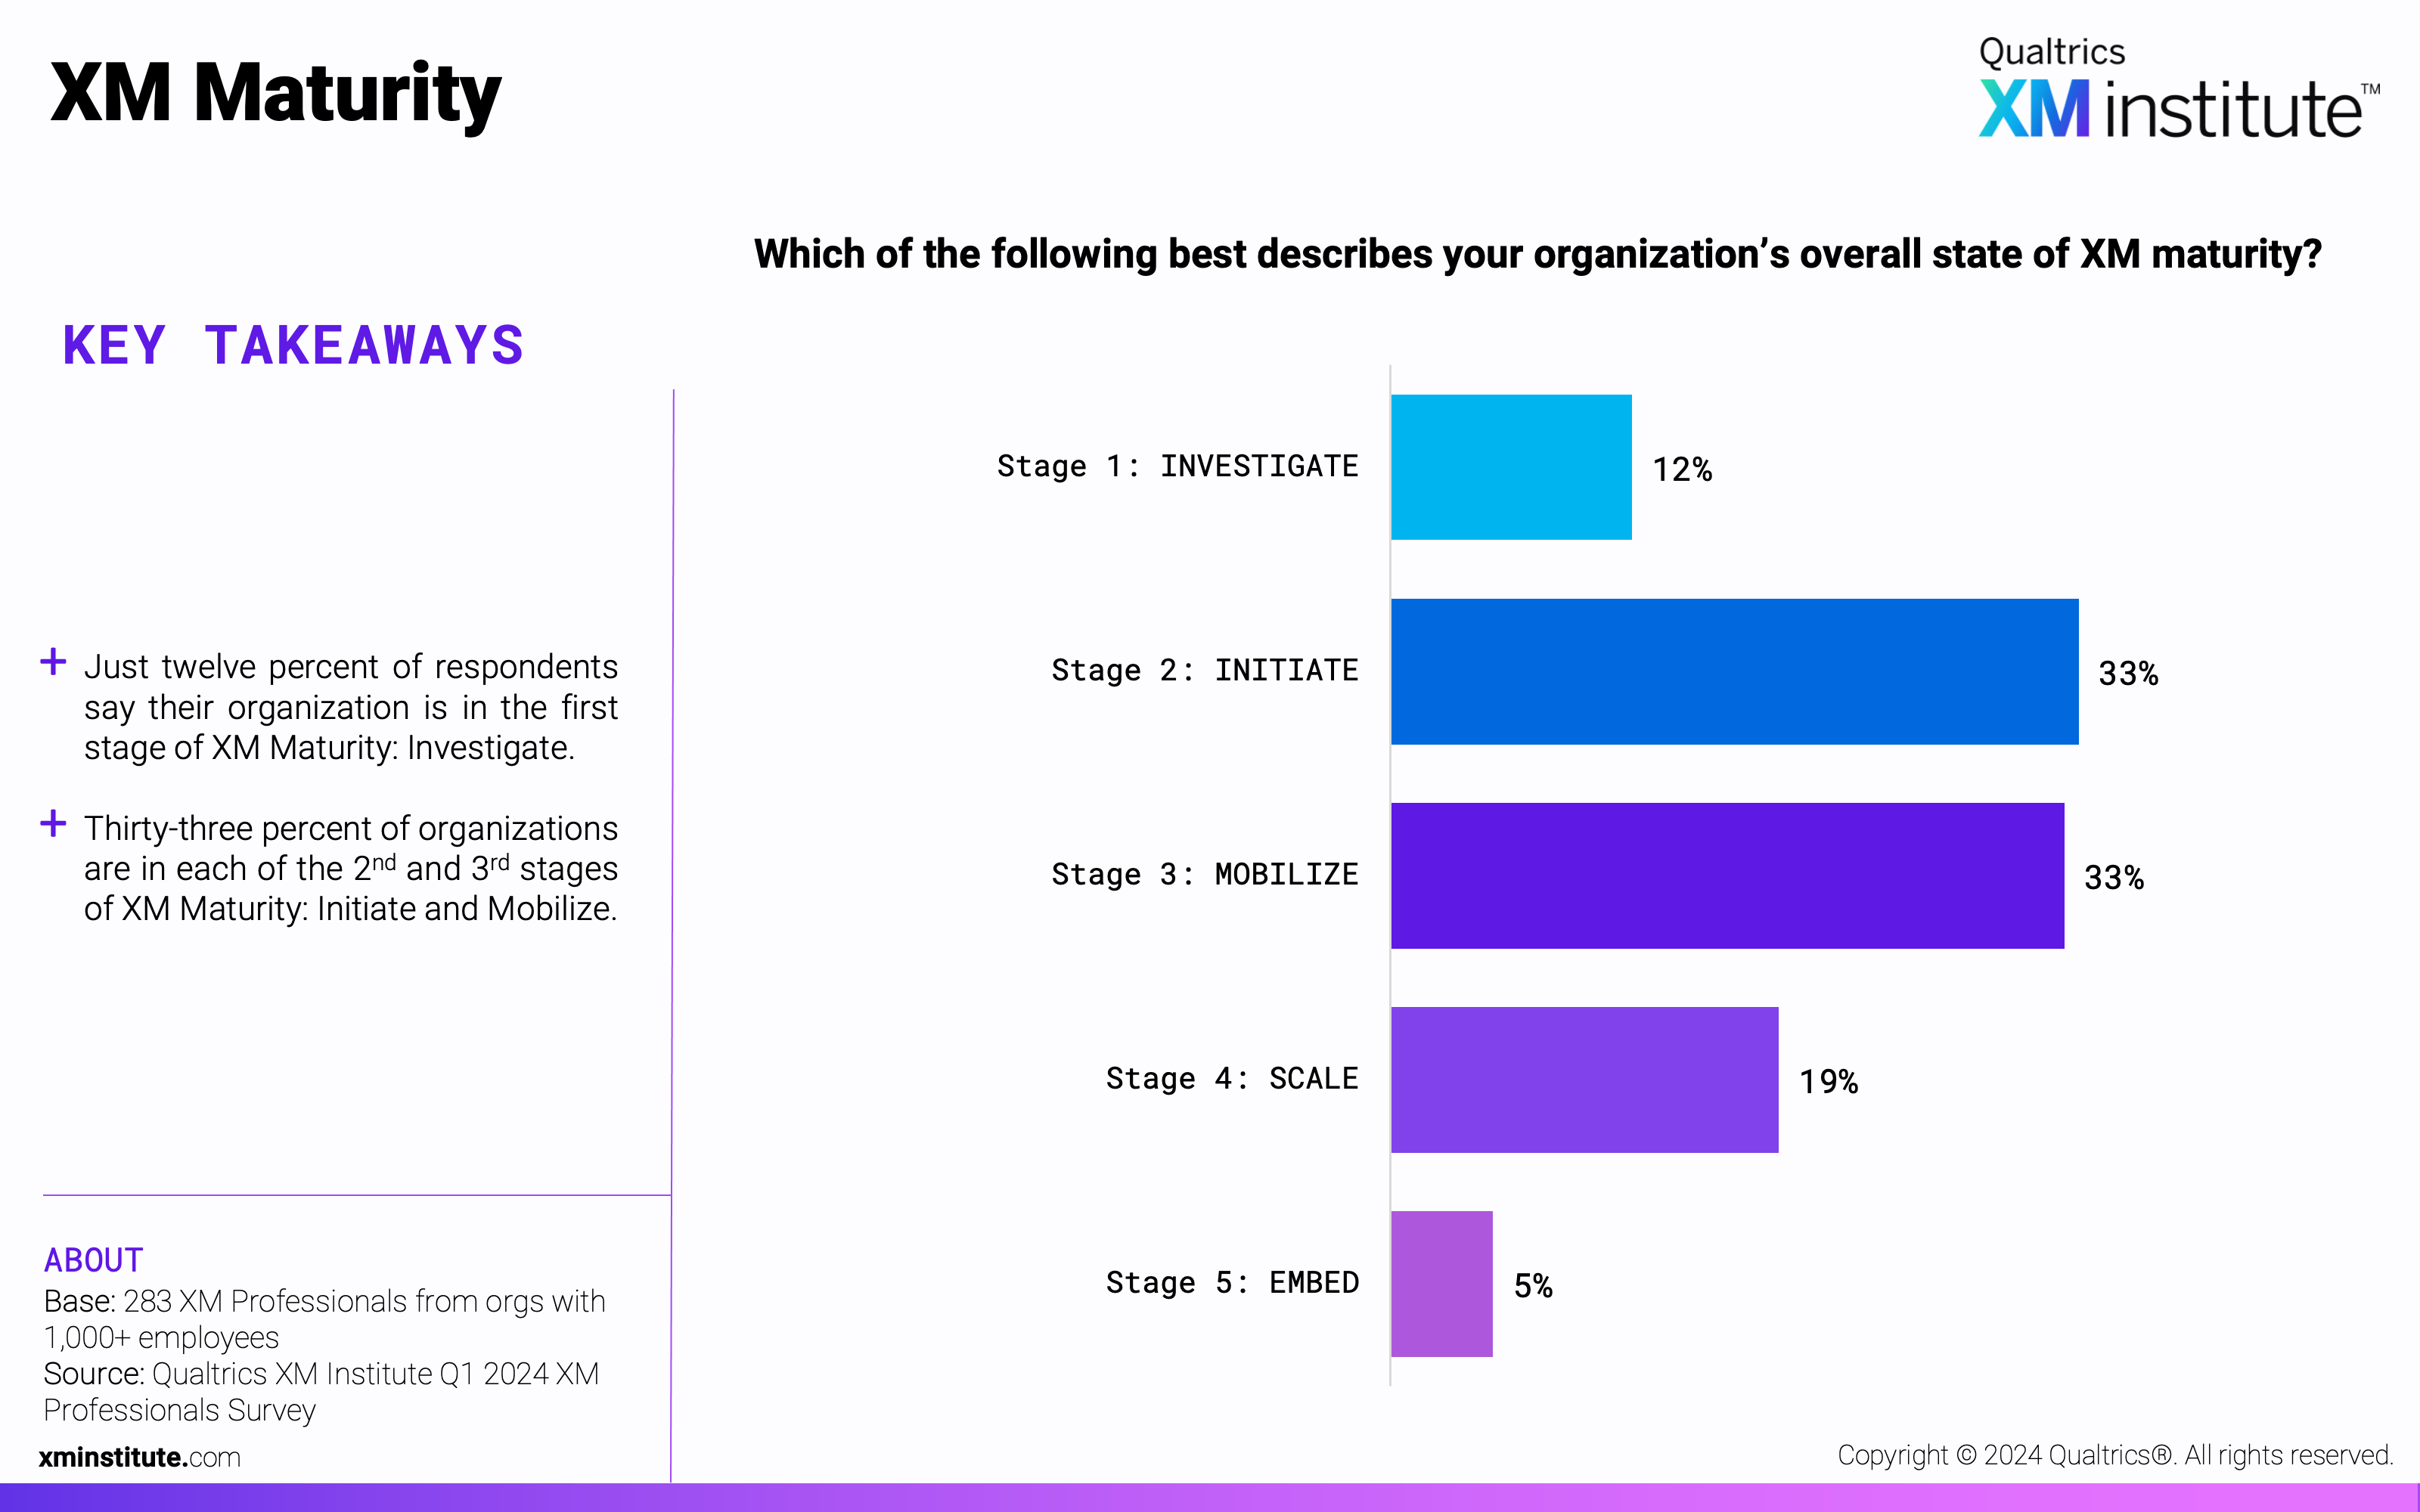
- Two-thirds of organizations are in the second or third stage of XM maturity. Two-thirds of practitioners described their organization’s state of XM Maturity as either Stage 2: Investigate, or Stage 3: Mobilize, at 33% each. Twelve percent say their organization is in the first stage of maturity (Investigate), while 5% have achieved the fifth stage: Embed.
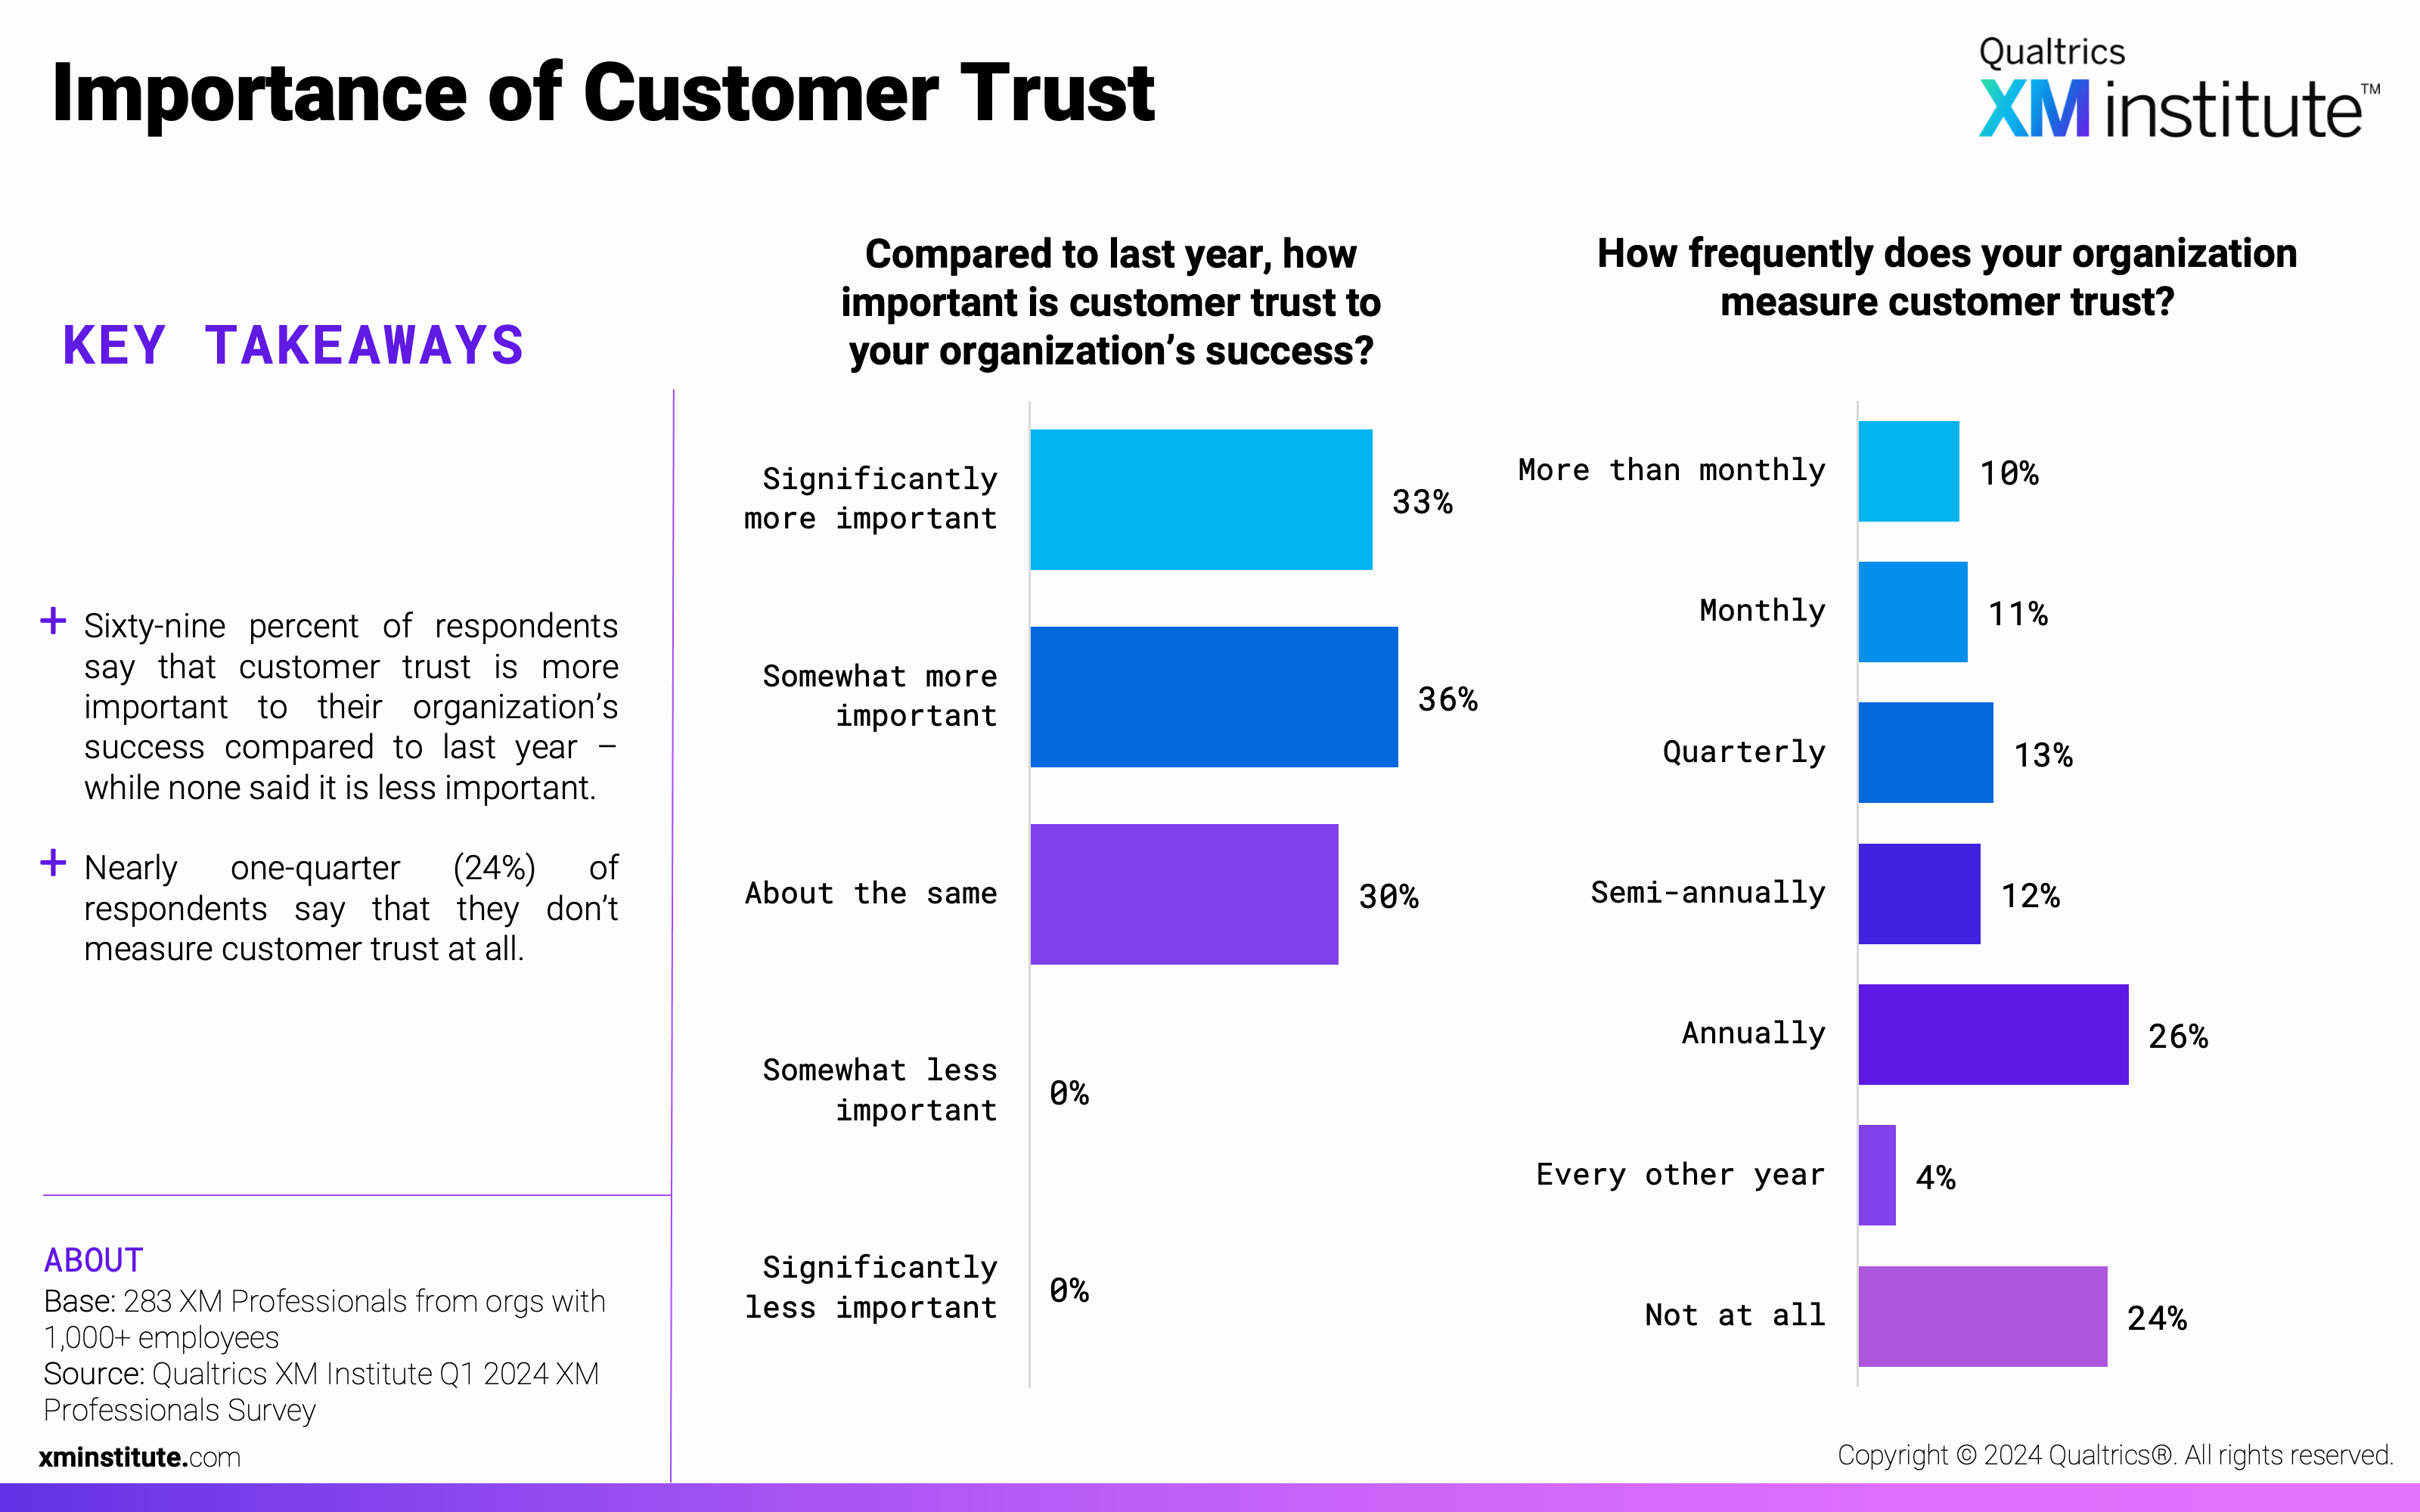
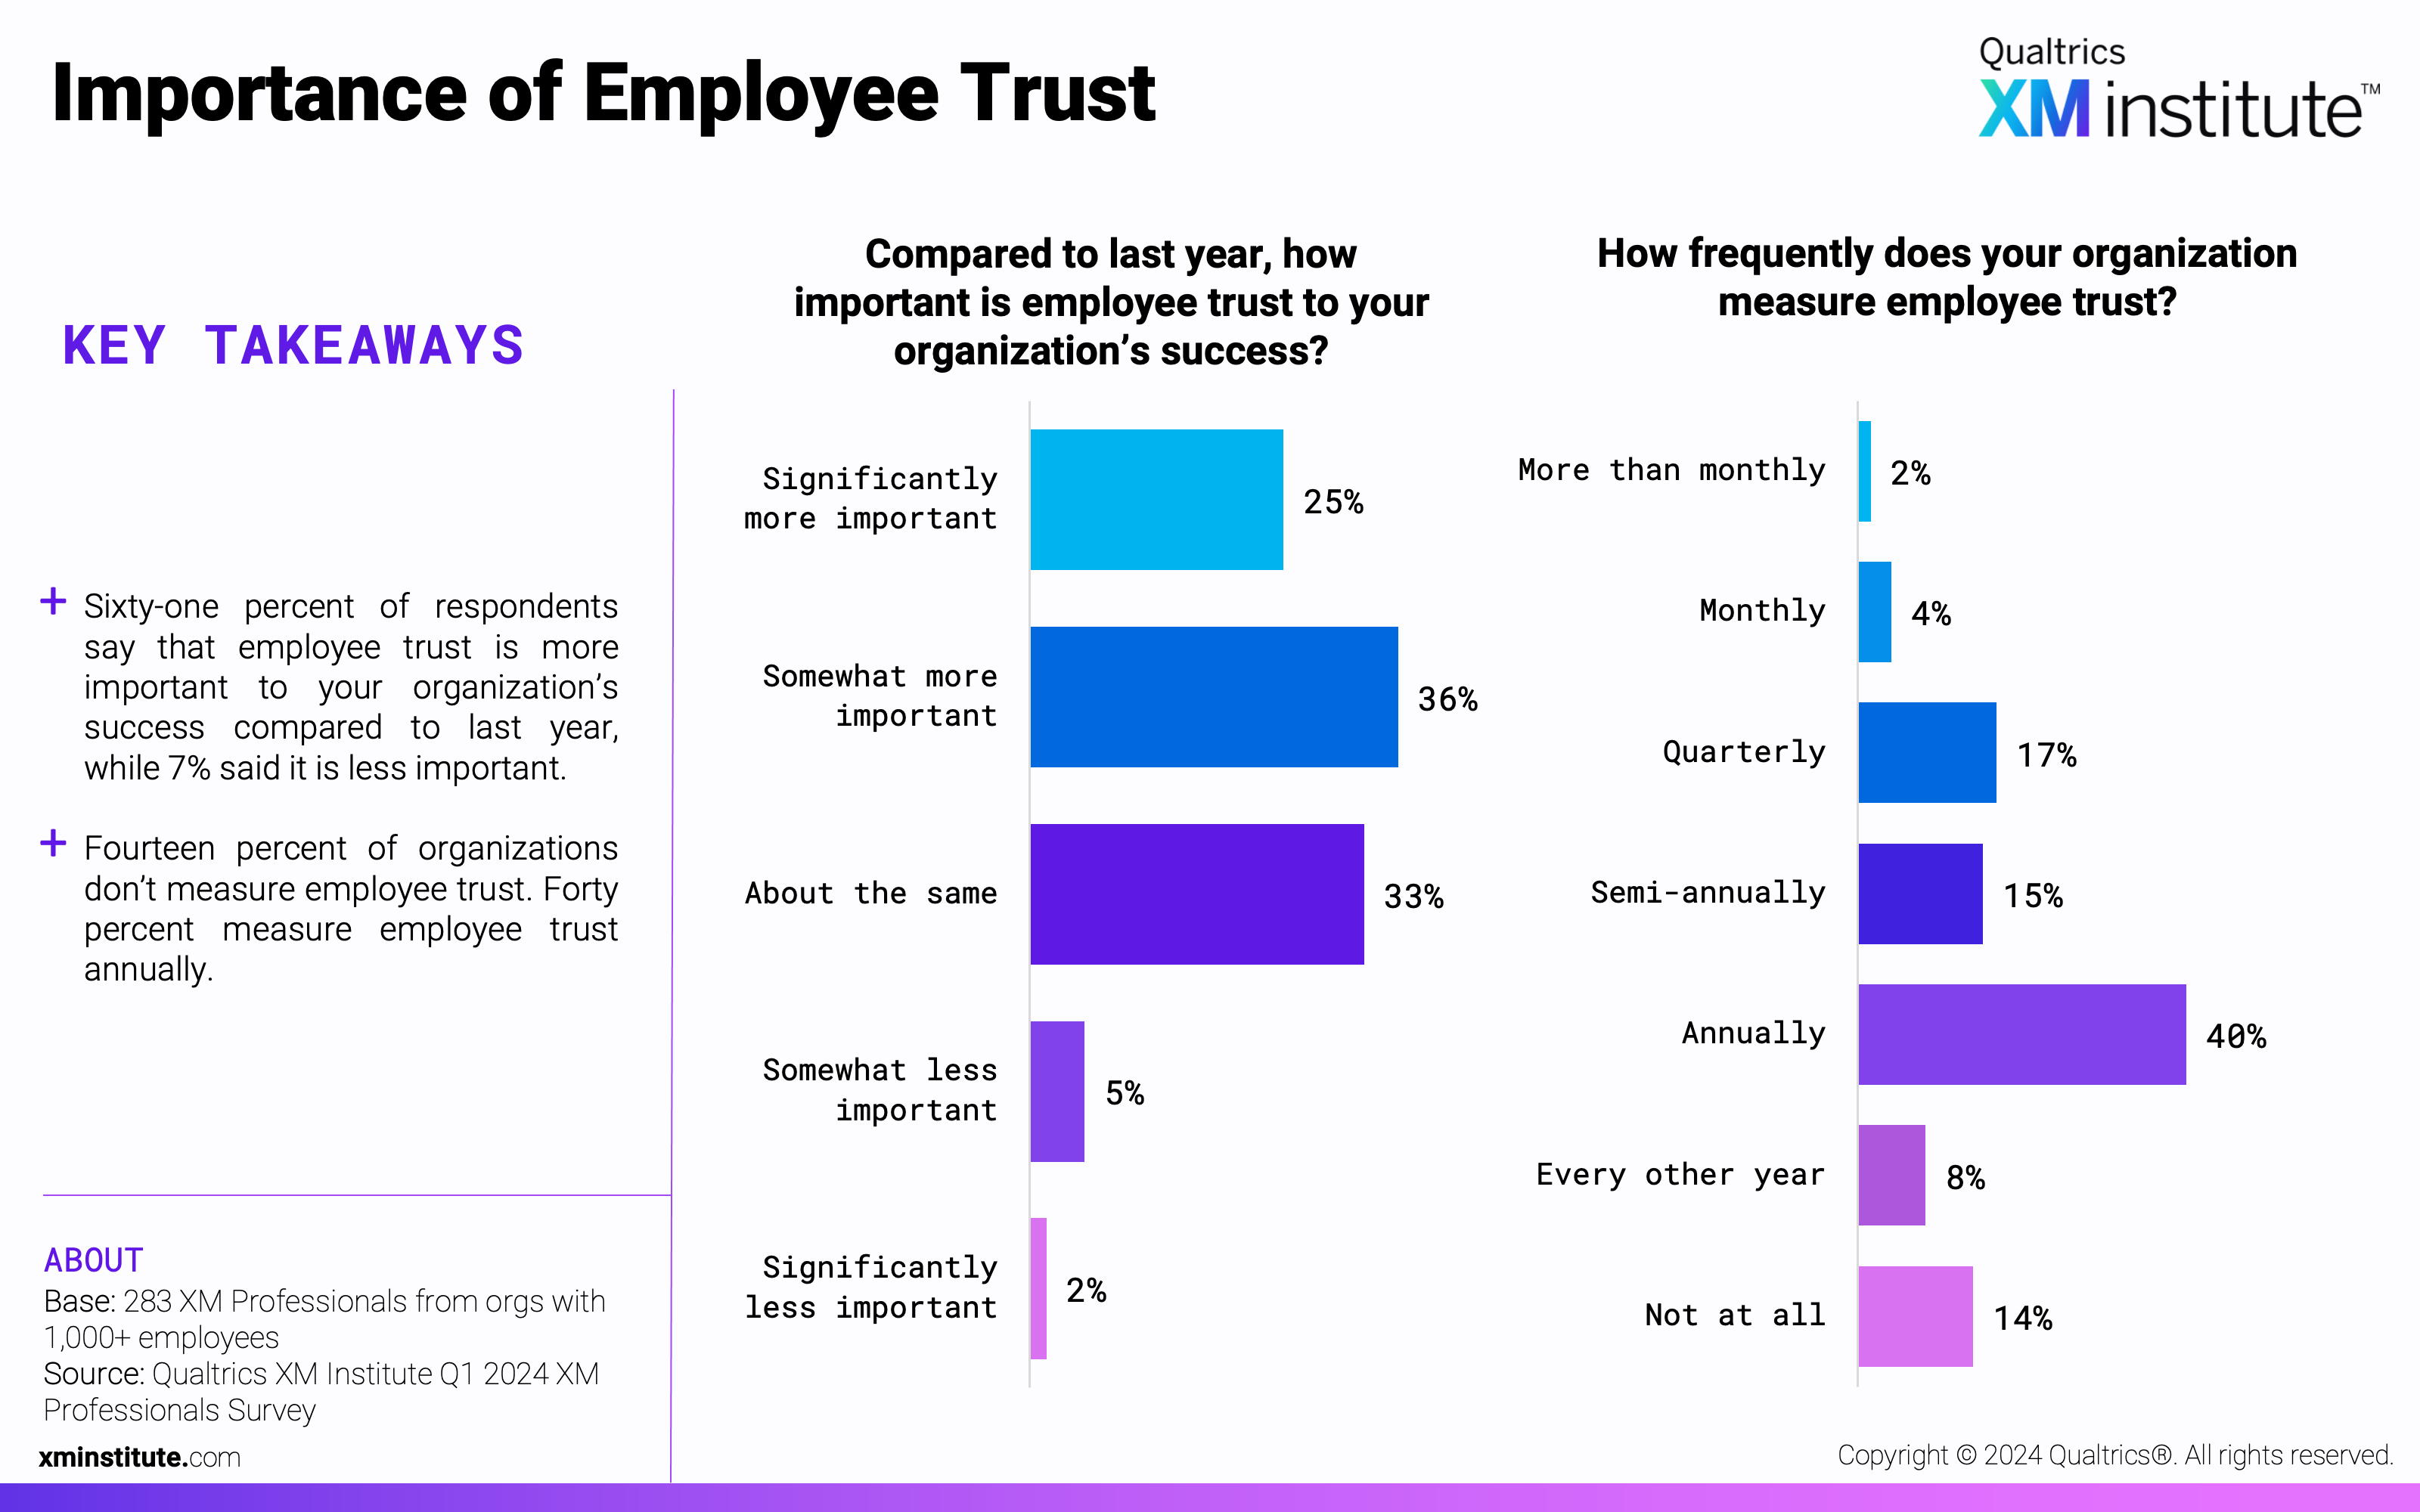
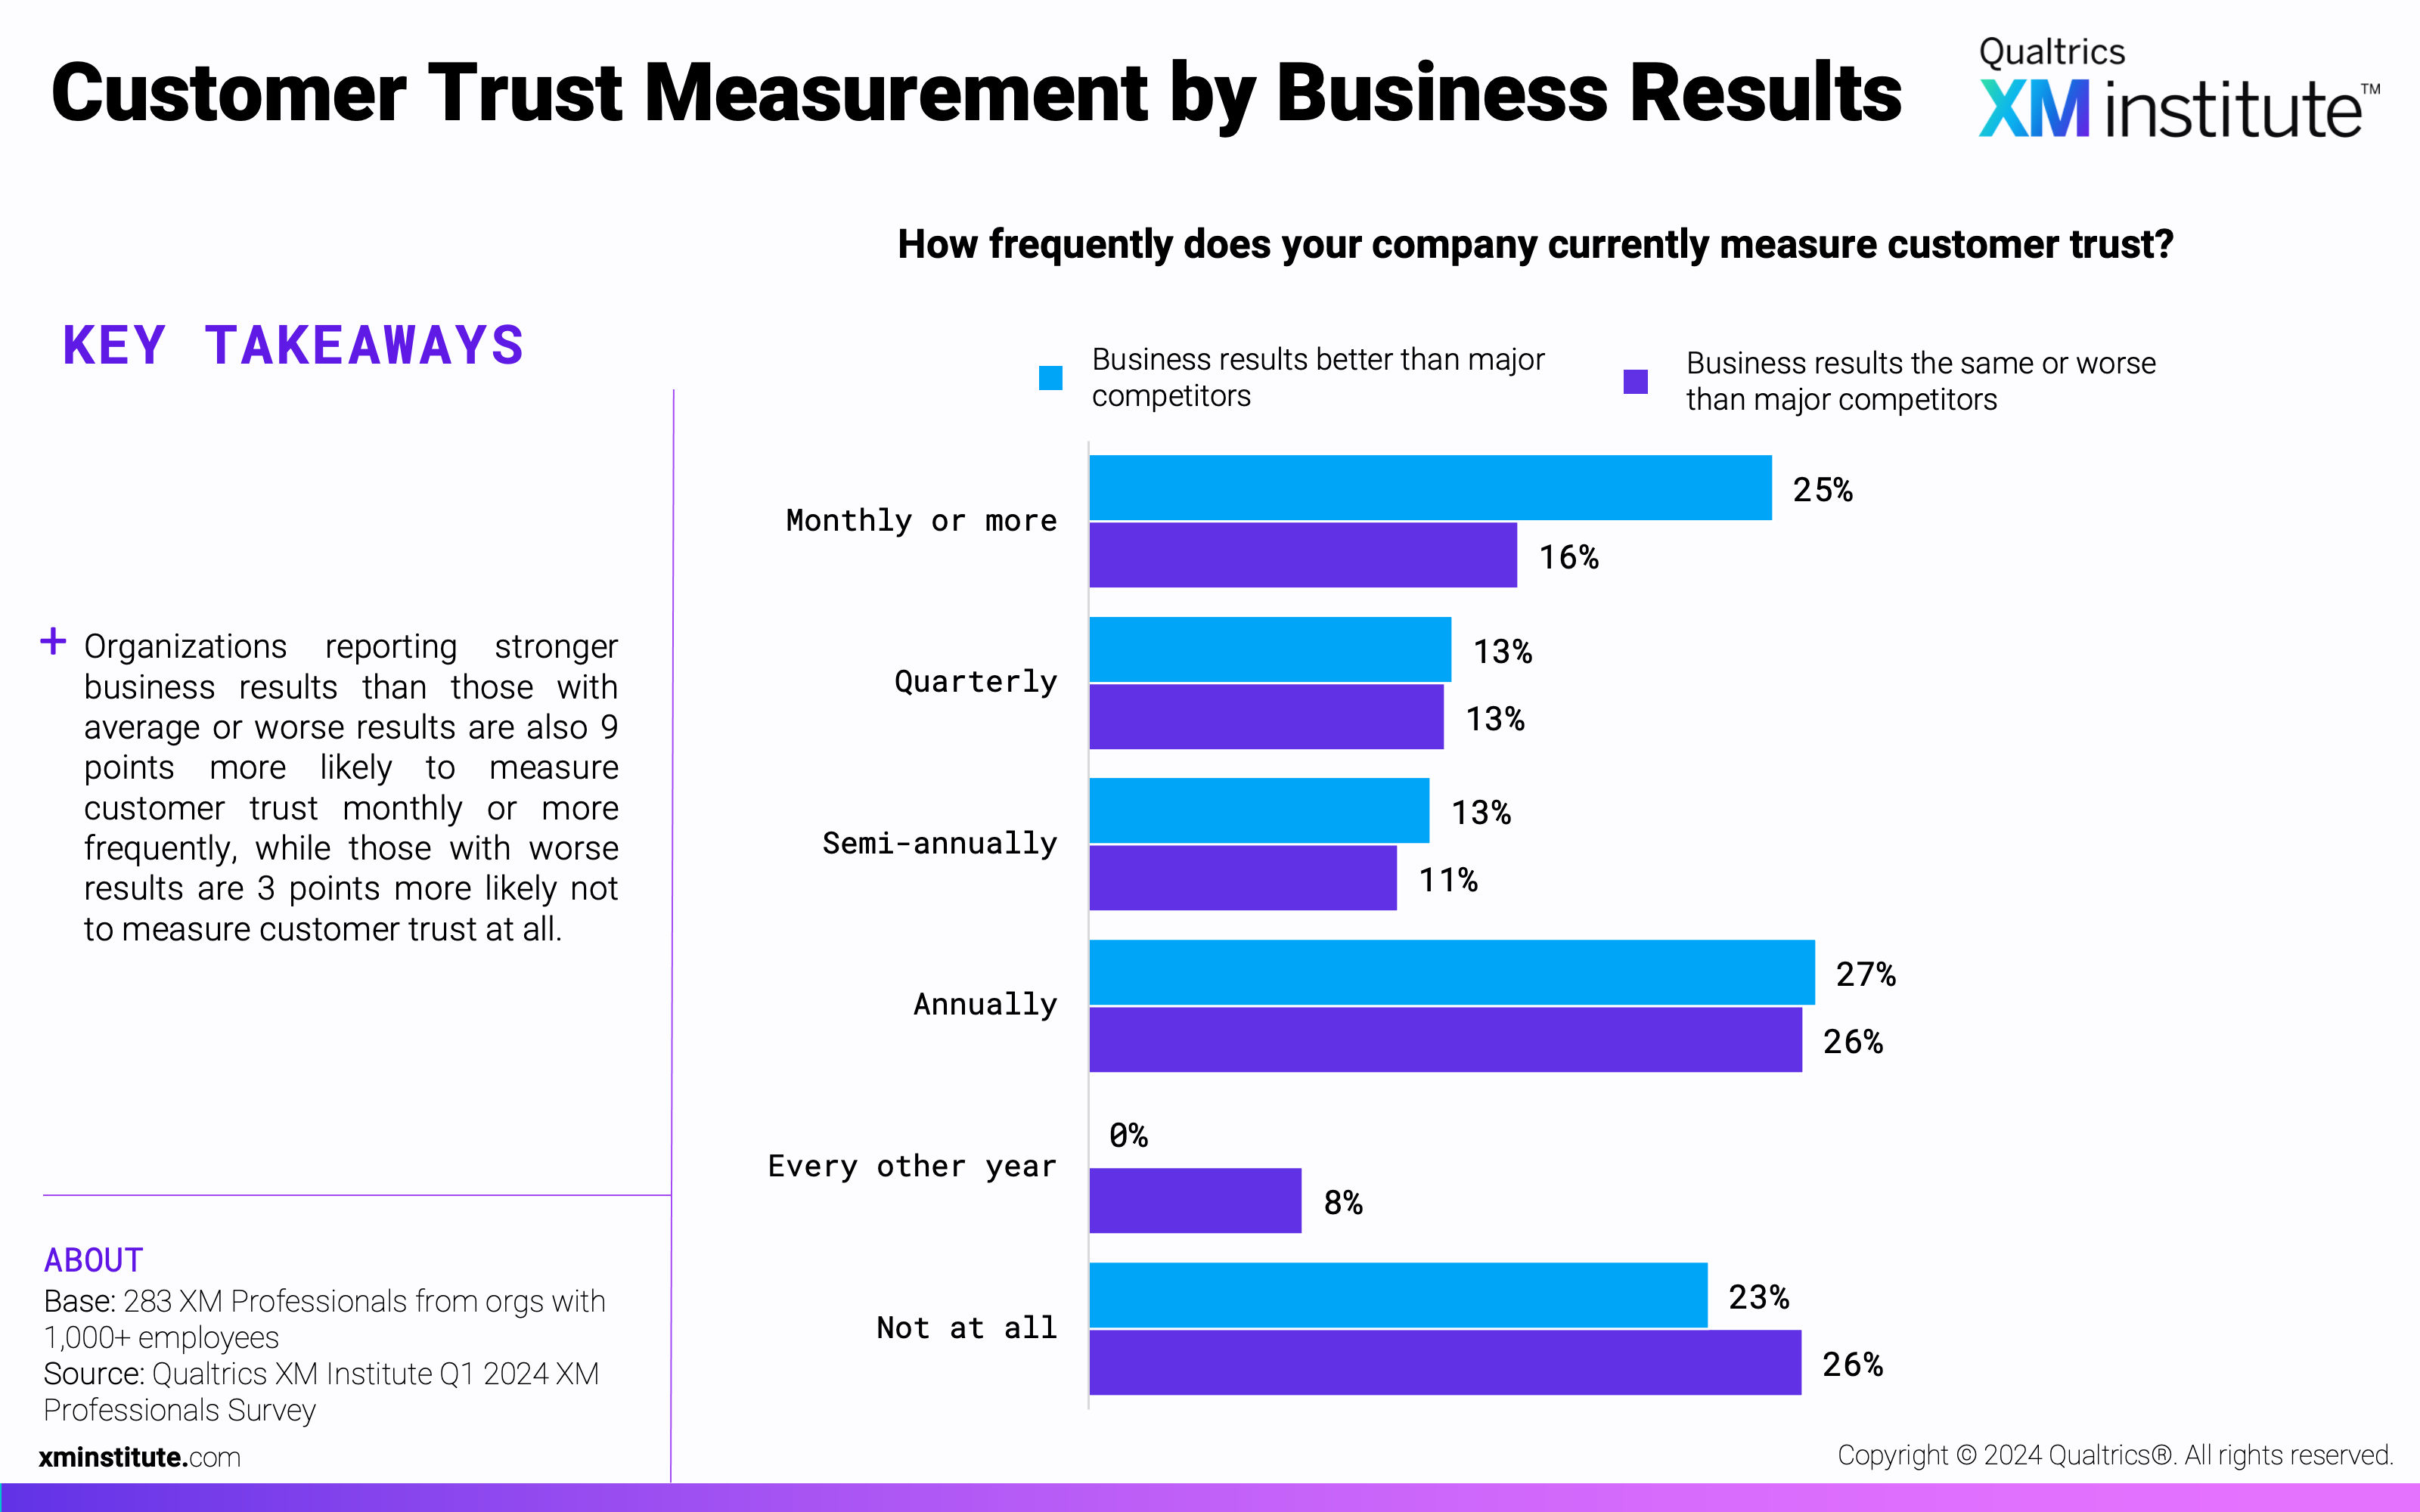
- Trust is growing in importance, but many organizations still don’t measure it. Sixty-nine percent of respondents said that customer trust will be more important to their organization’s success this year compared to last year, while 61% said the same about employee trust. Despite this increasing importance, only 21% measure customer trust monthly or more, while 24% don’t measure it at all.
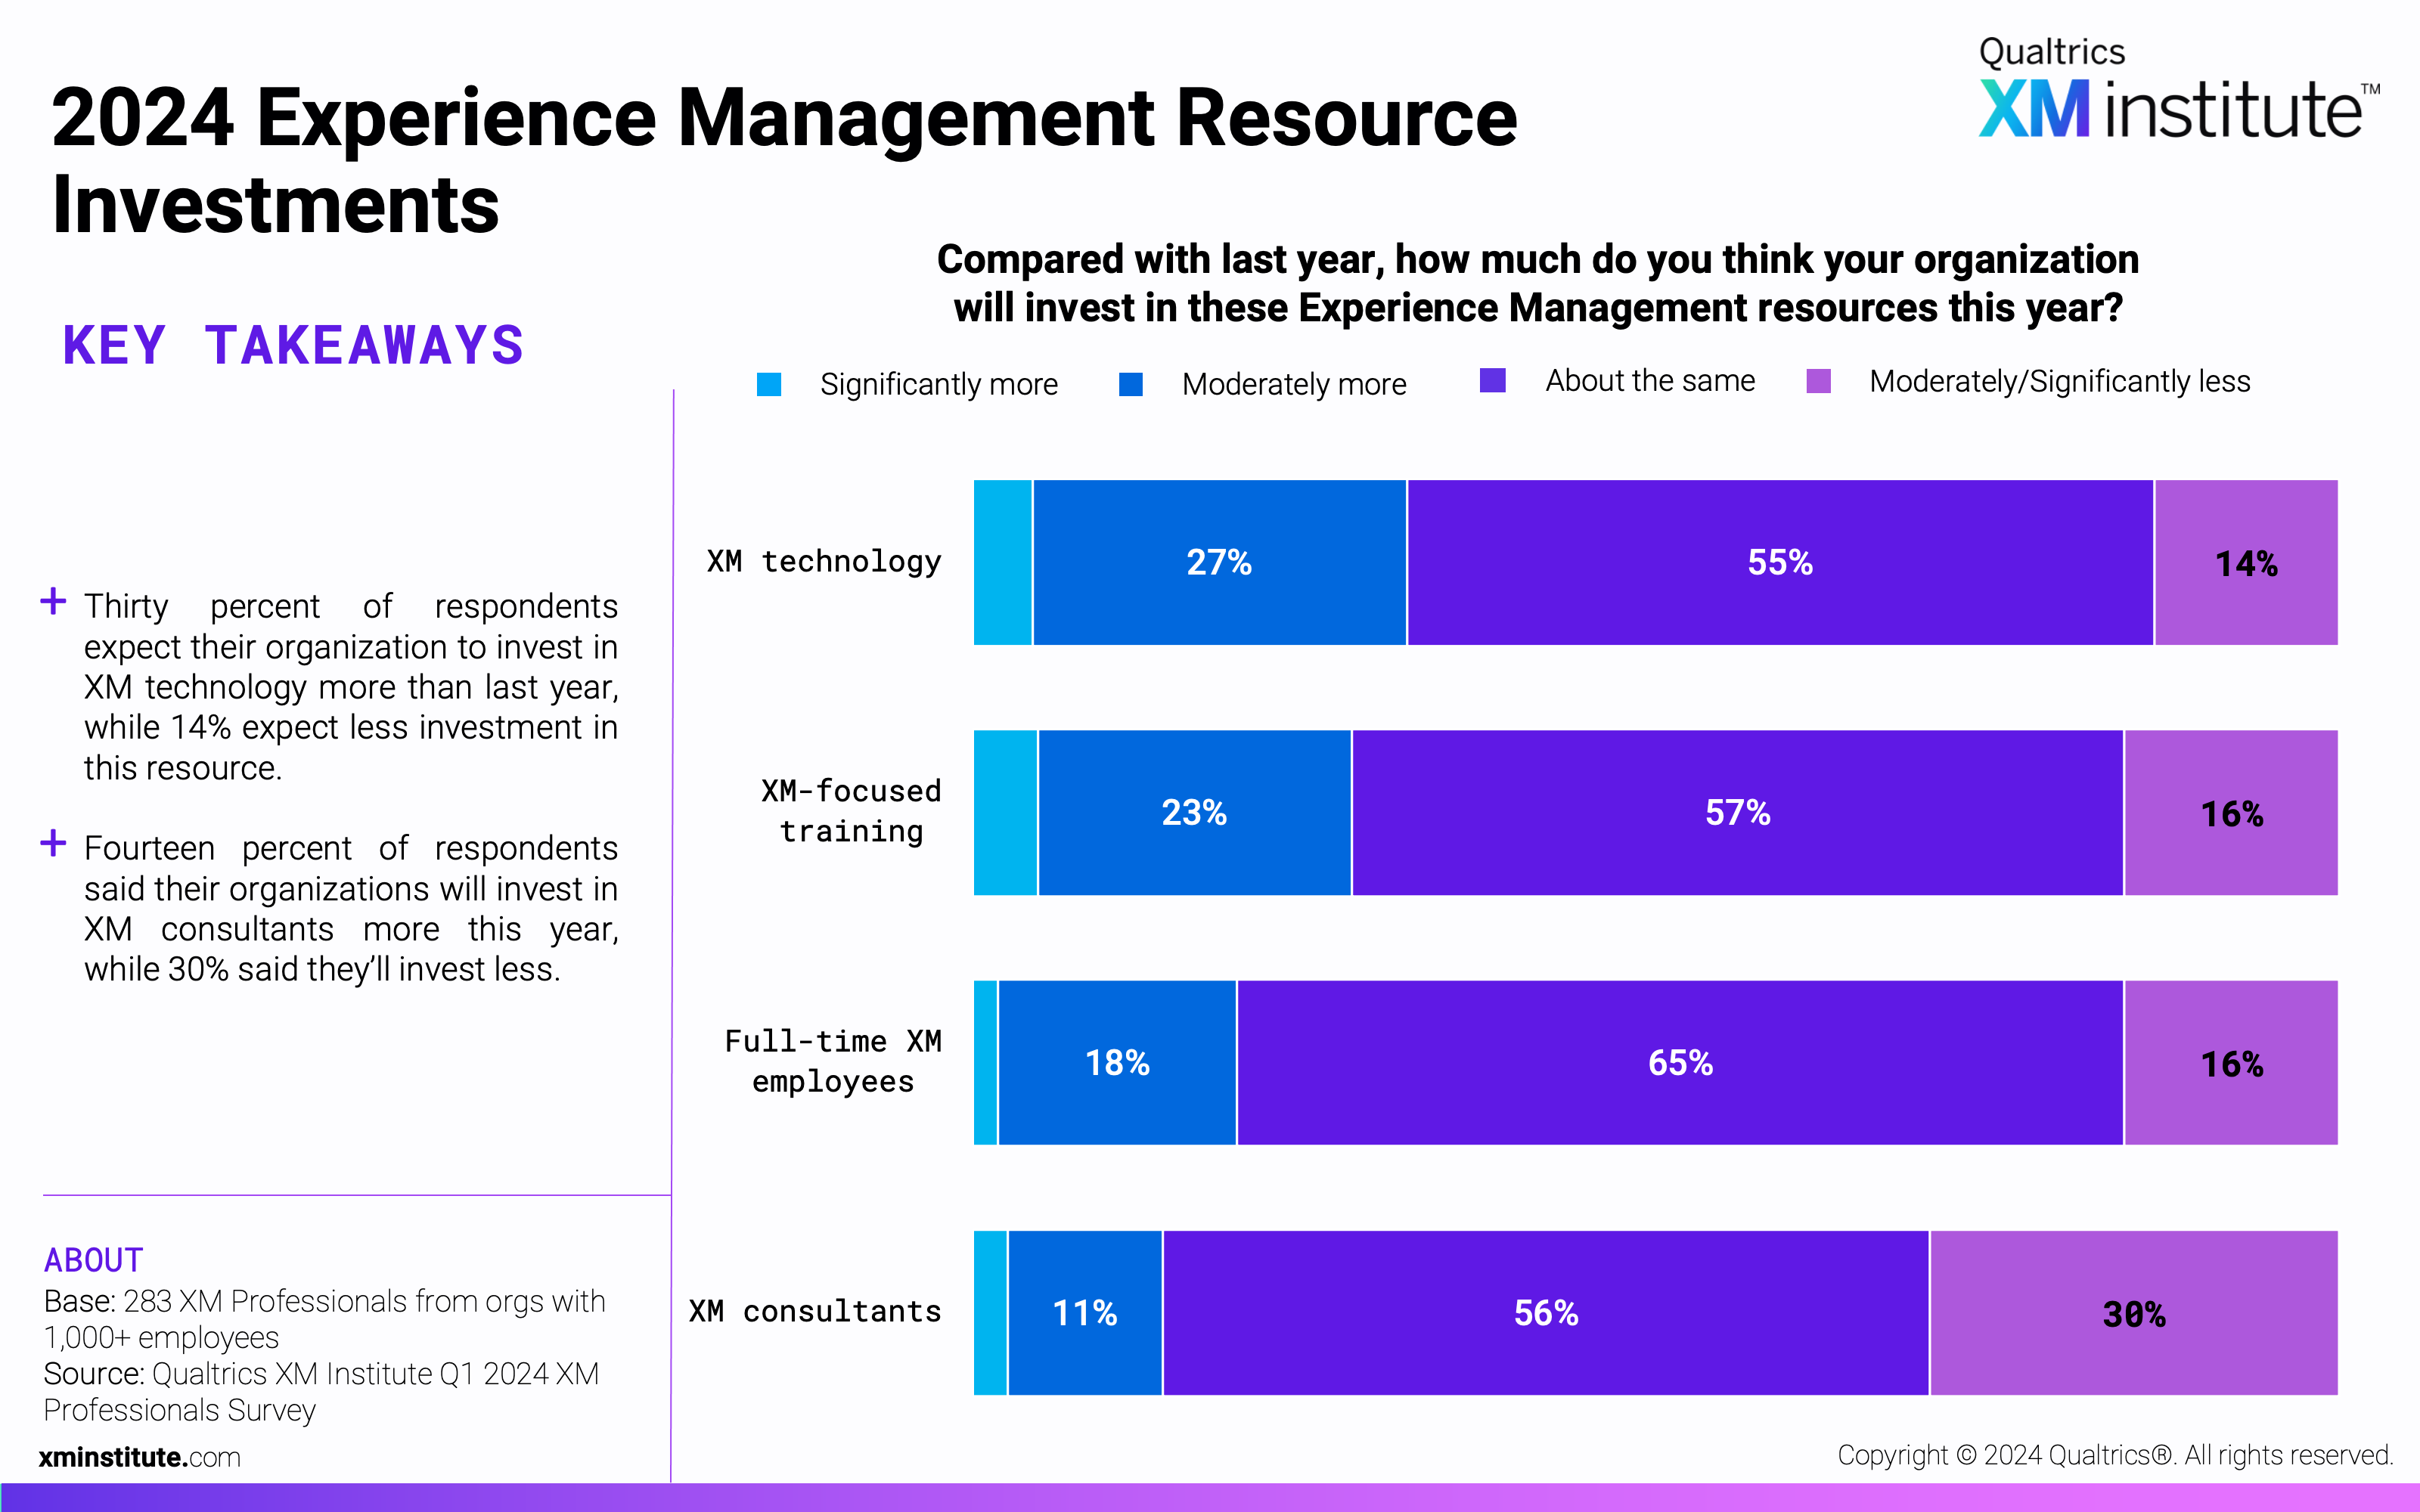
- Organizations are investing more in XM technology and less in XM consultants. Compared to last year, 30% of XM professionals expect their organization to invest more in XM technology, while 14% expect to invest less. XM consultants may expect a decrease in work this year, with 30% of organizations spending less on this resource and just 14% expecting to spend more.
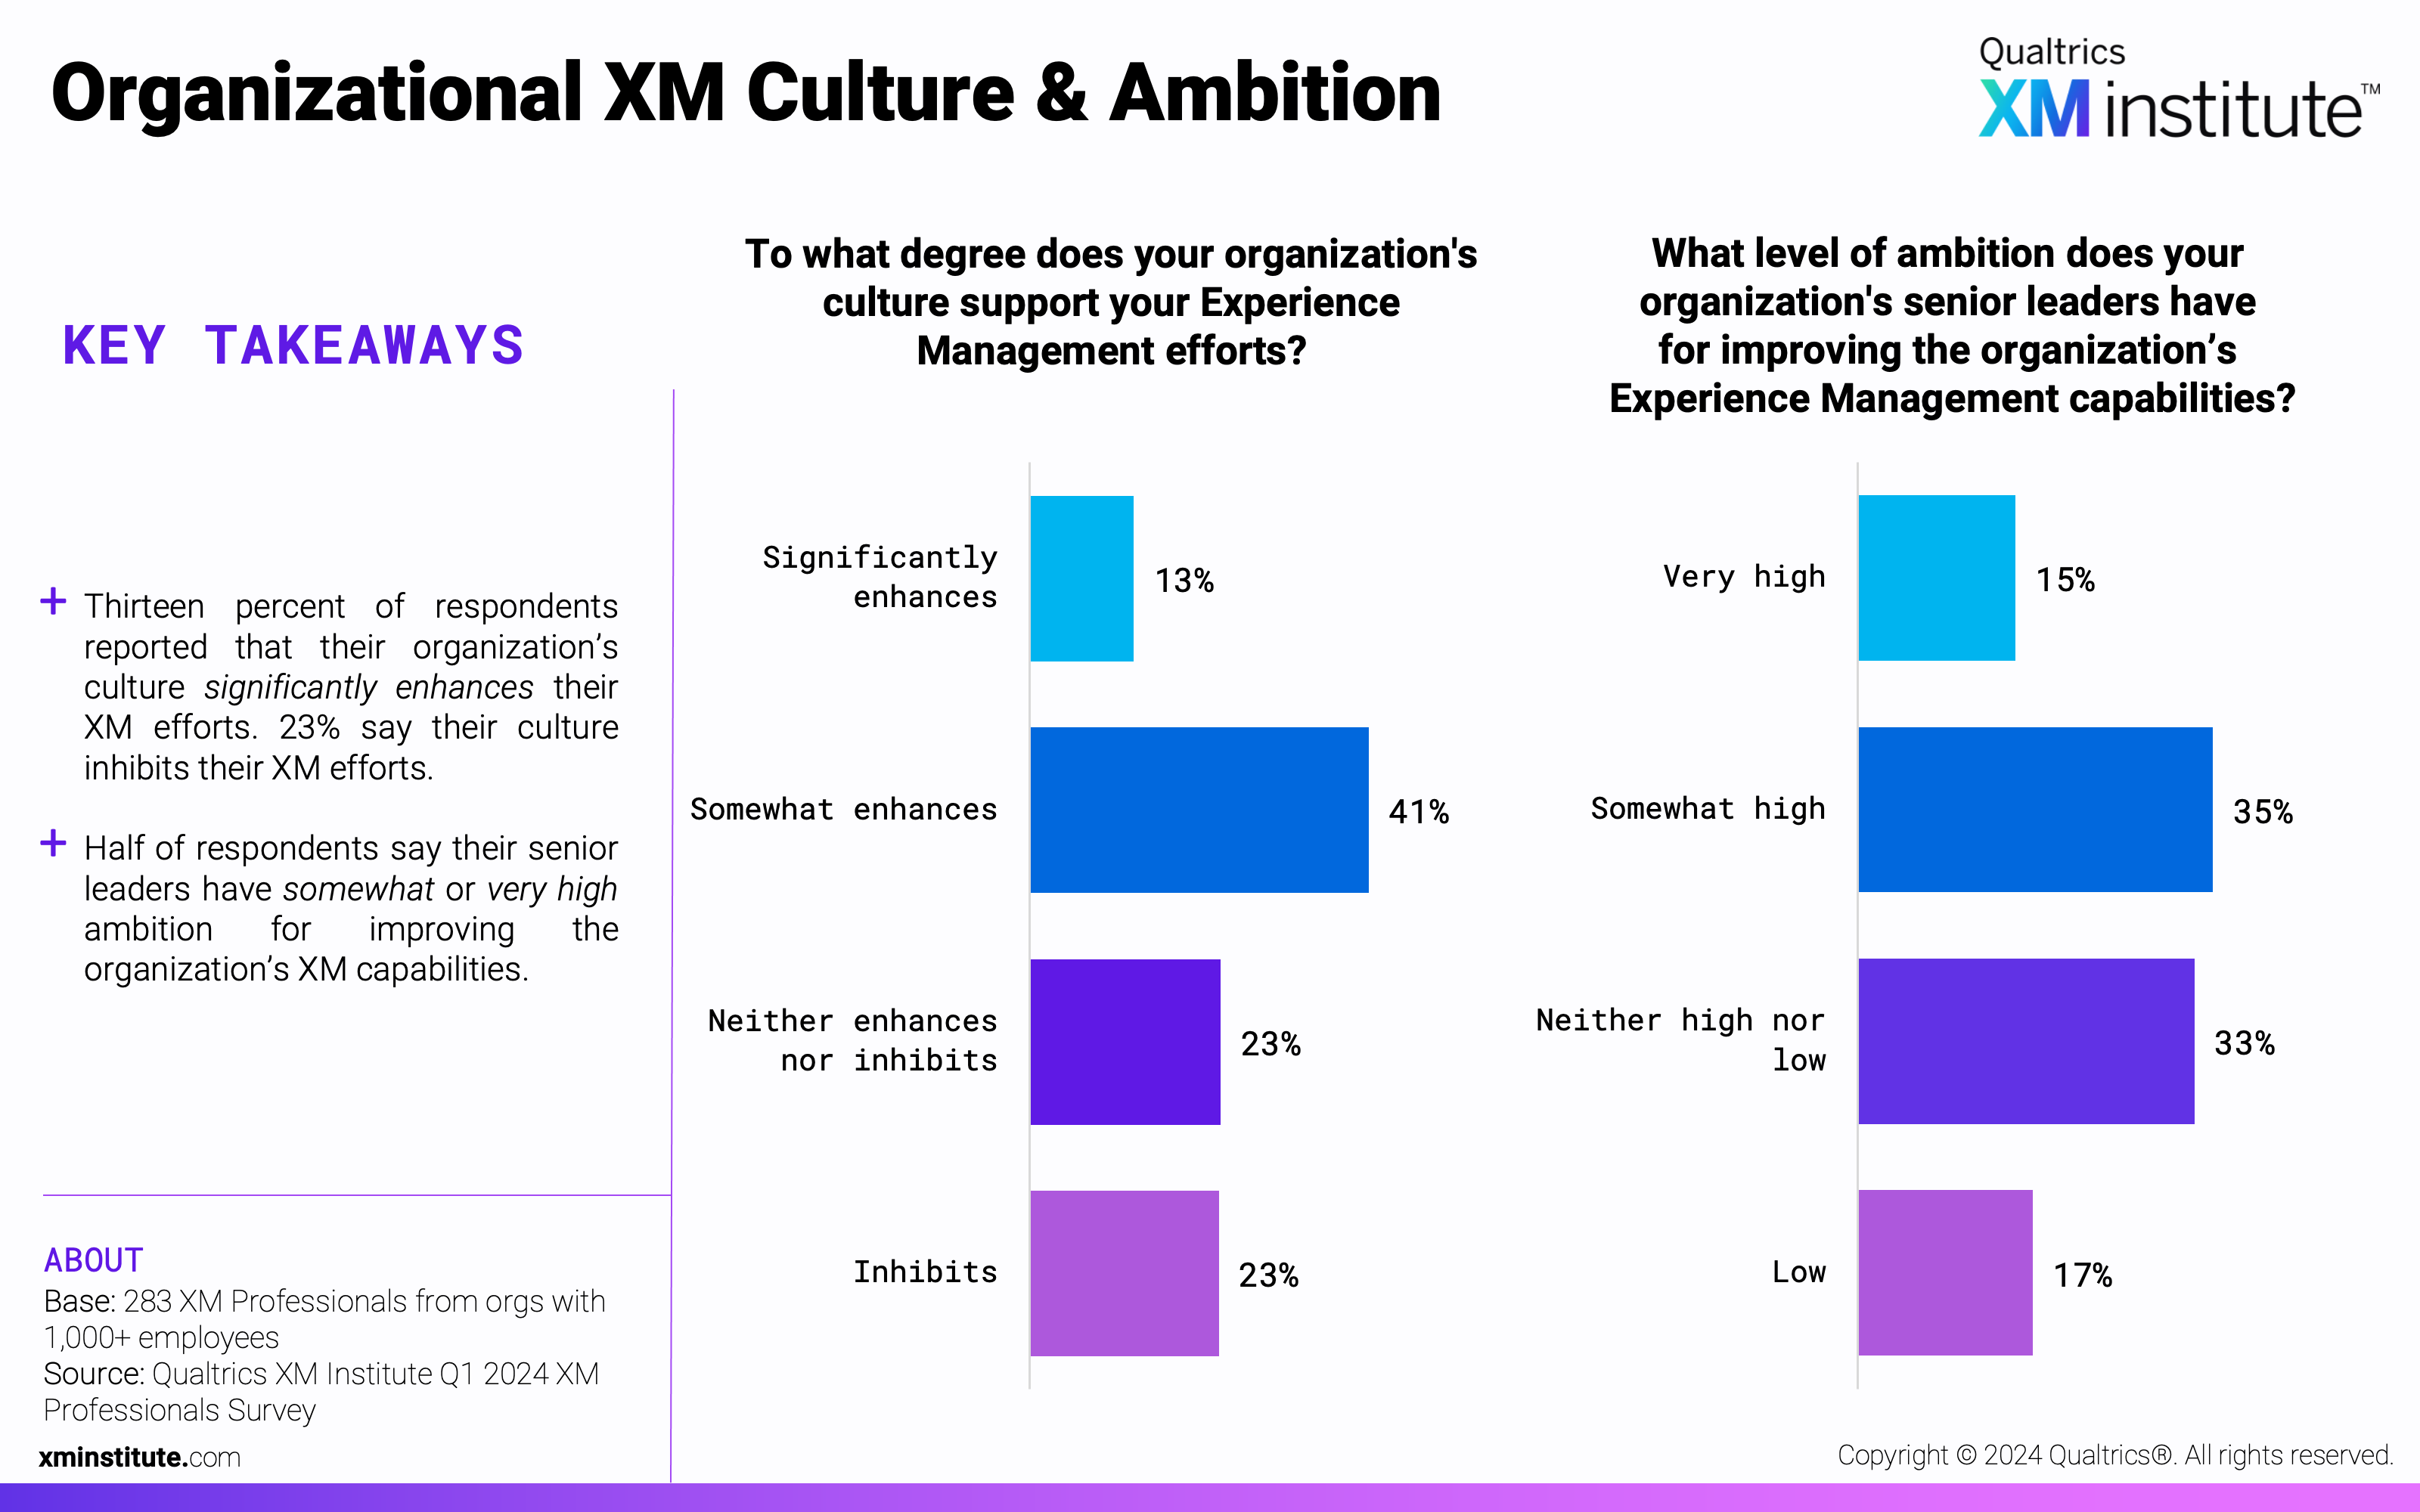
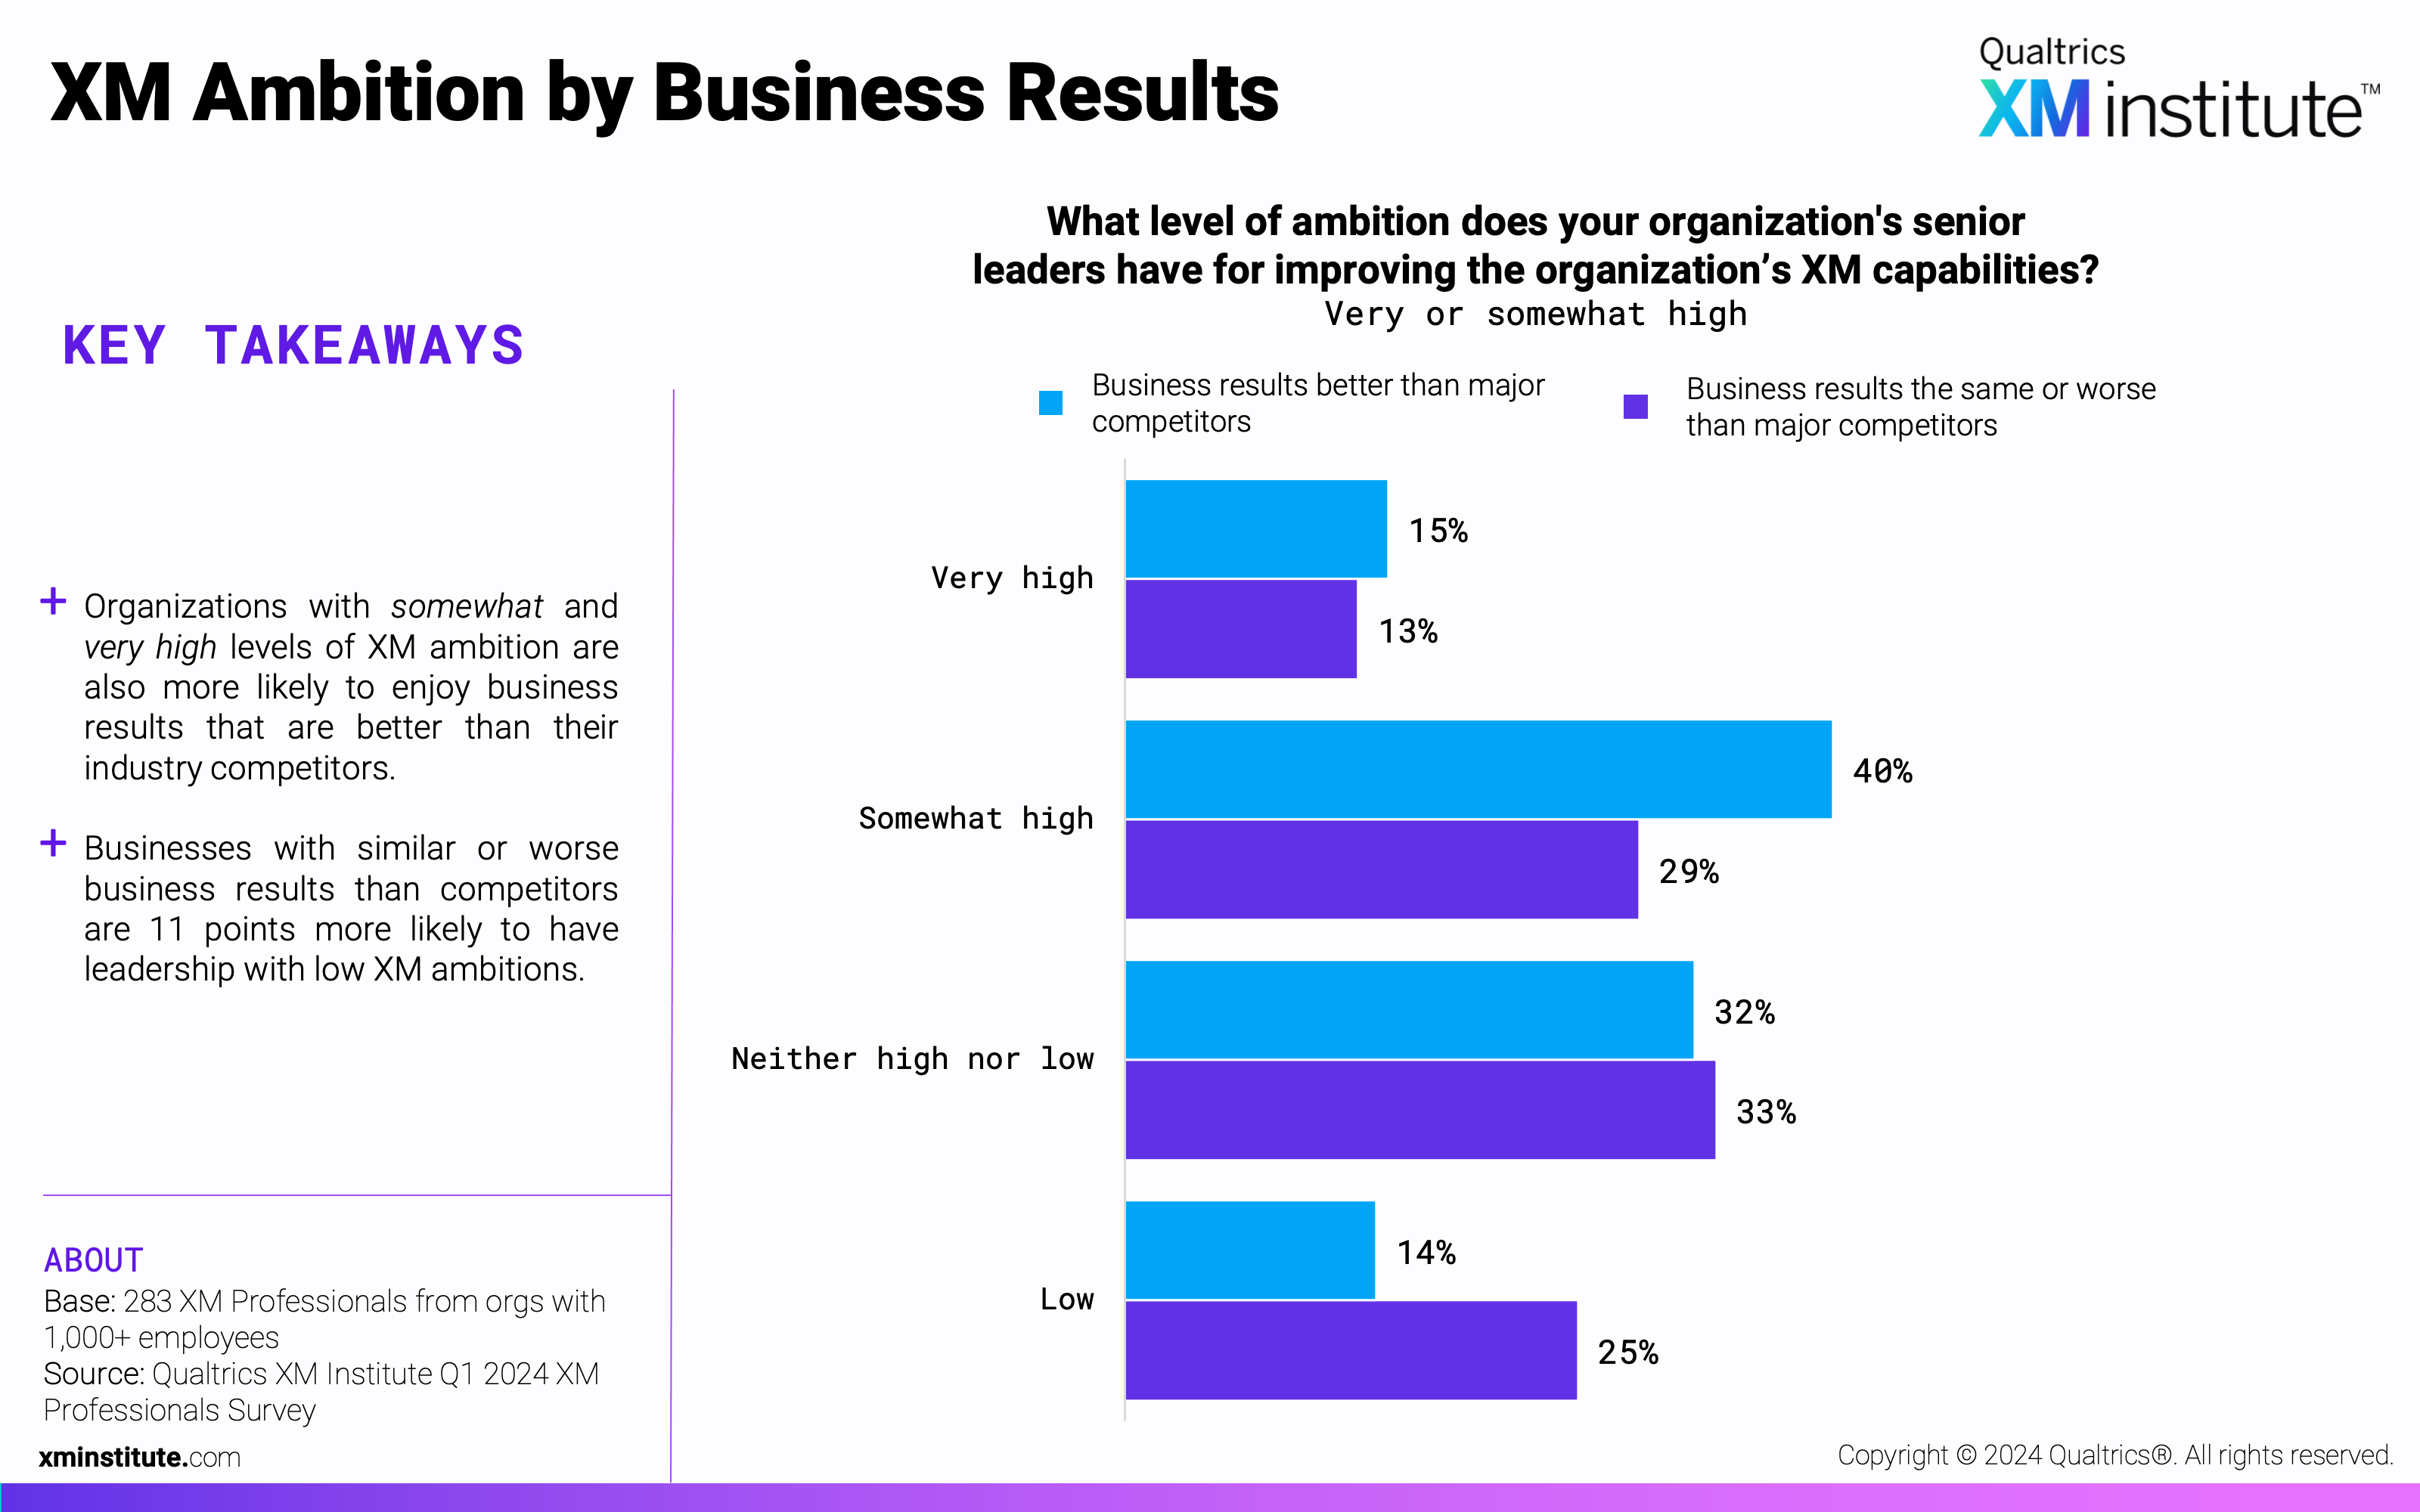
- Those with higher XM ambition also enjoy stronger business results. Compared to organizations’ whose business results are on par or worse than industry peers, those with stronger business results are more likely to have senior leaders with somewhat (+11 percentage points) or very high (+2 percentage points) ambition for improving the organization’s XM.
Figures
Here are the figures in this Data Snapshot:
- Organization Demographics
- XM Maturity
- Previous Change in Focus on XM Areas
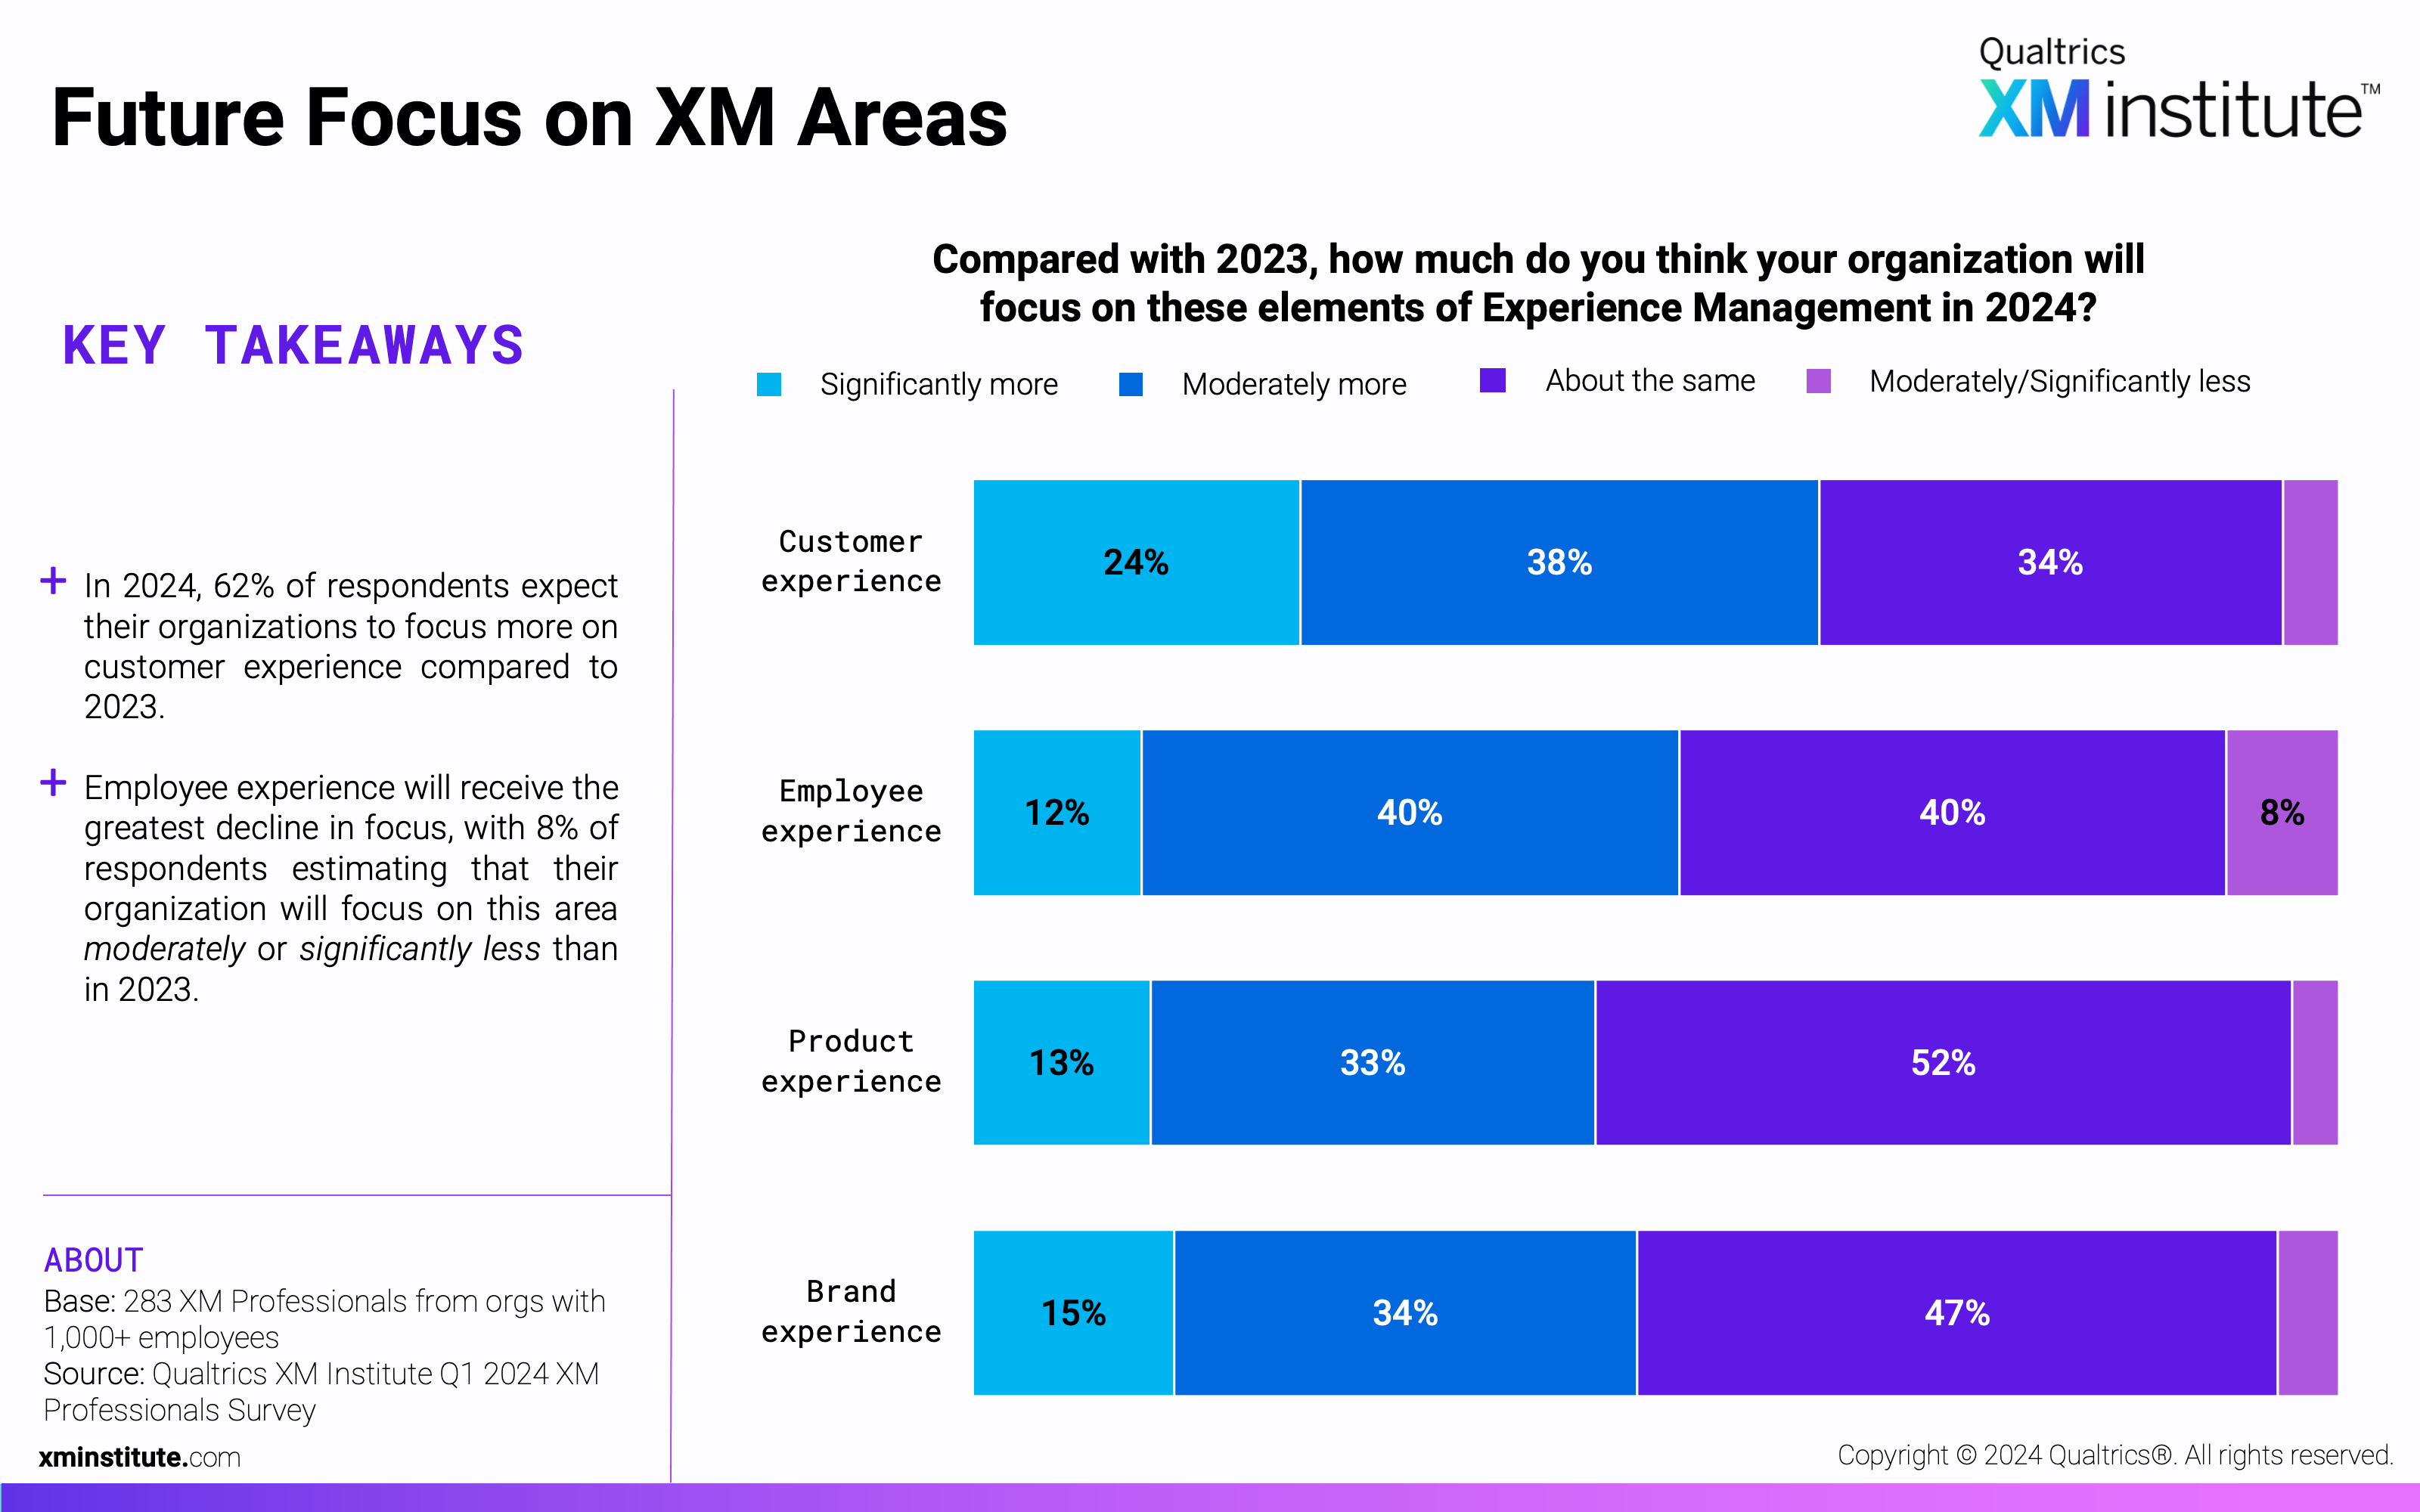
- Future Focus on XM Areas
- Importance of Customer Trust
- Importance of Employee Trust
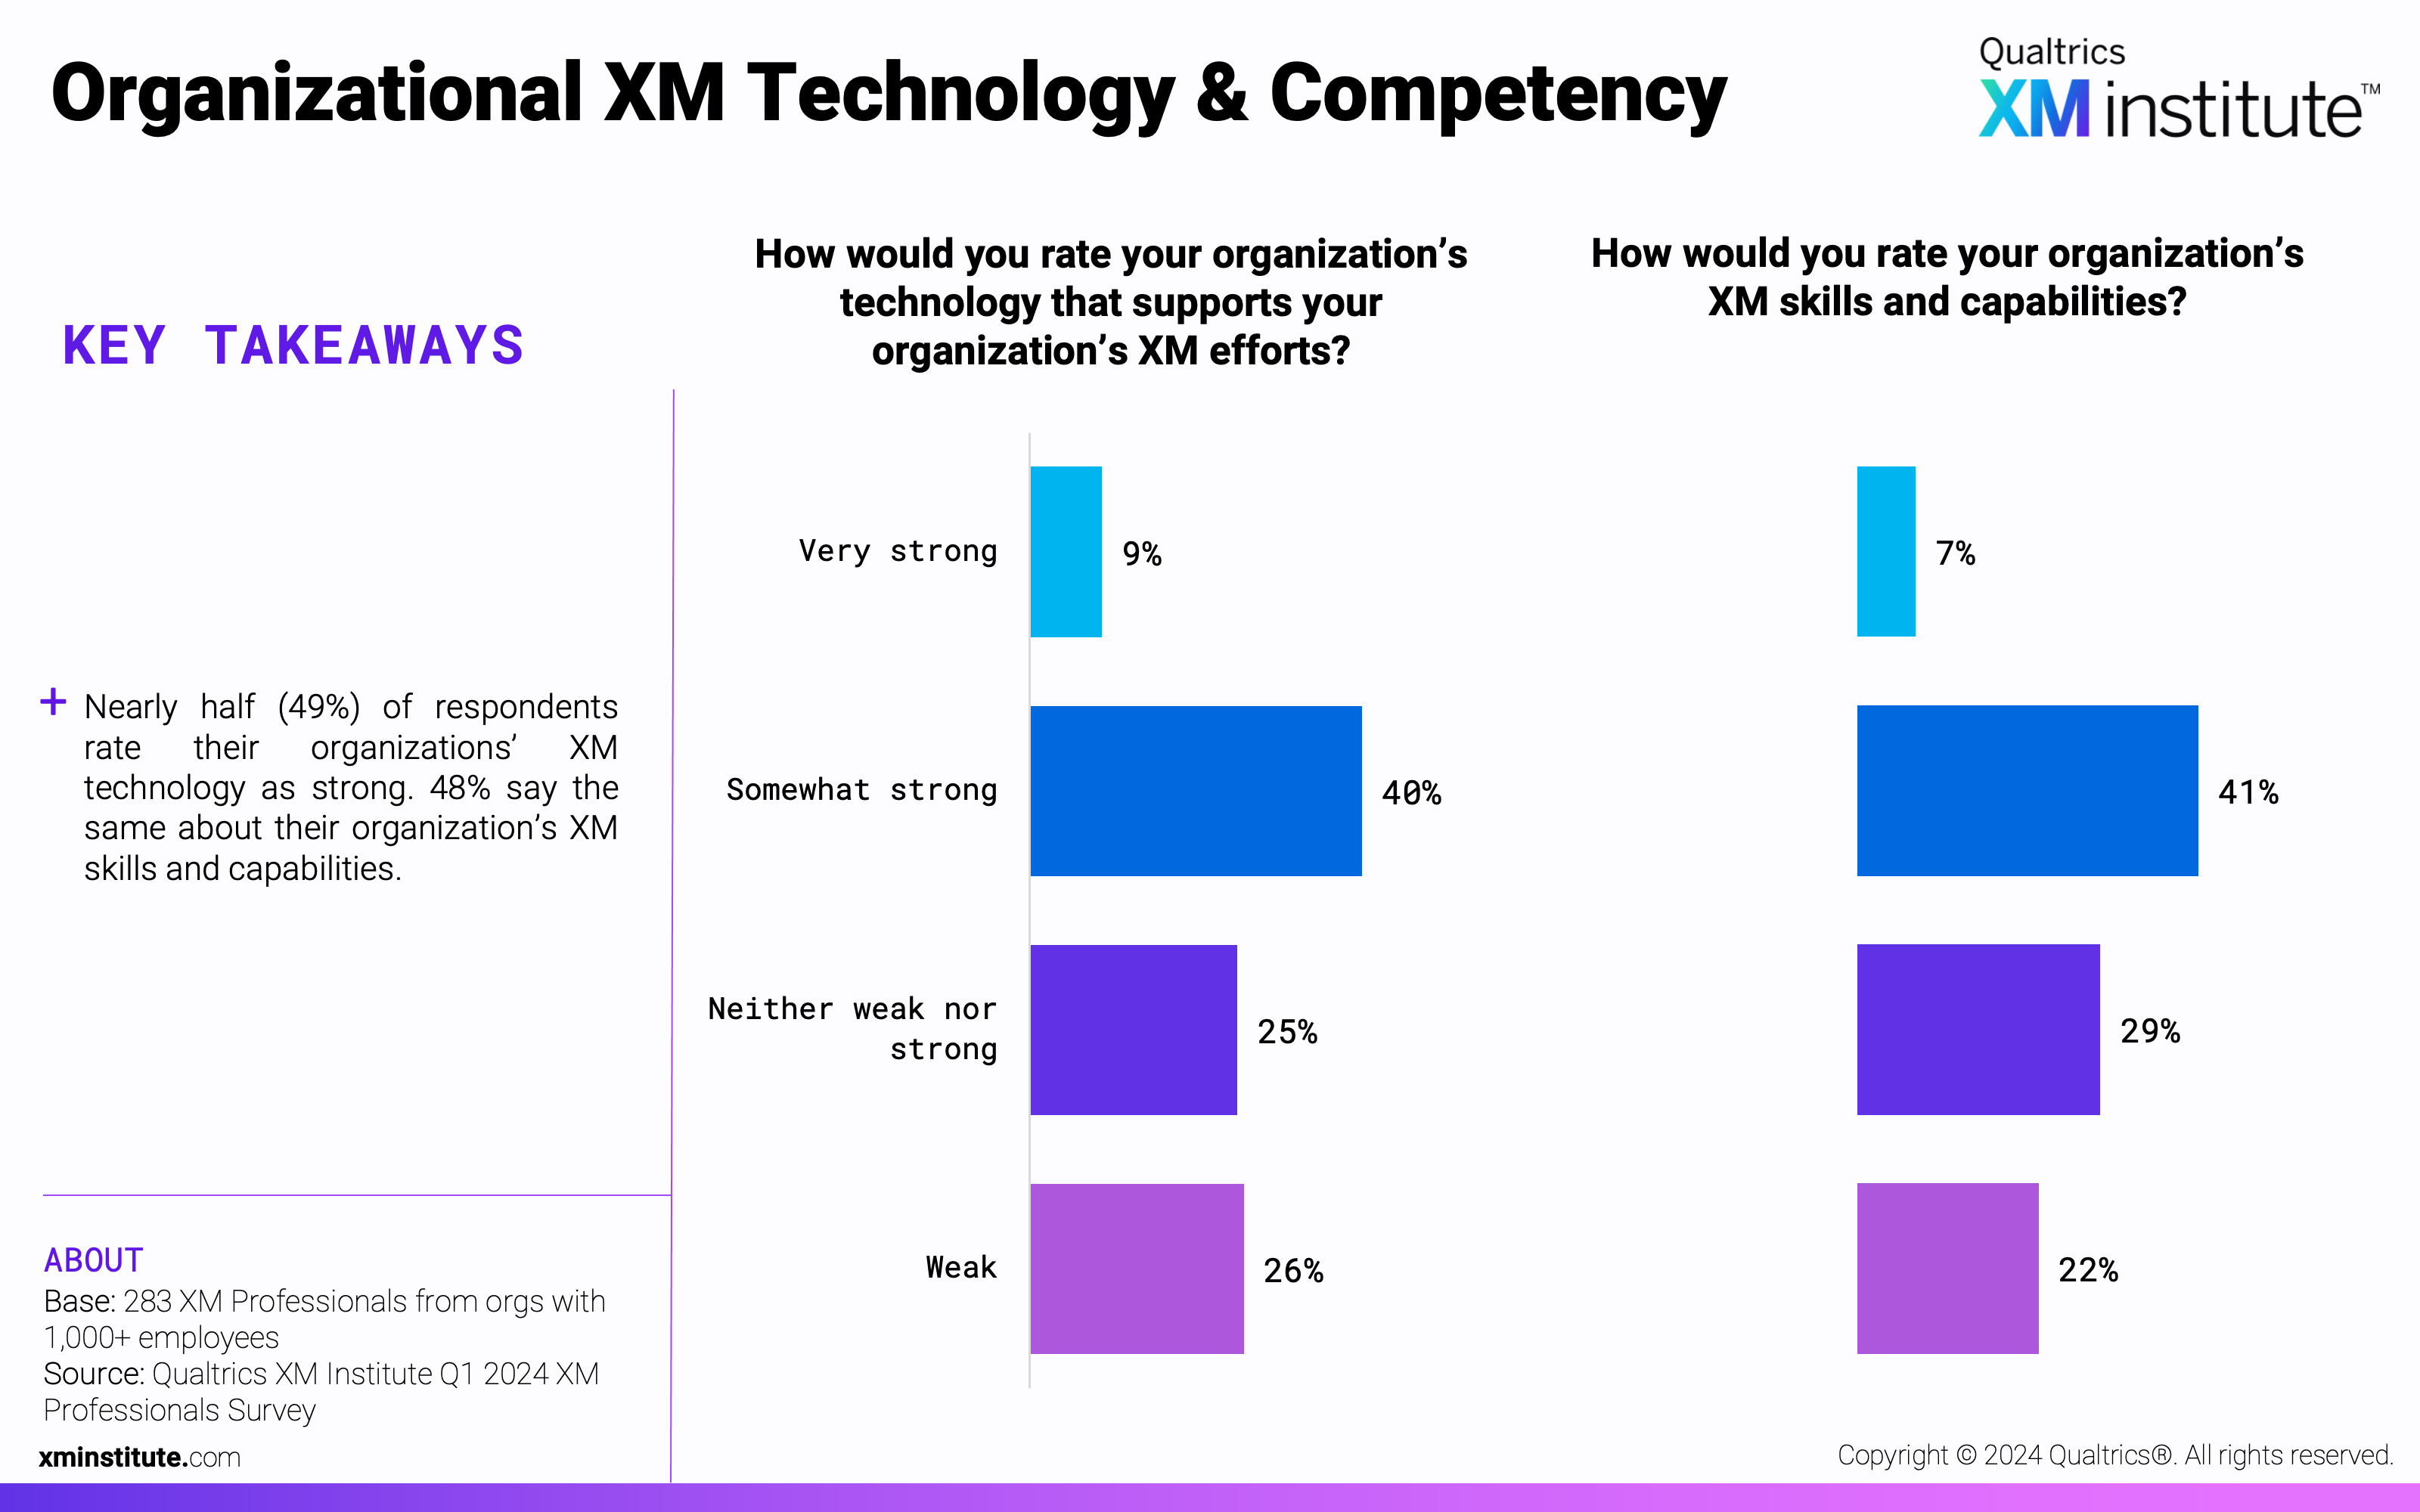
- Organizational XM Technology & Competency
- Organizational XM Culture & Ambition
- 2024 Experience Management Resource Investments
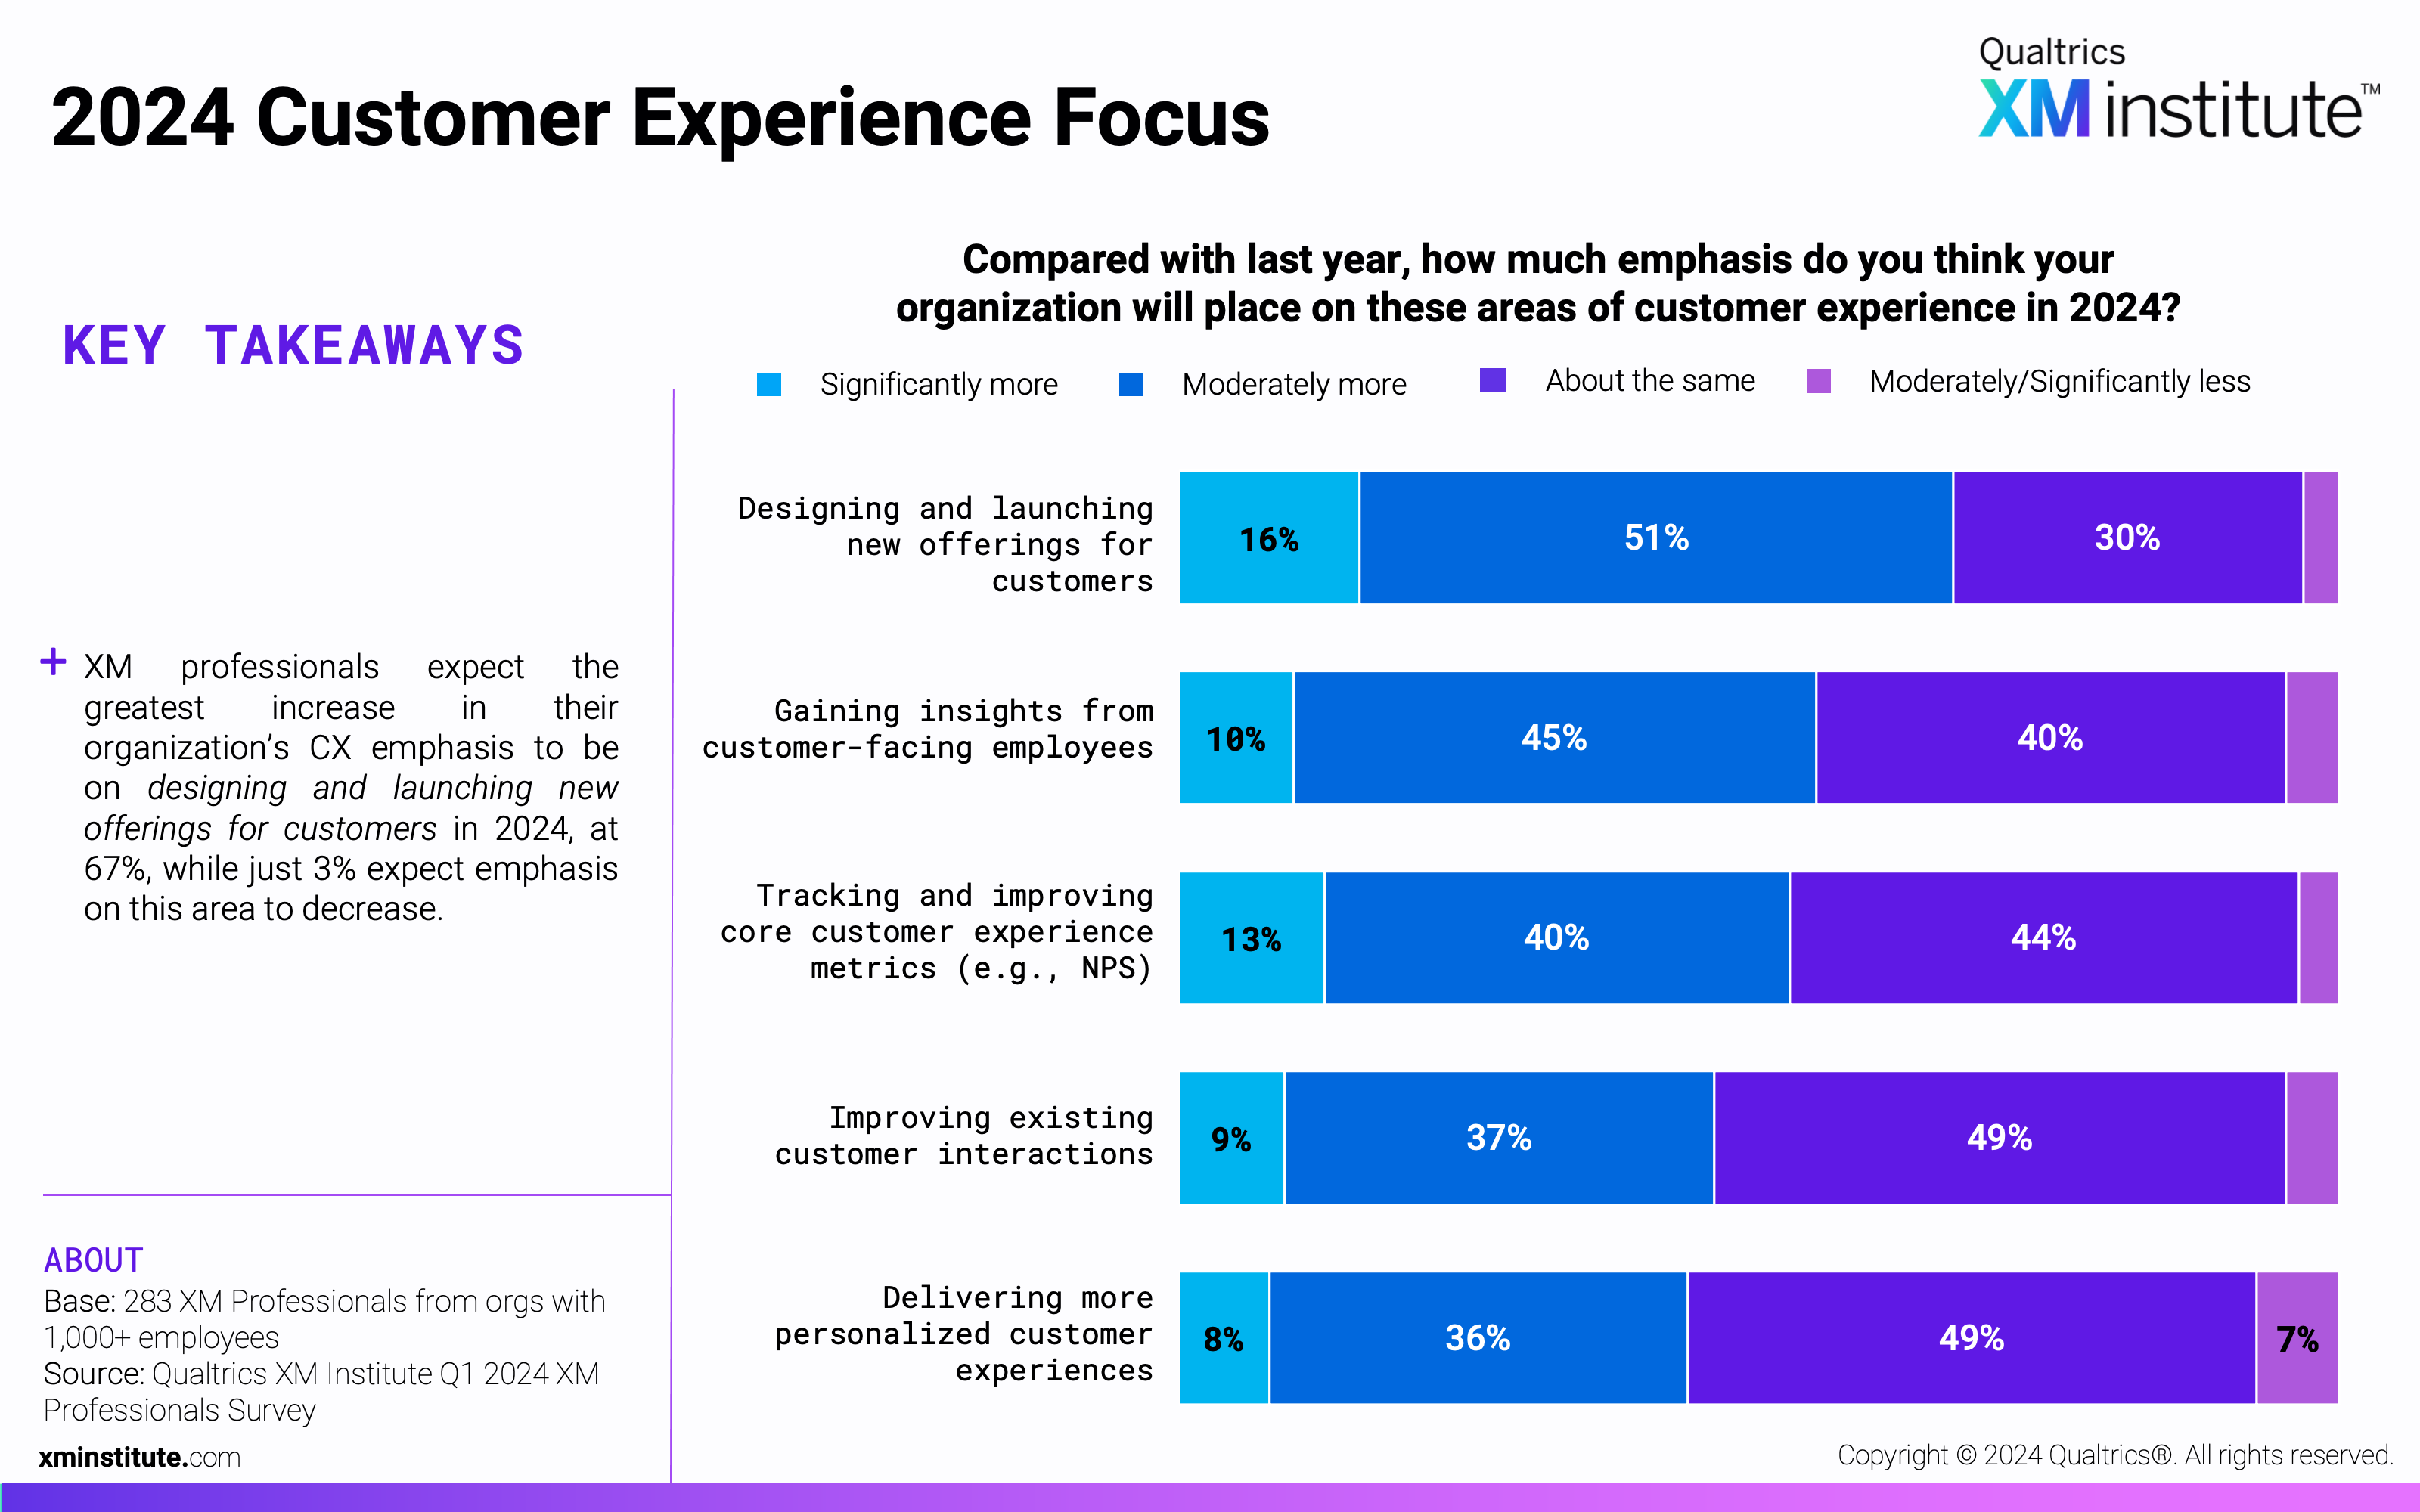
- 2024 Customer Experience Focus
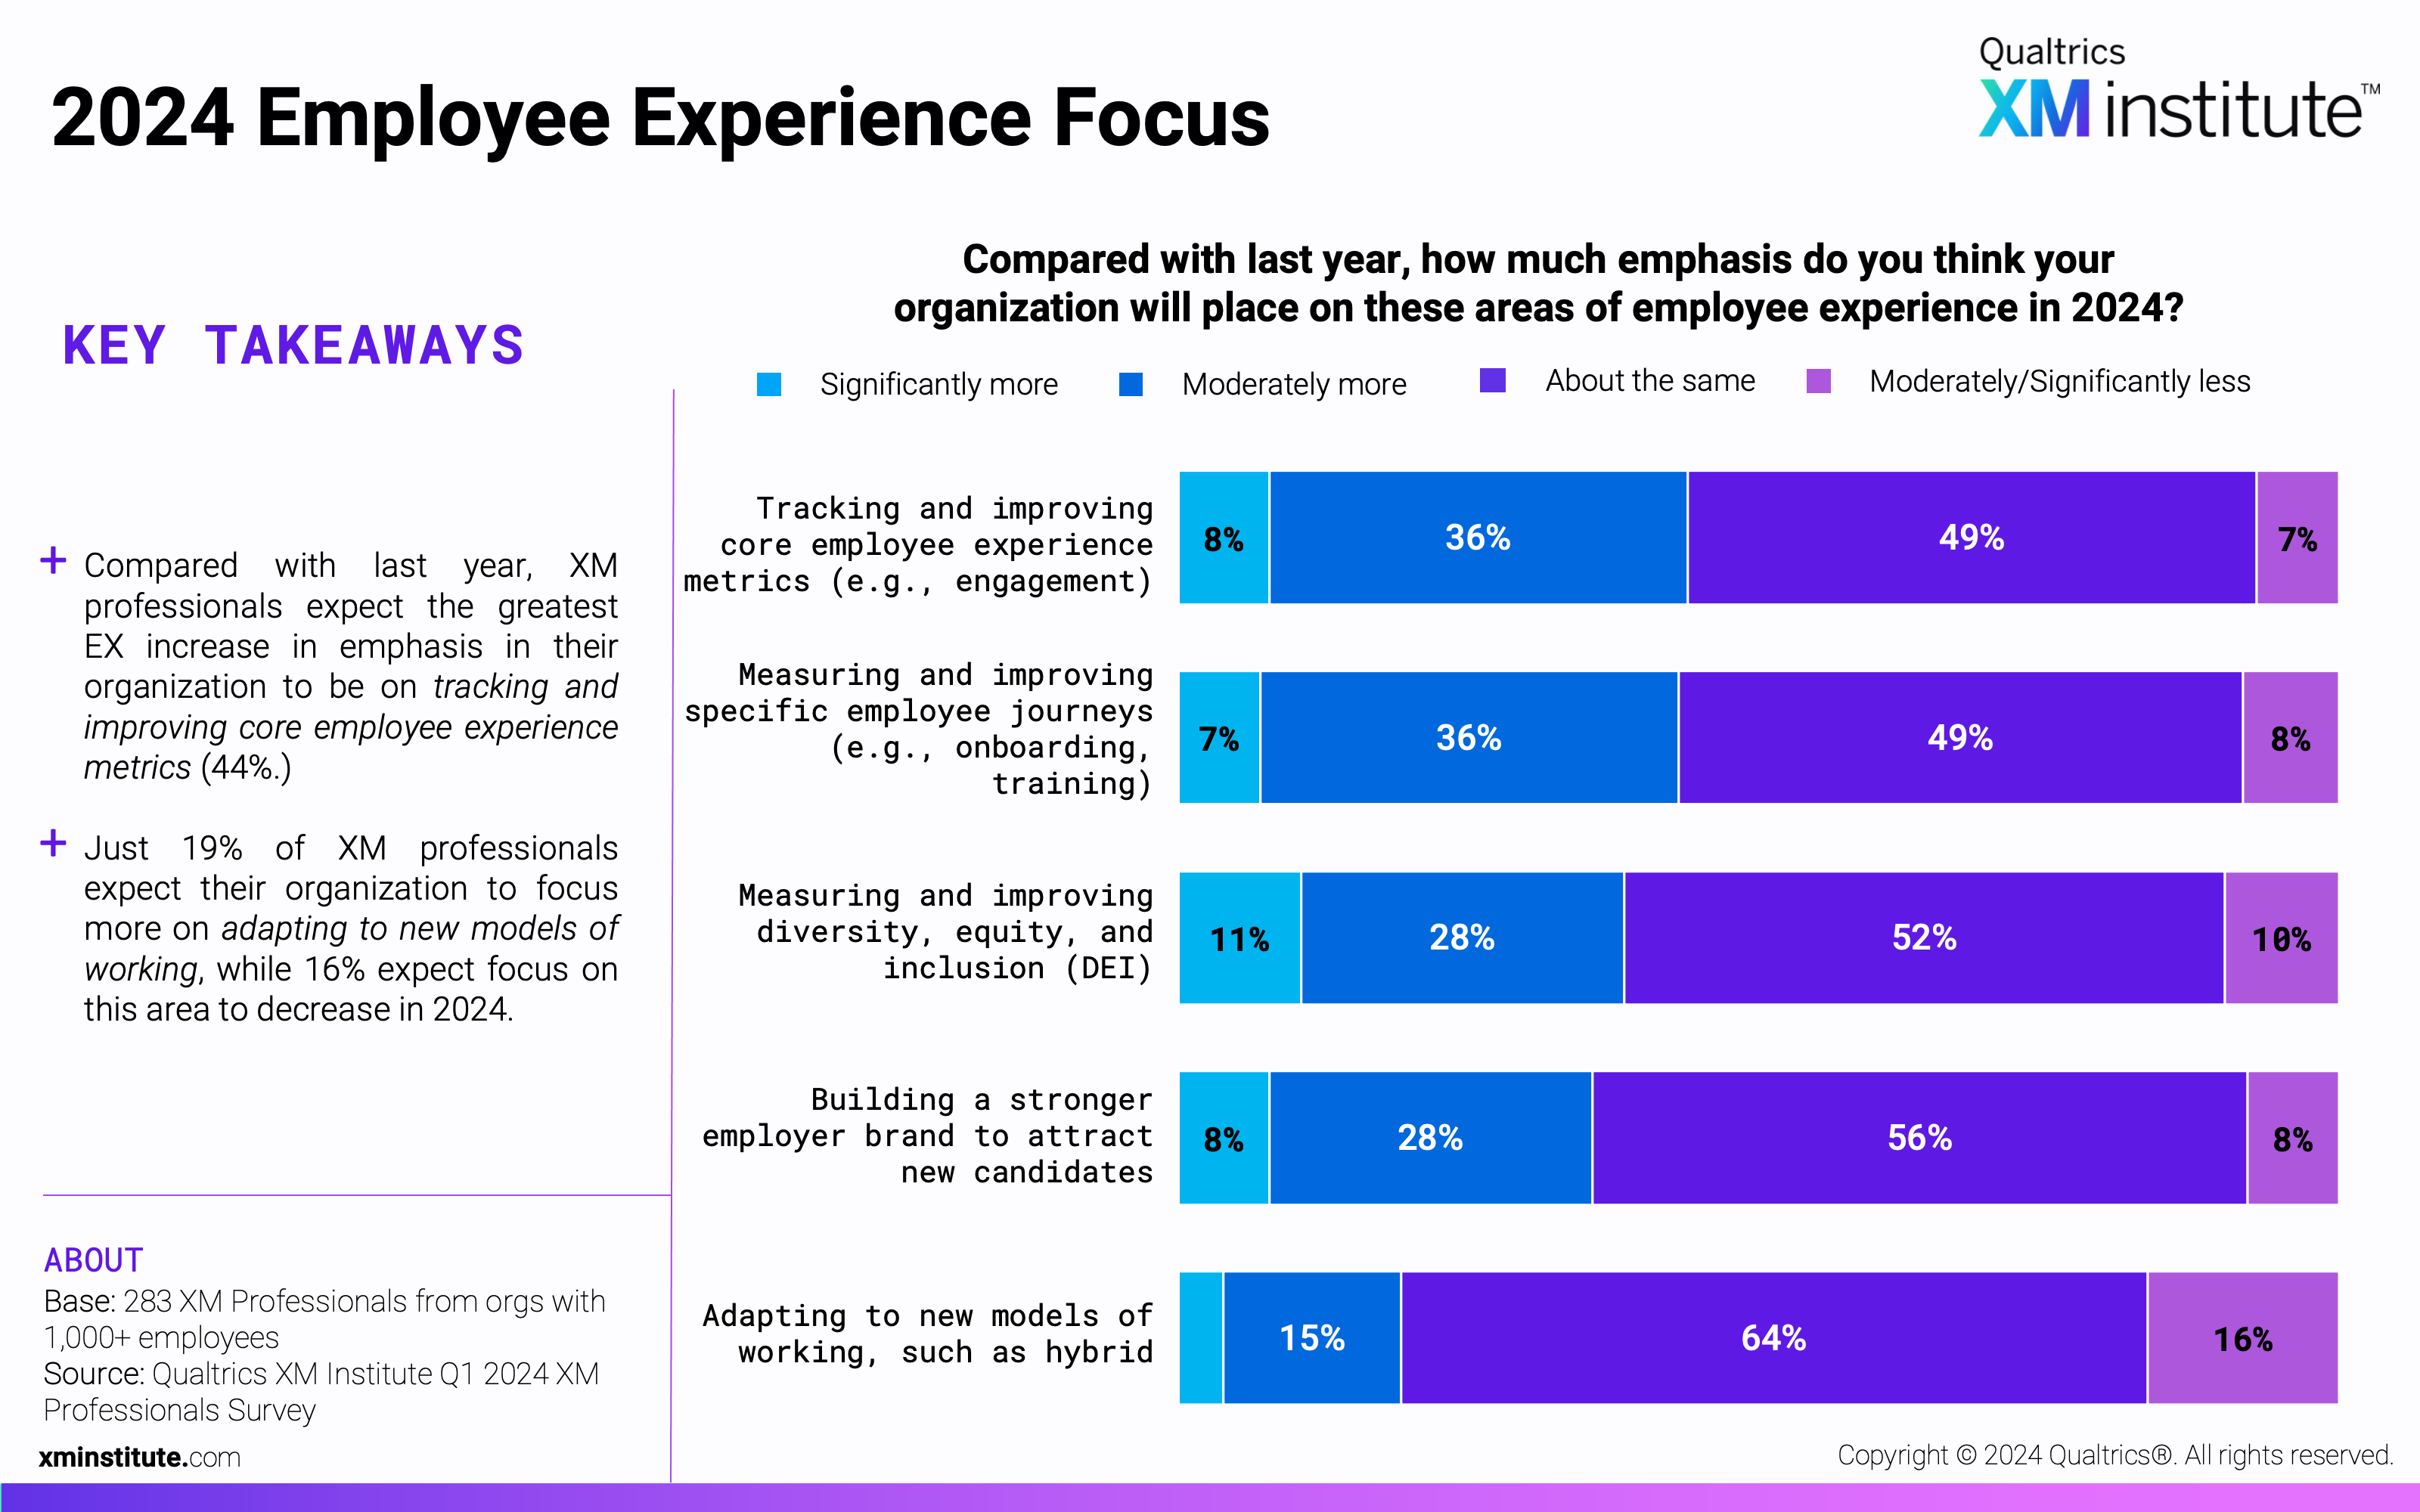
- 2024 Employee Experience Focus
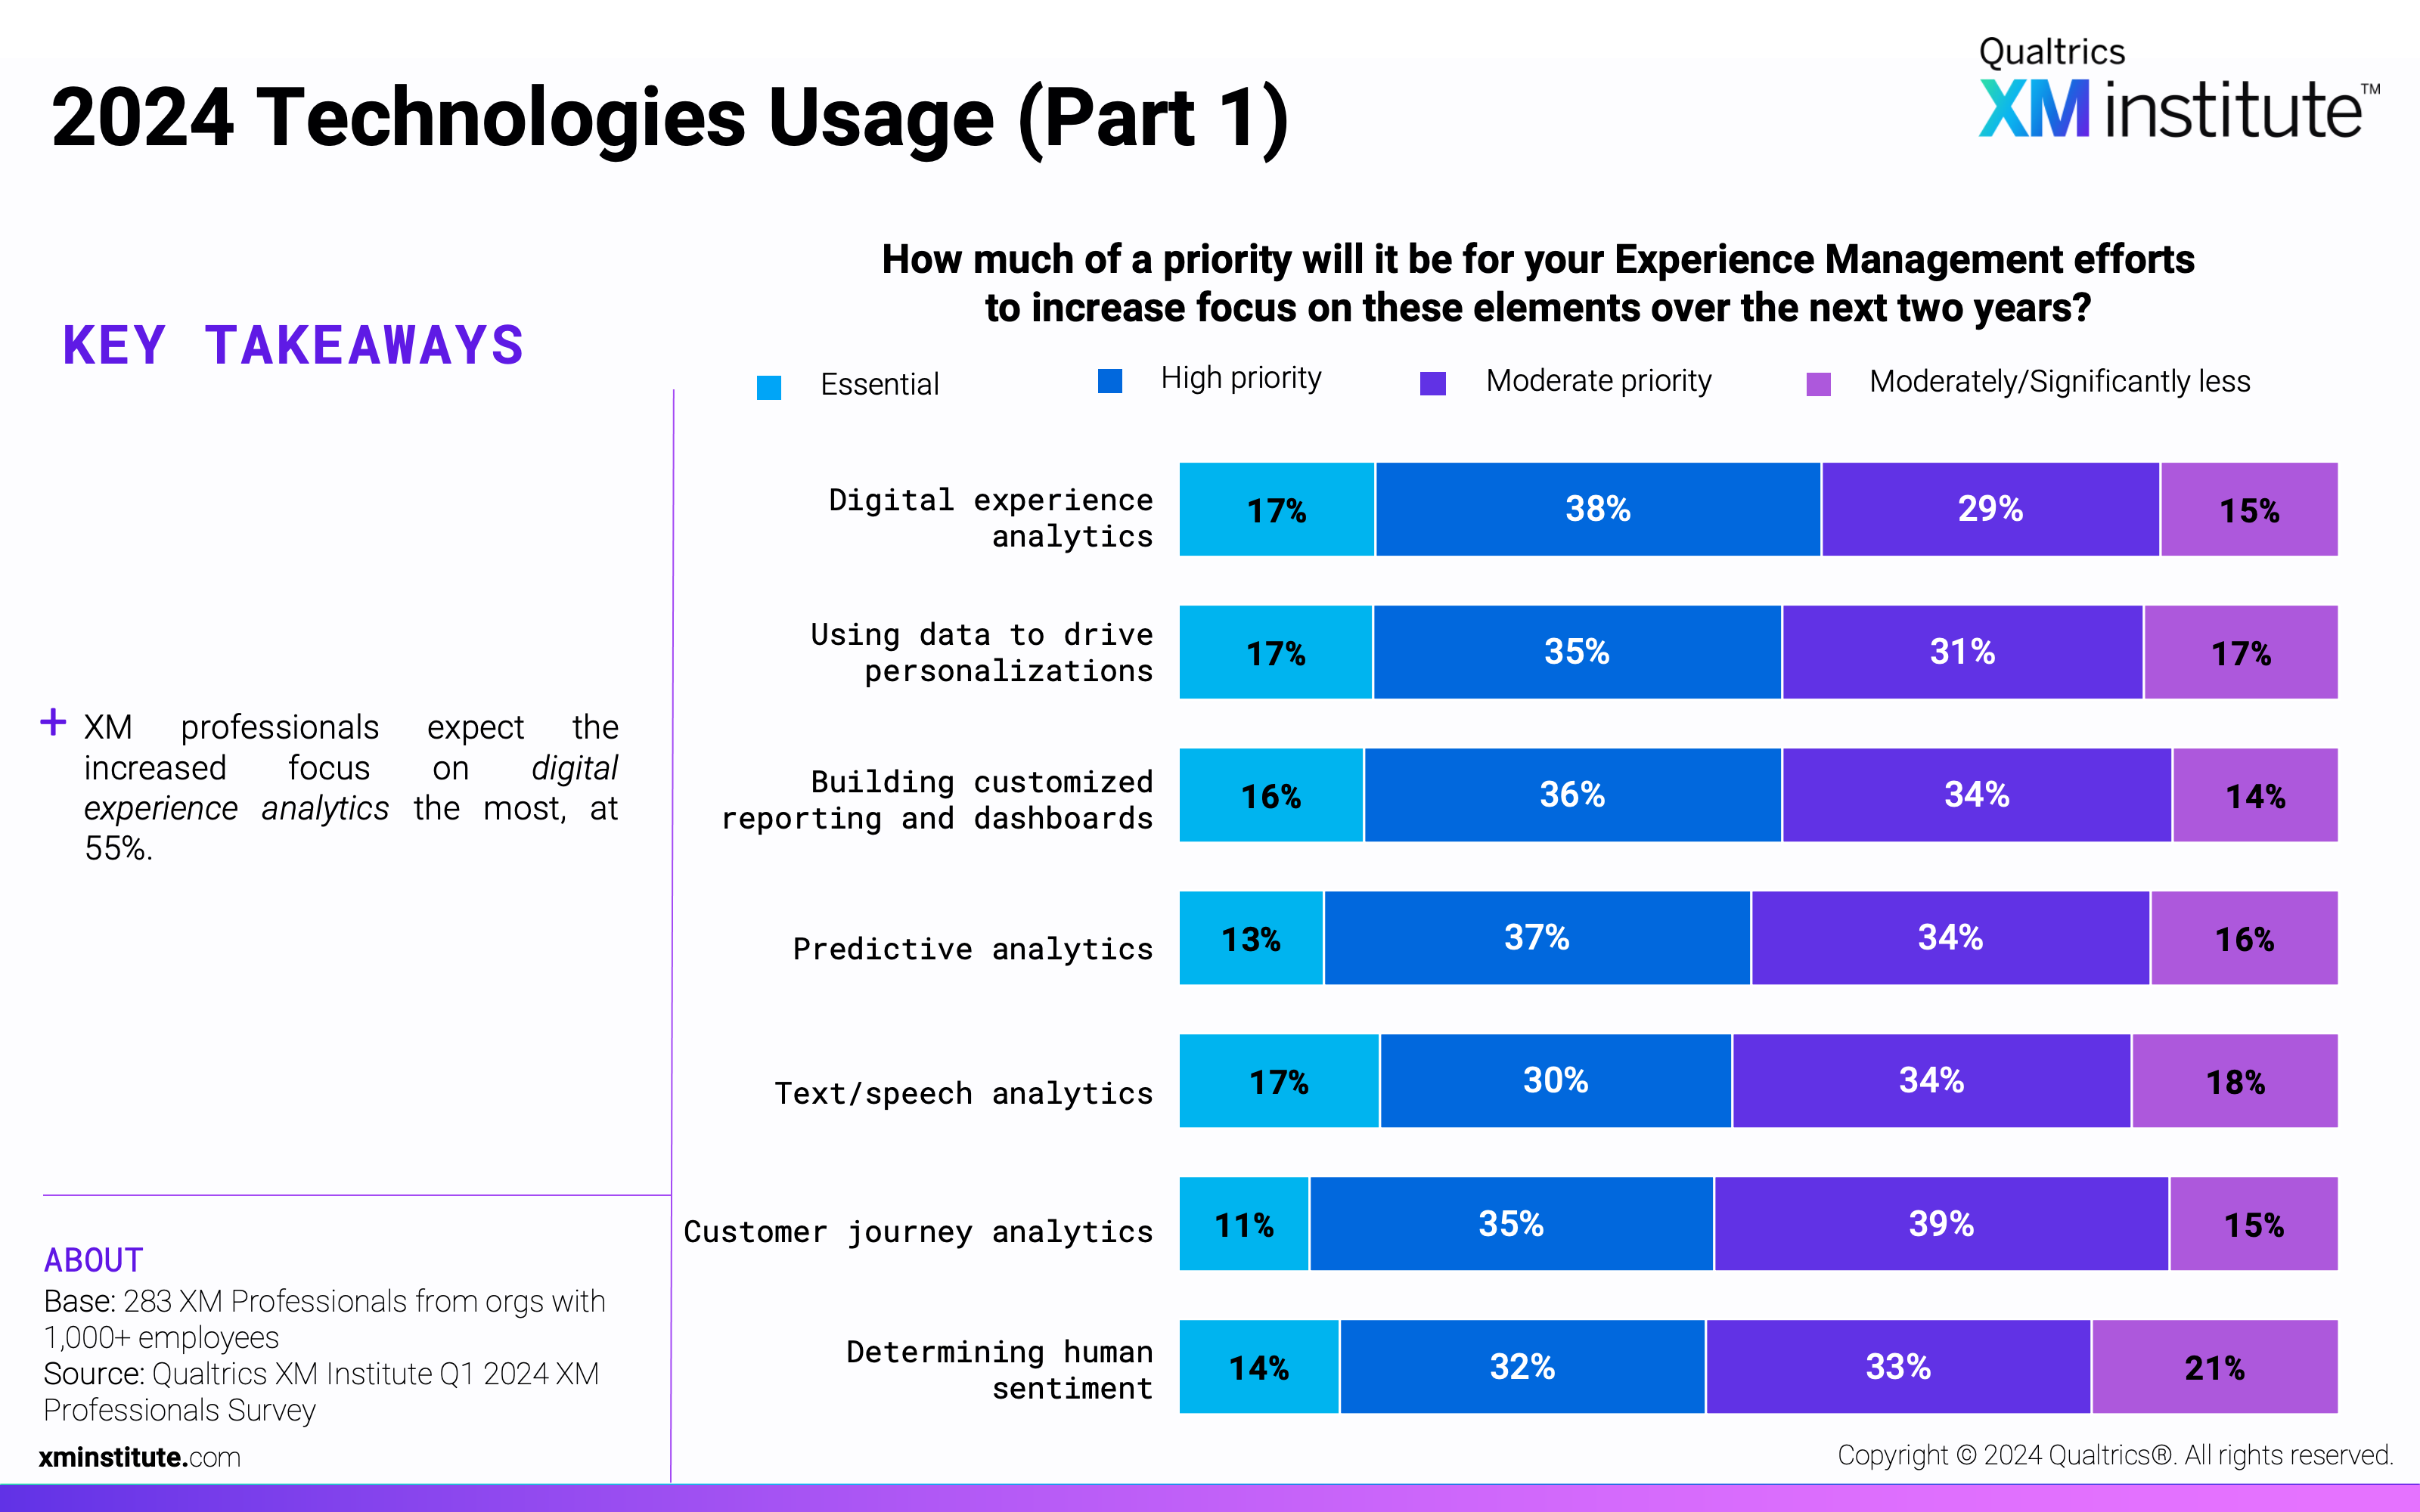
- 2024 Technologies Usage (Part 1)
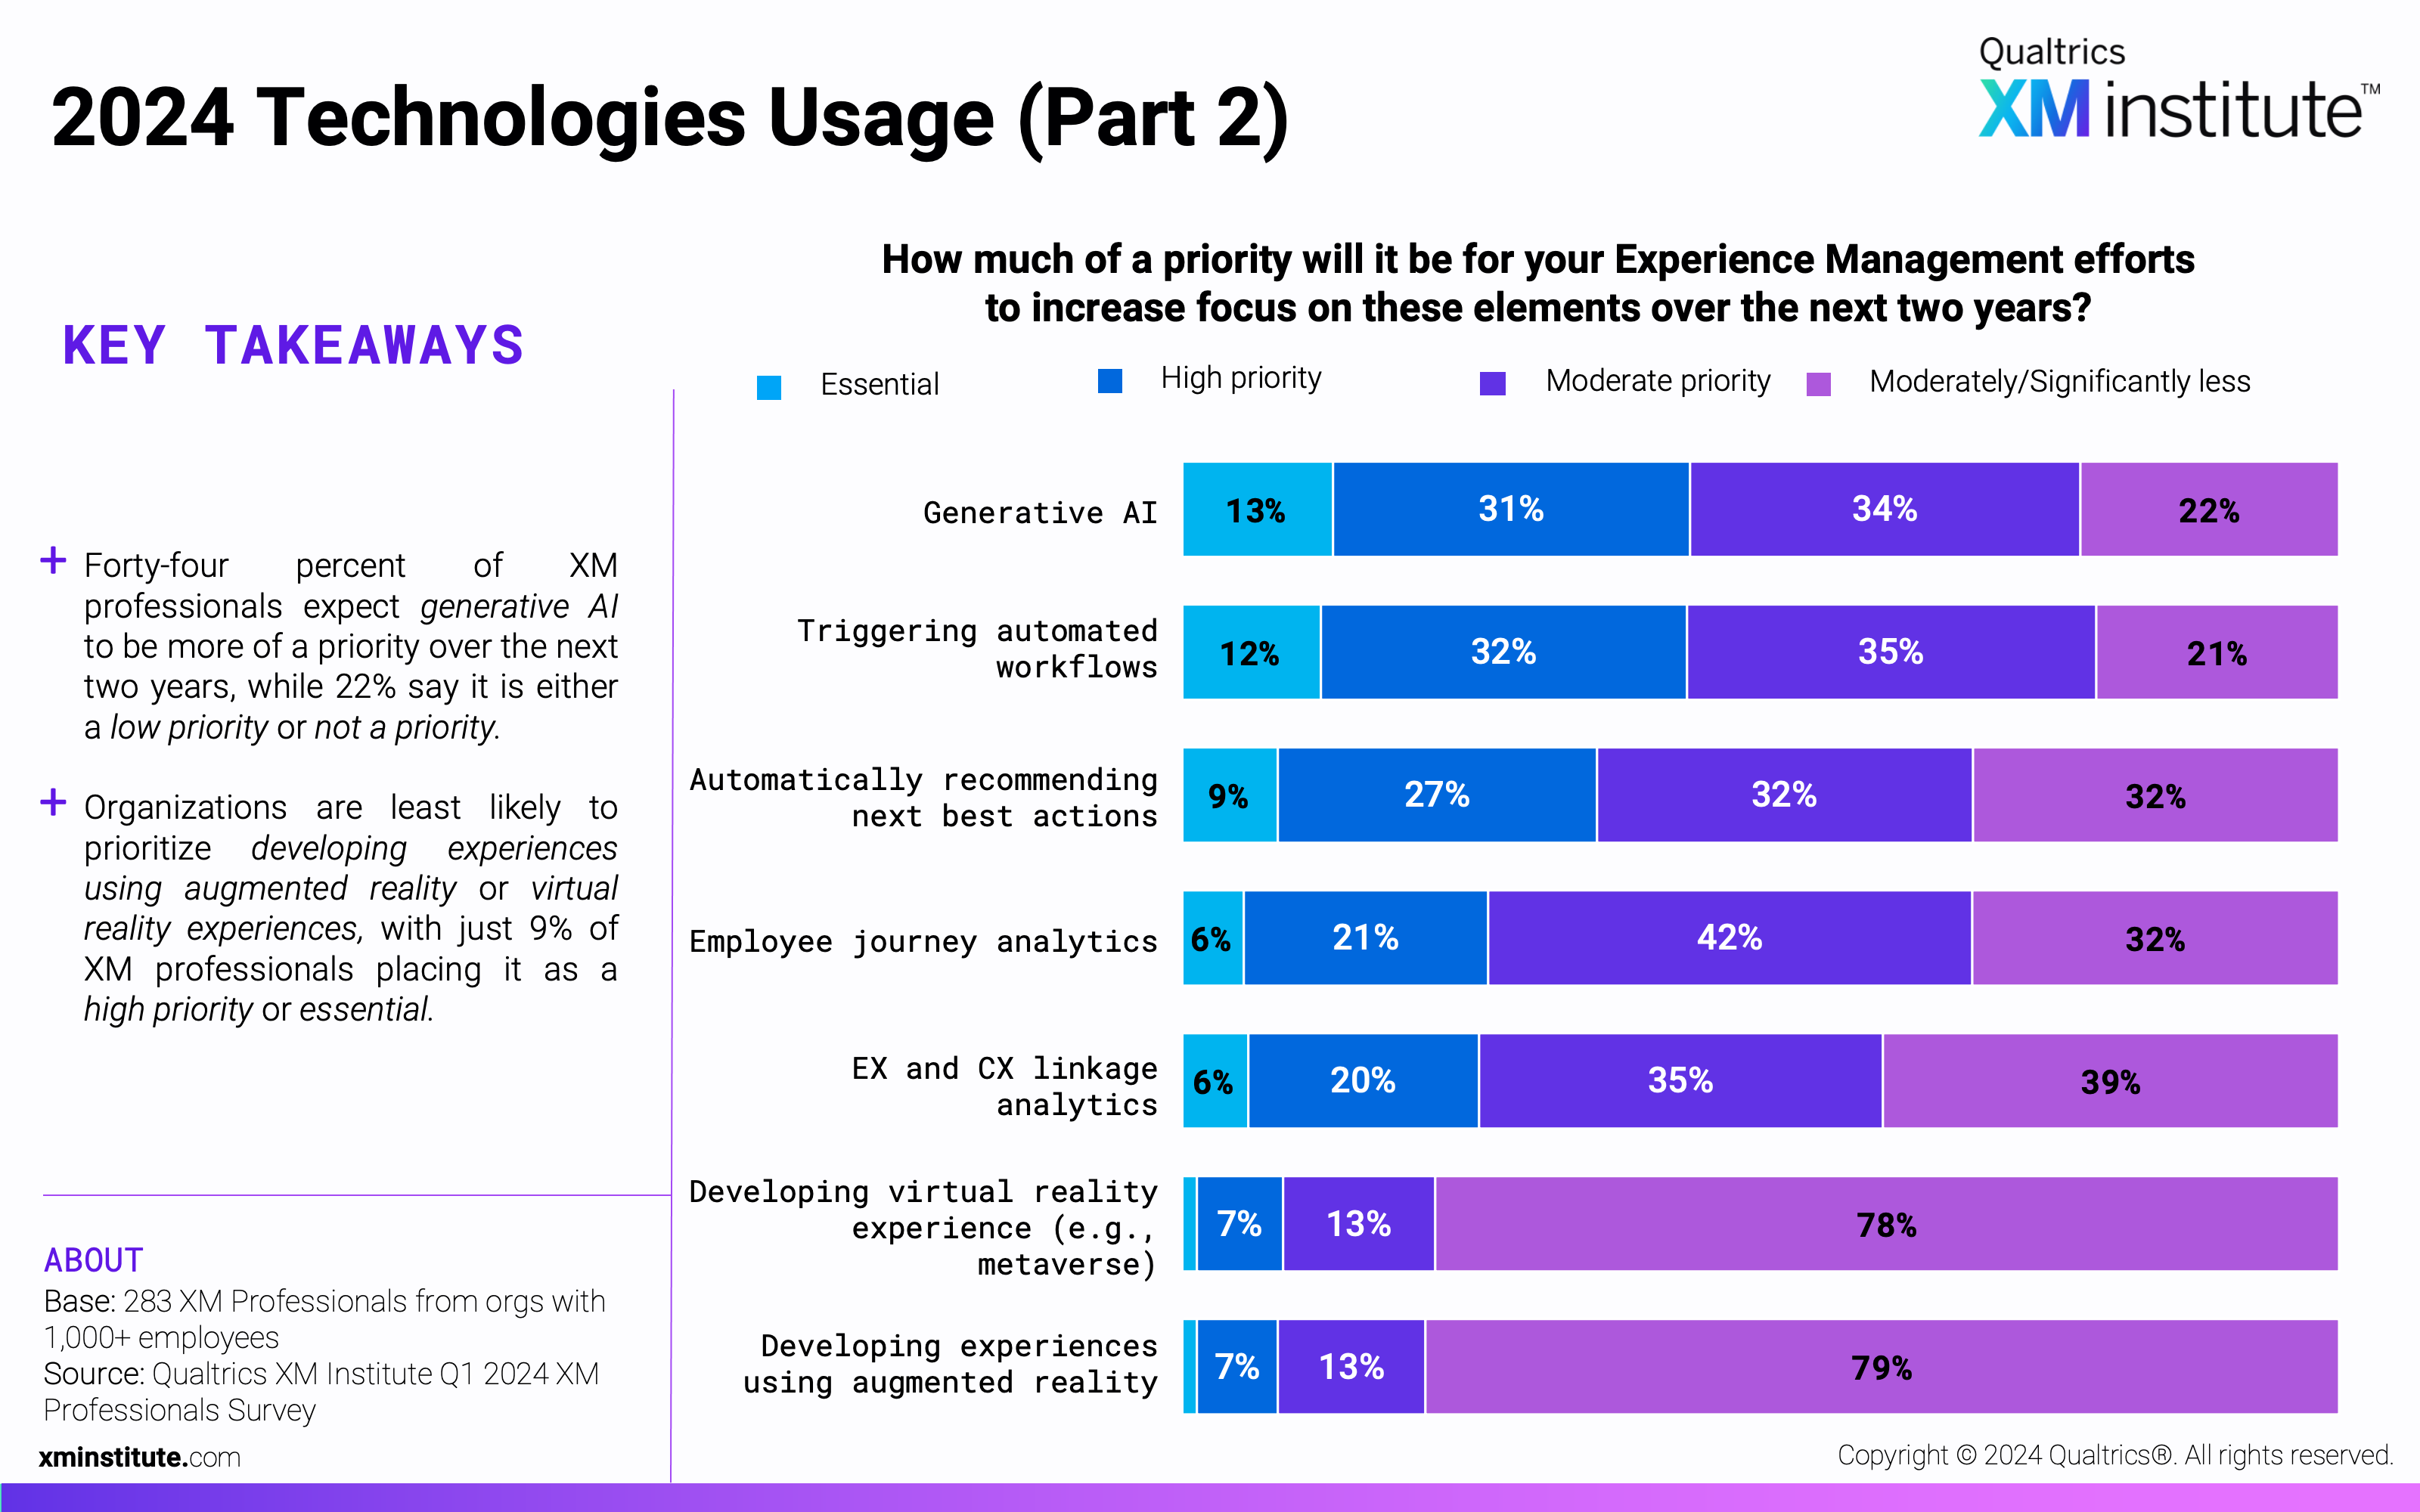
- 2024 Technologies Usage (Part 2)
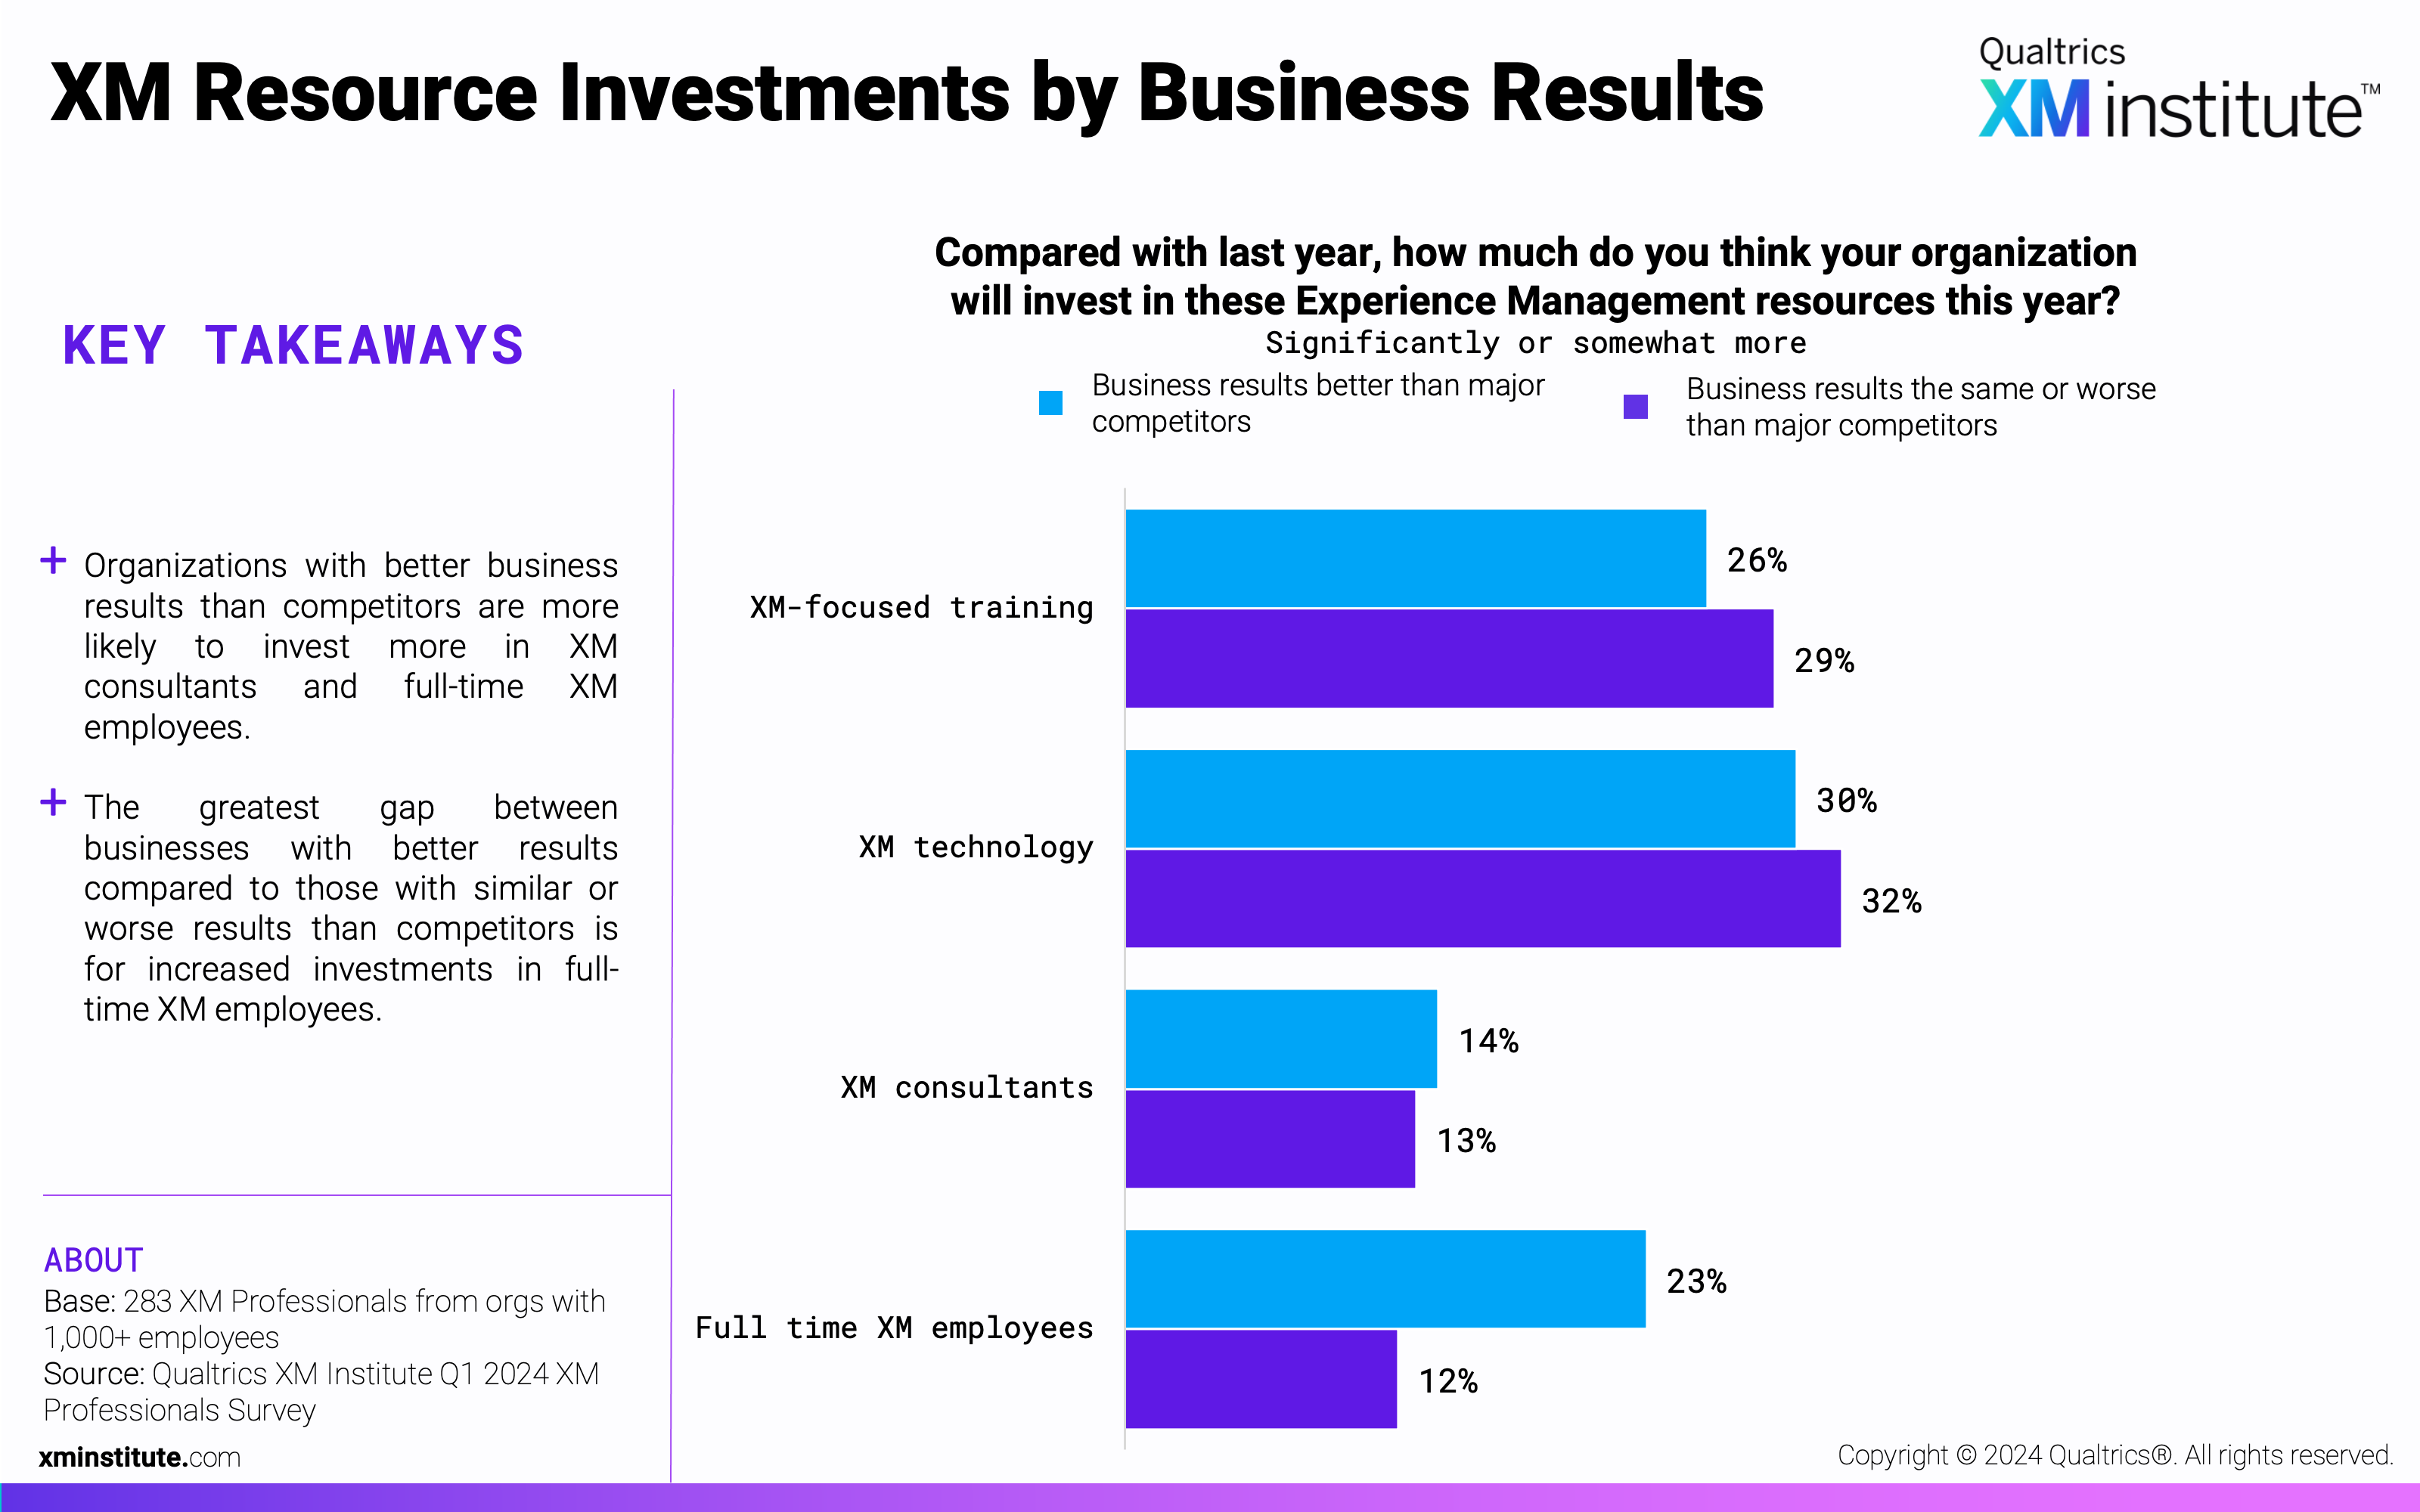
- XM Resource Investments by Business Results
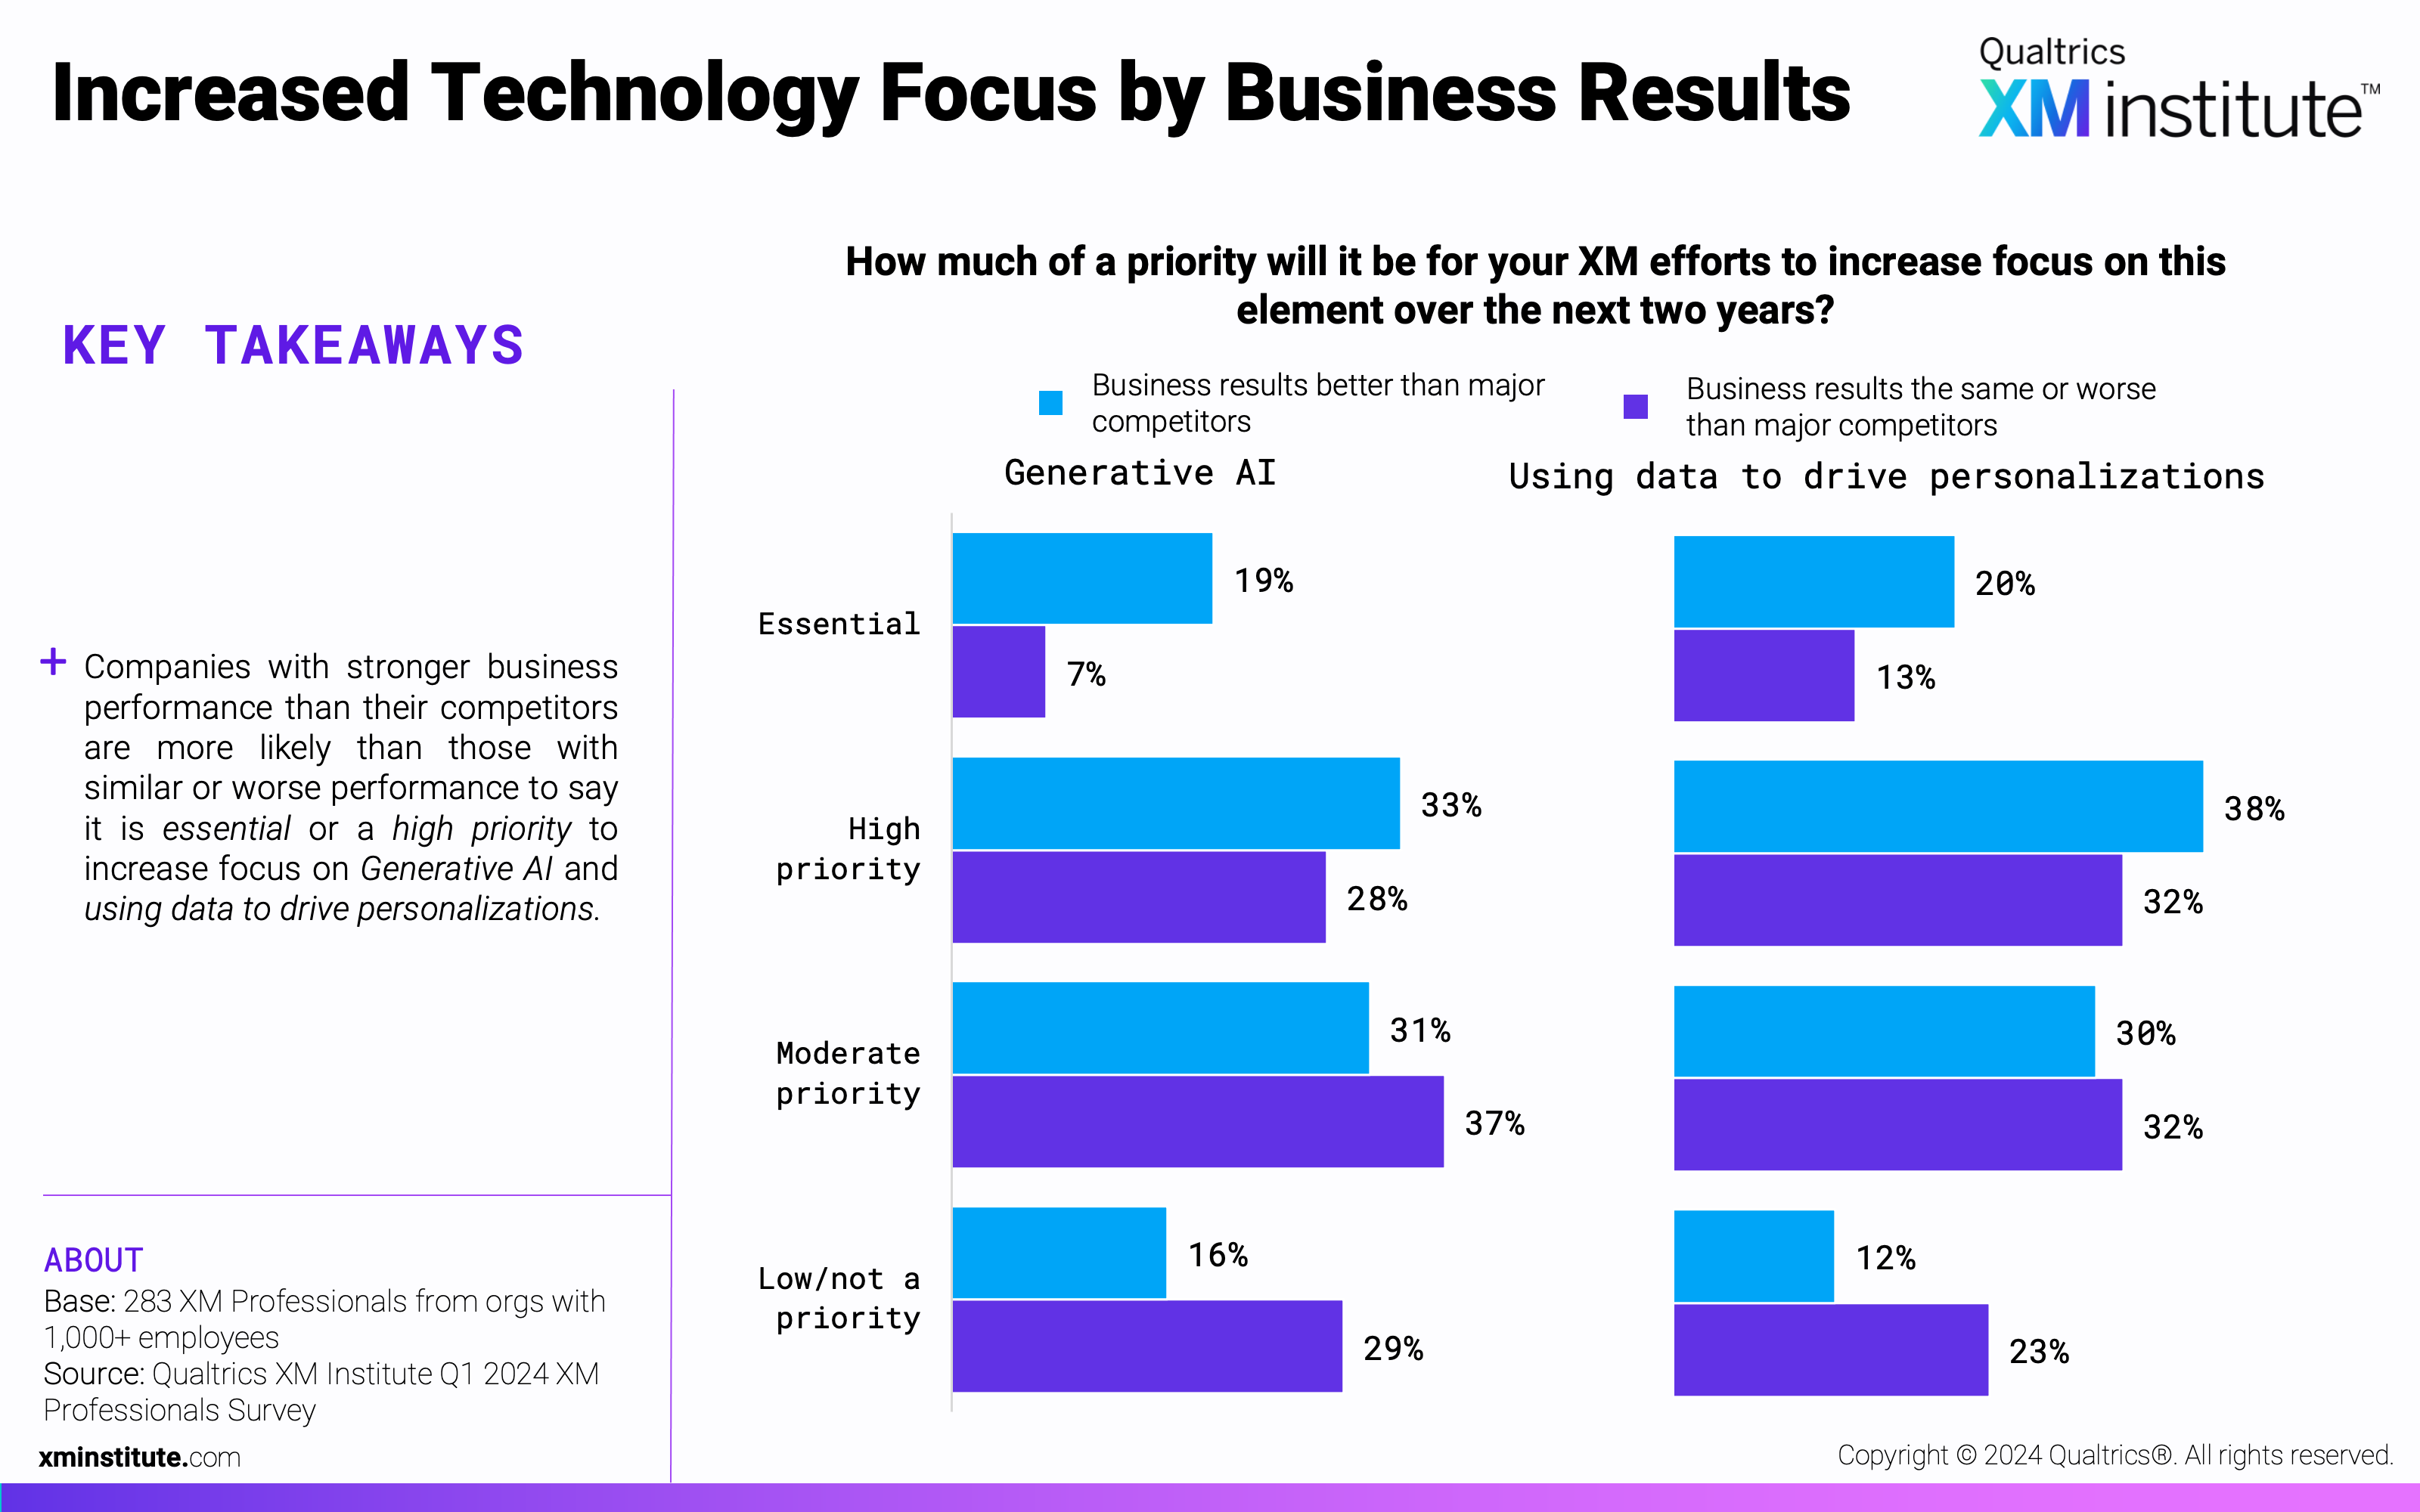
- Increased Technology Focus by Business Results
- Customer Trust Measurement by Business Results
- XM Ambition by Business Results
- Methodology