Key Findings
As part of our annual US Consumer Benchmark study, we asked a demographically representative online panel of US consumers that recently interacted with companies across 22 industries to tell us the level of success, effort, and emotion they felt from that interaction and how likely they are to recommend, forgive, trust, and buy more from that company. From our analysis, we found that:
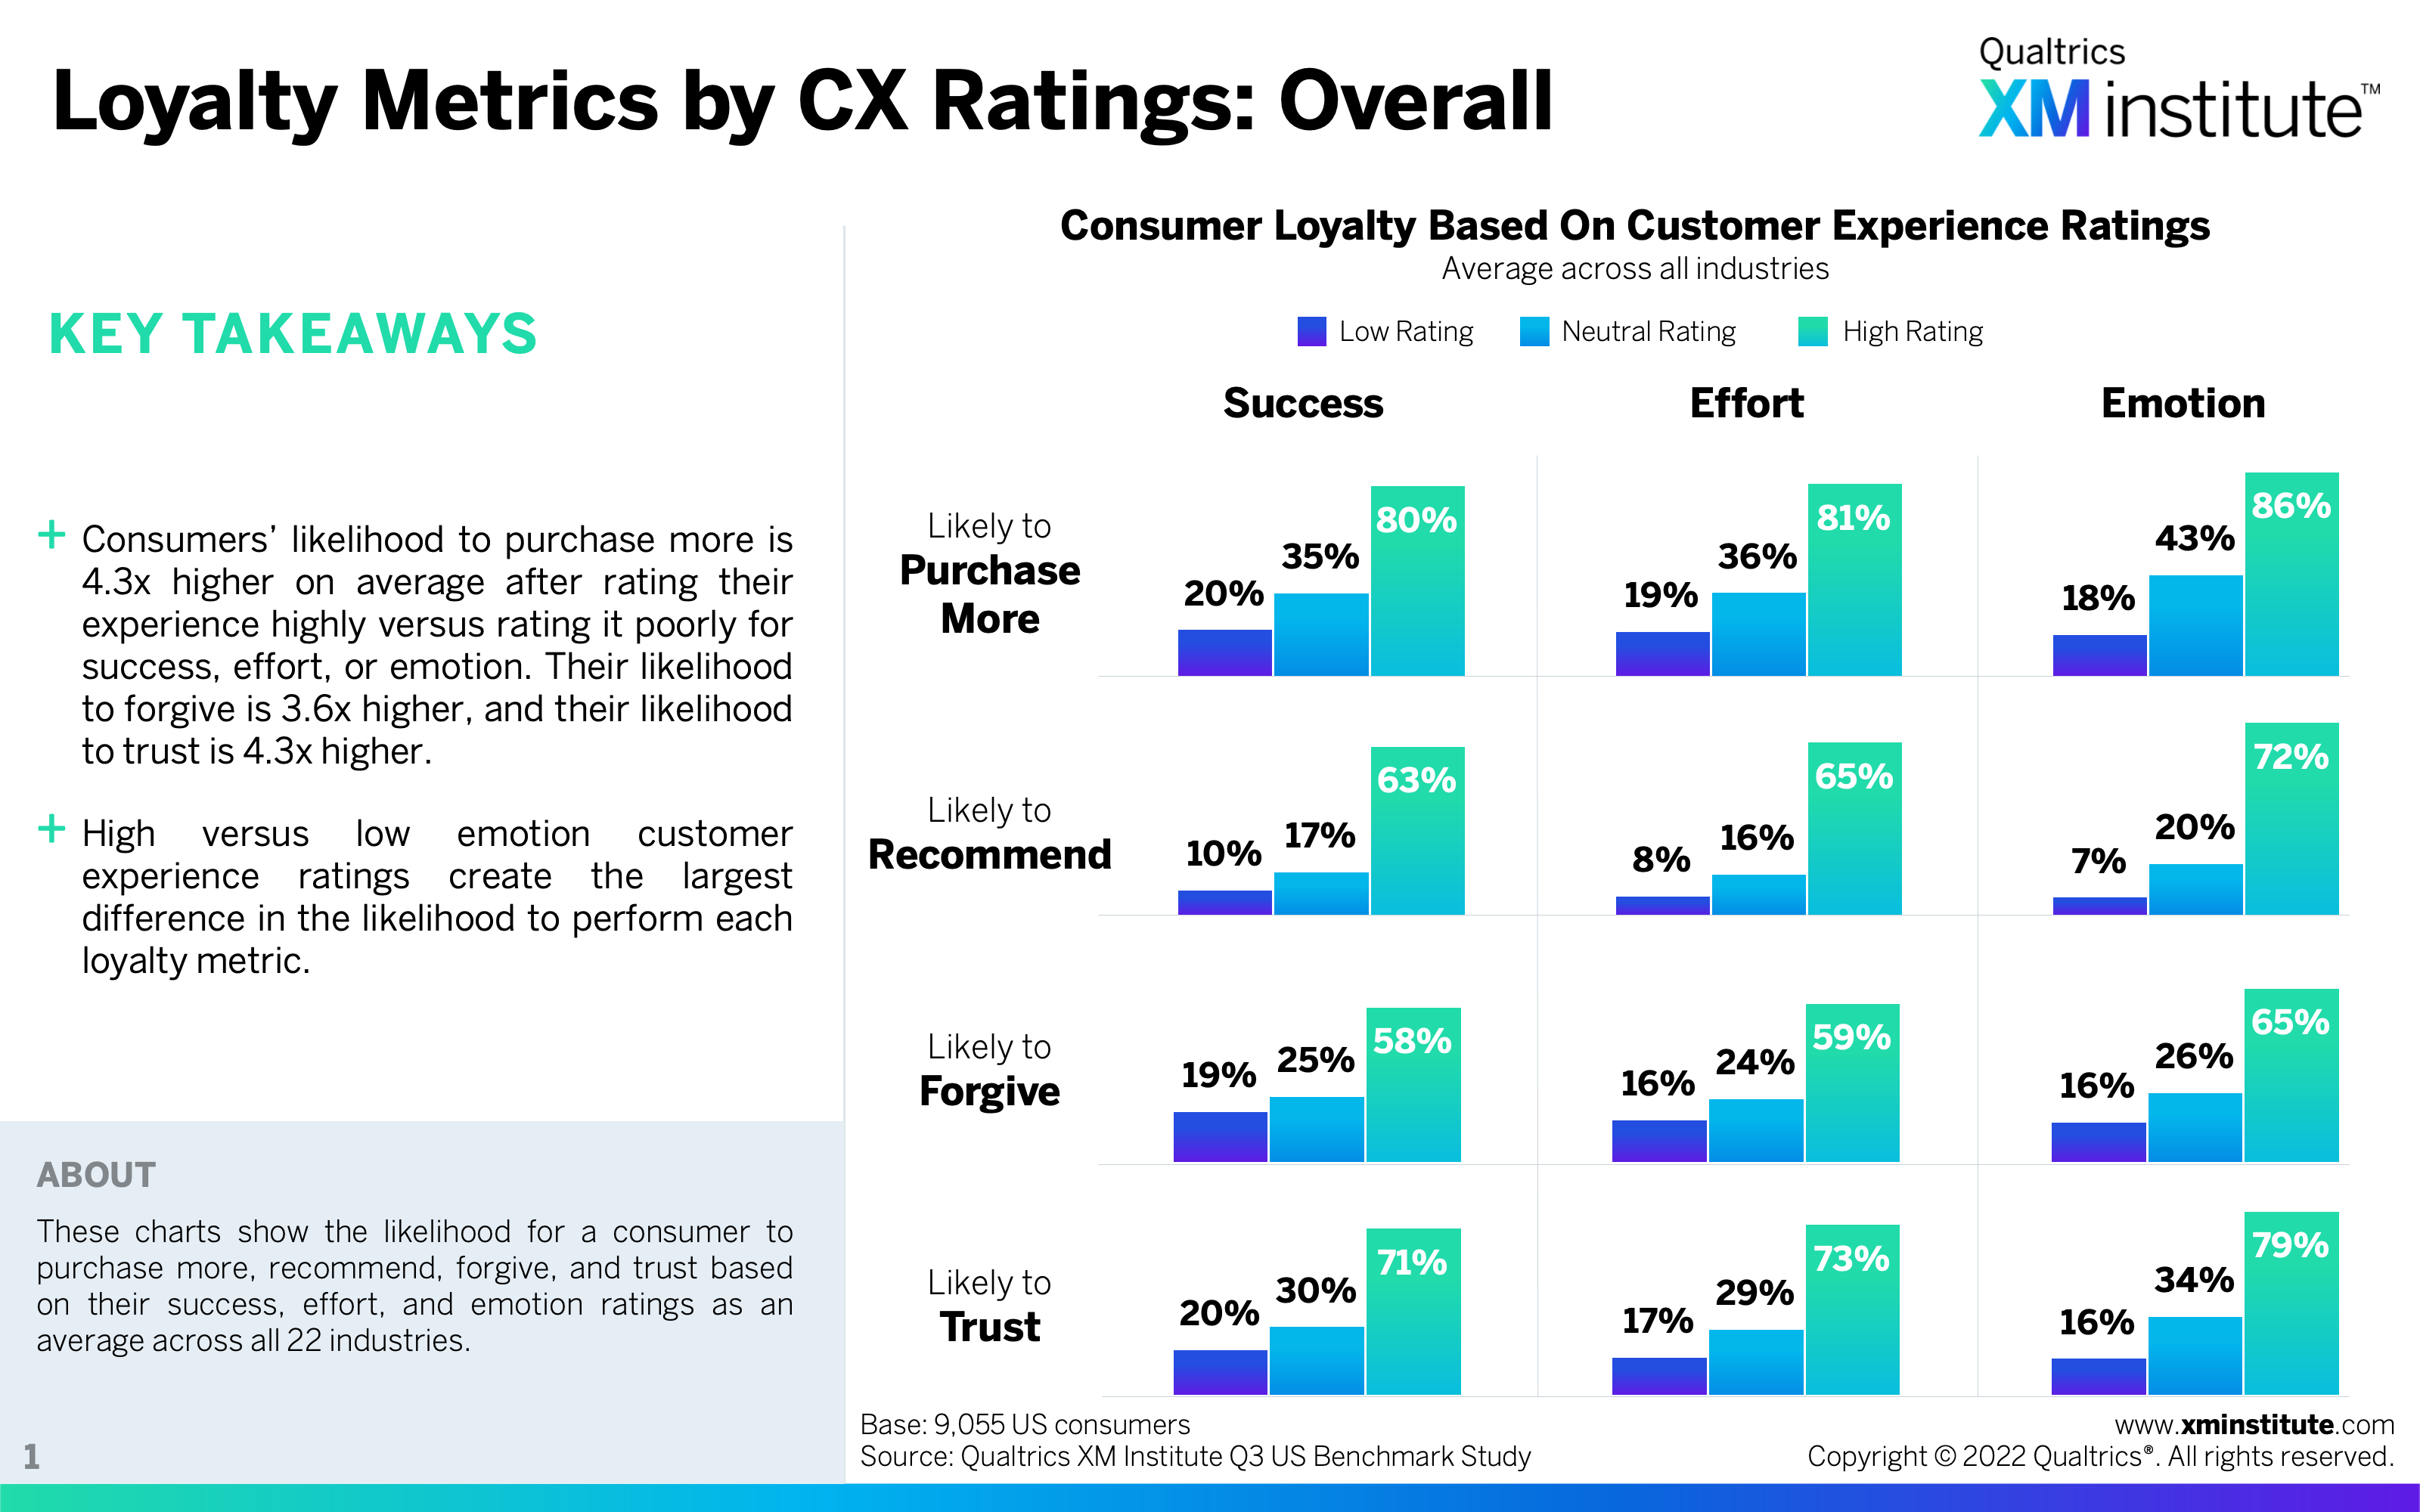
- Emotion has the largest impact. Consumers with a high emotion rating are more likely to exhibit the four loyalty behaviors (likelihood to recommend, forgive, trust, and buy more) than consumers with high success or effort ratings. Across all industries, emotion most highly correlates with likelihood to purchase more, with 86% that had a high emotion rating likely to do so.
- Effort and Success also have positive effects. On average across all industries, effort and success have a strong positive impact on all loyalty behaviors. These customer experience components have the highest correlation with a consumer’s likelihood to purchase more; 80% of consumers with a high success rating are likely to purchase more while only 20% with a low success rating are likely to do so. These numbers are 81% and 19% respectively for effort.
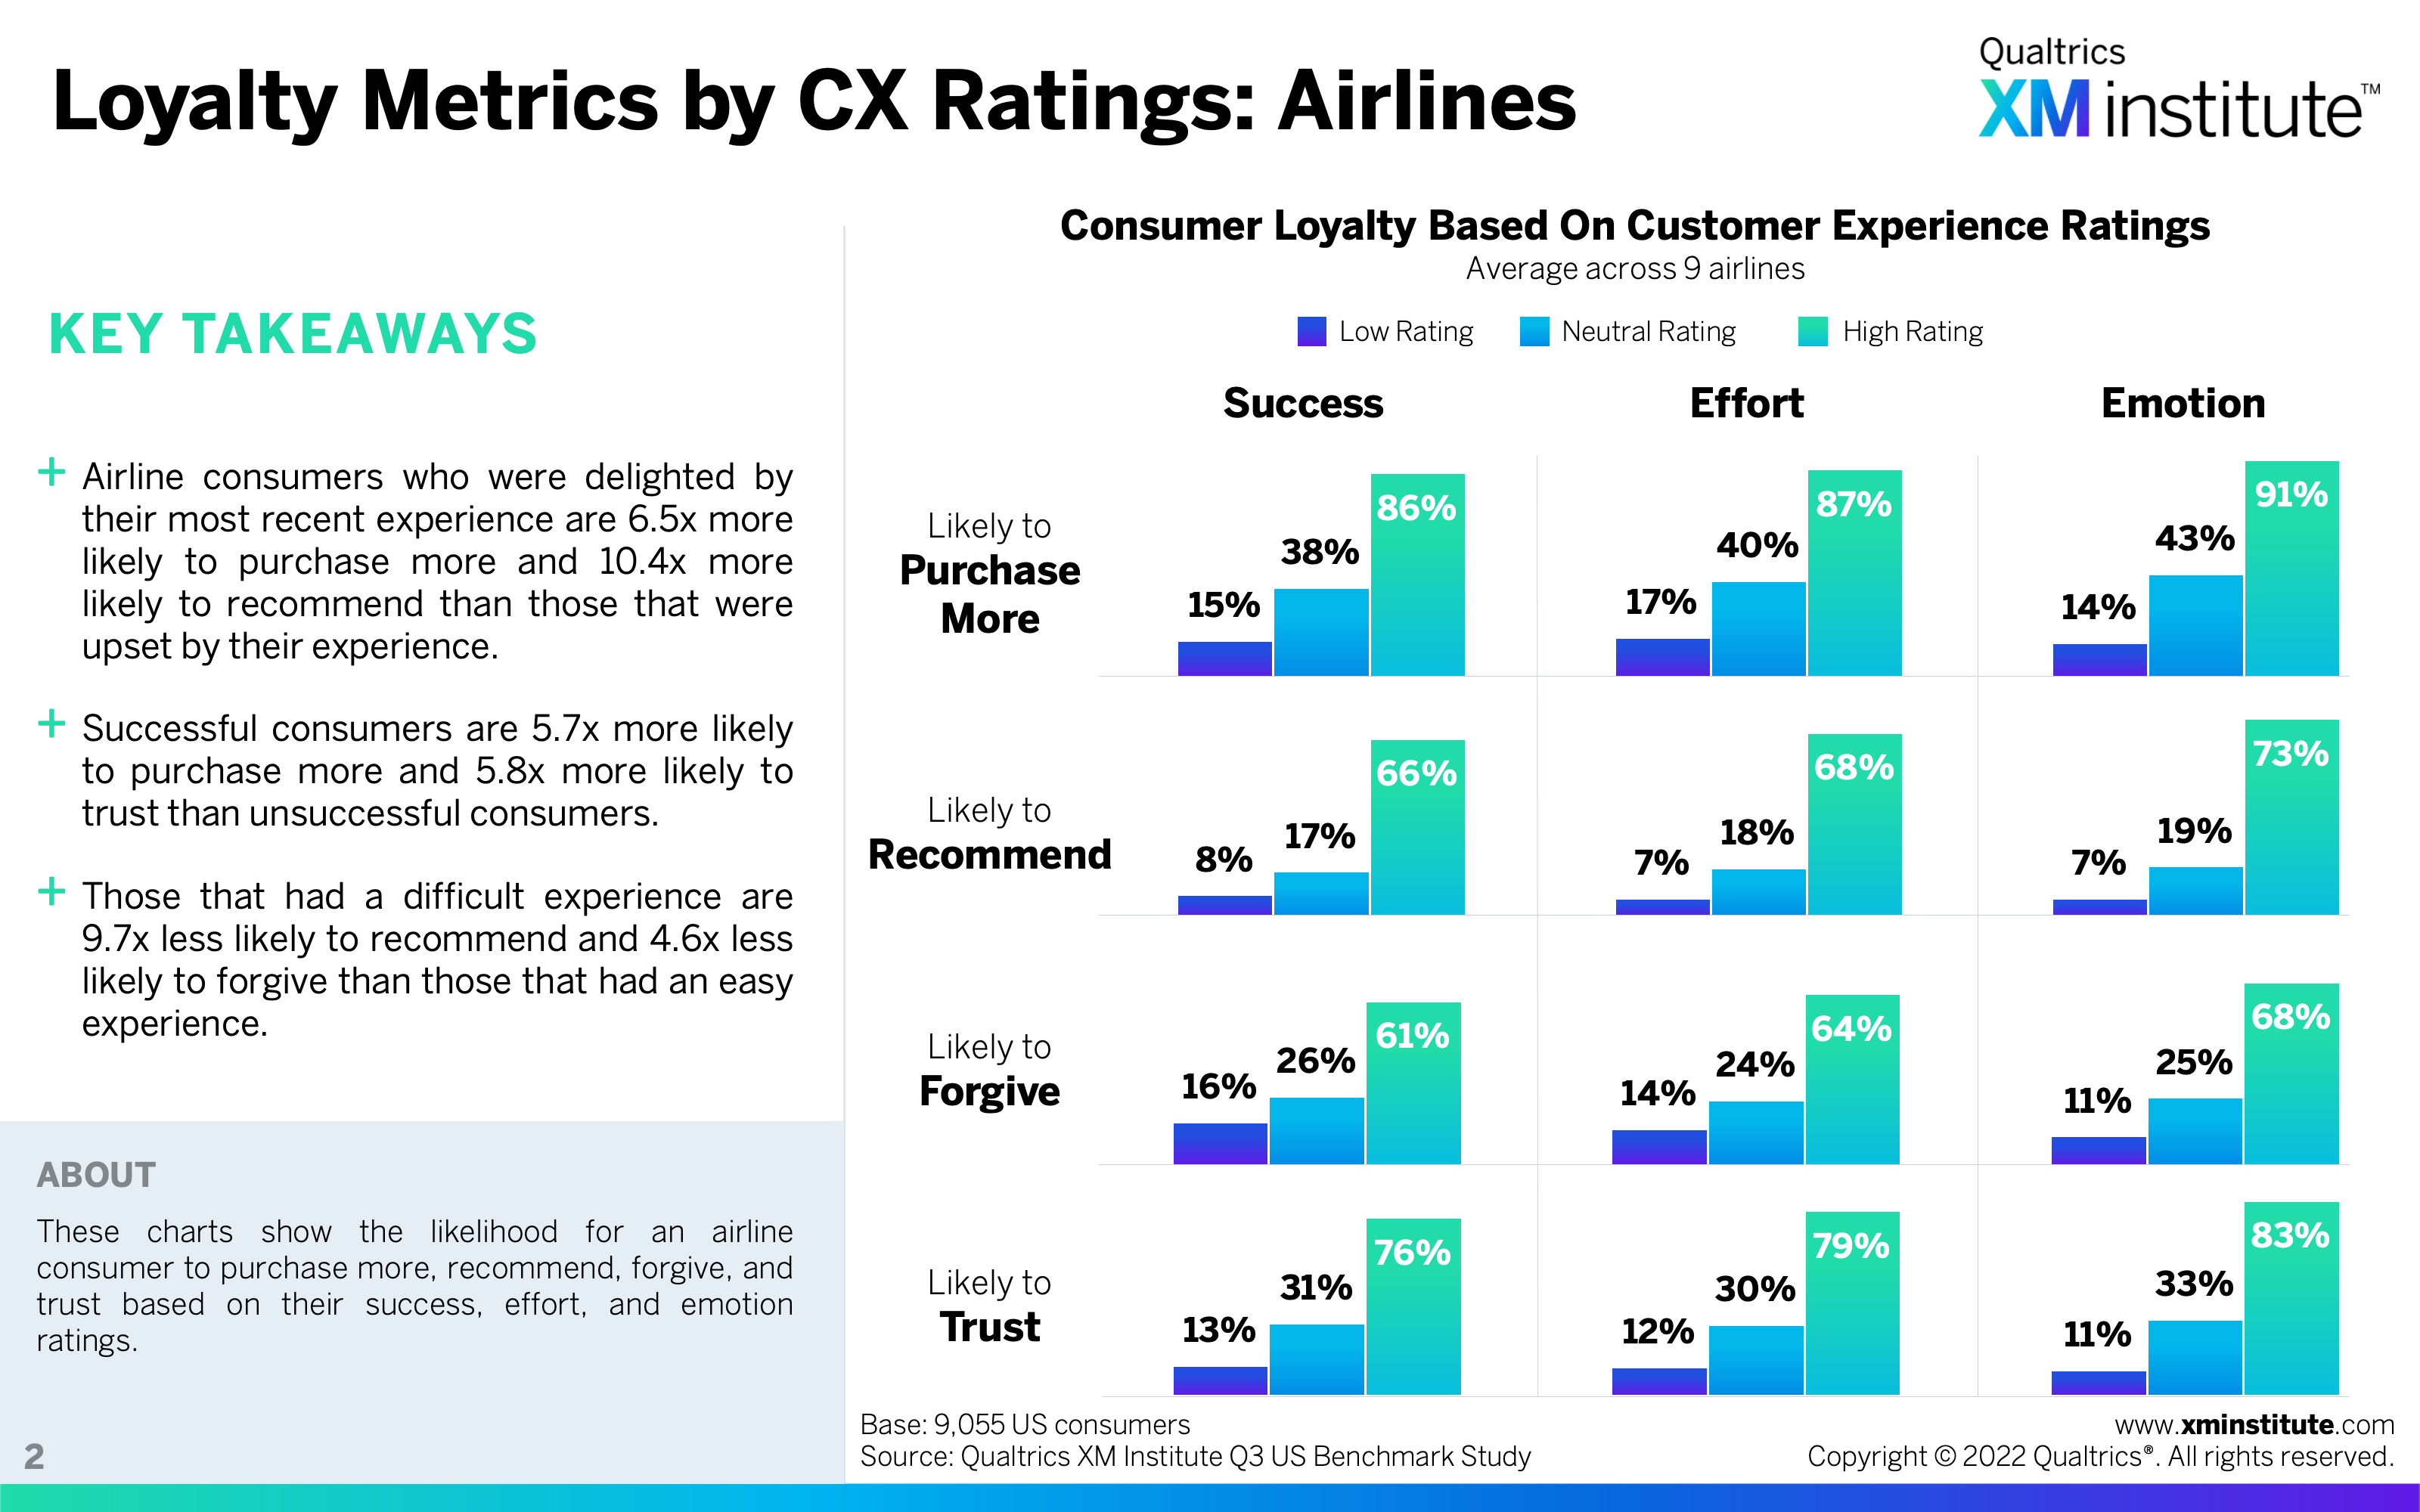
- Airline loyalty is most affected by consumer experience. Across the four loyalty metrics, the largest average gaps between high and low success, effort, and emotion ratings are in the airline industry. Consumers with high success ratings are 59 percentage-points more likely to exhibit loyalty behaviors. This gap stands at 62 points and 68 points for emotion and effort ratings, respectively.
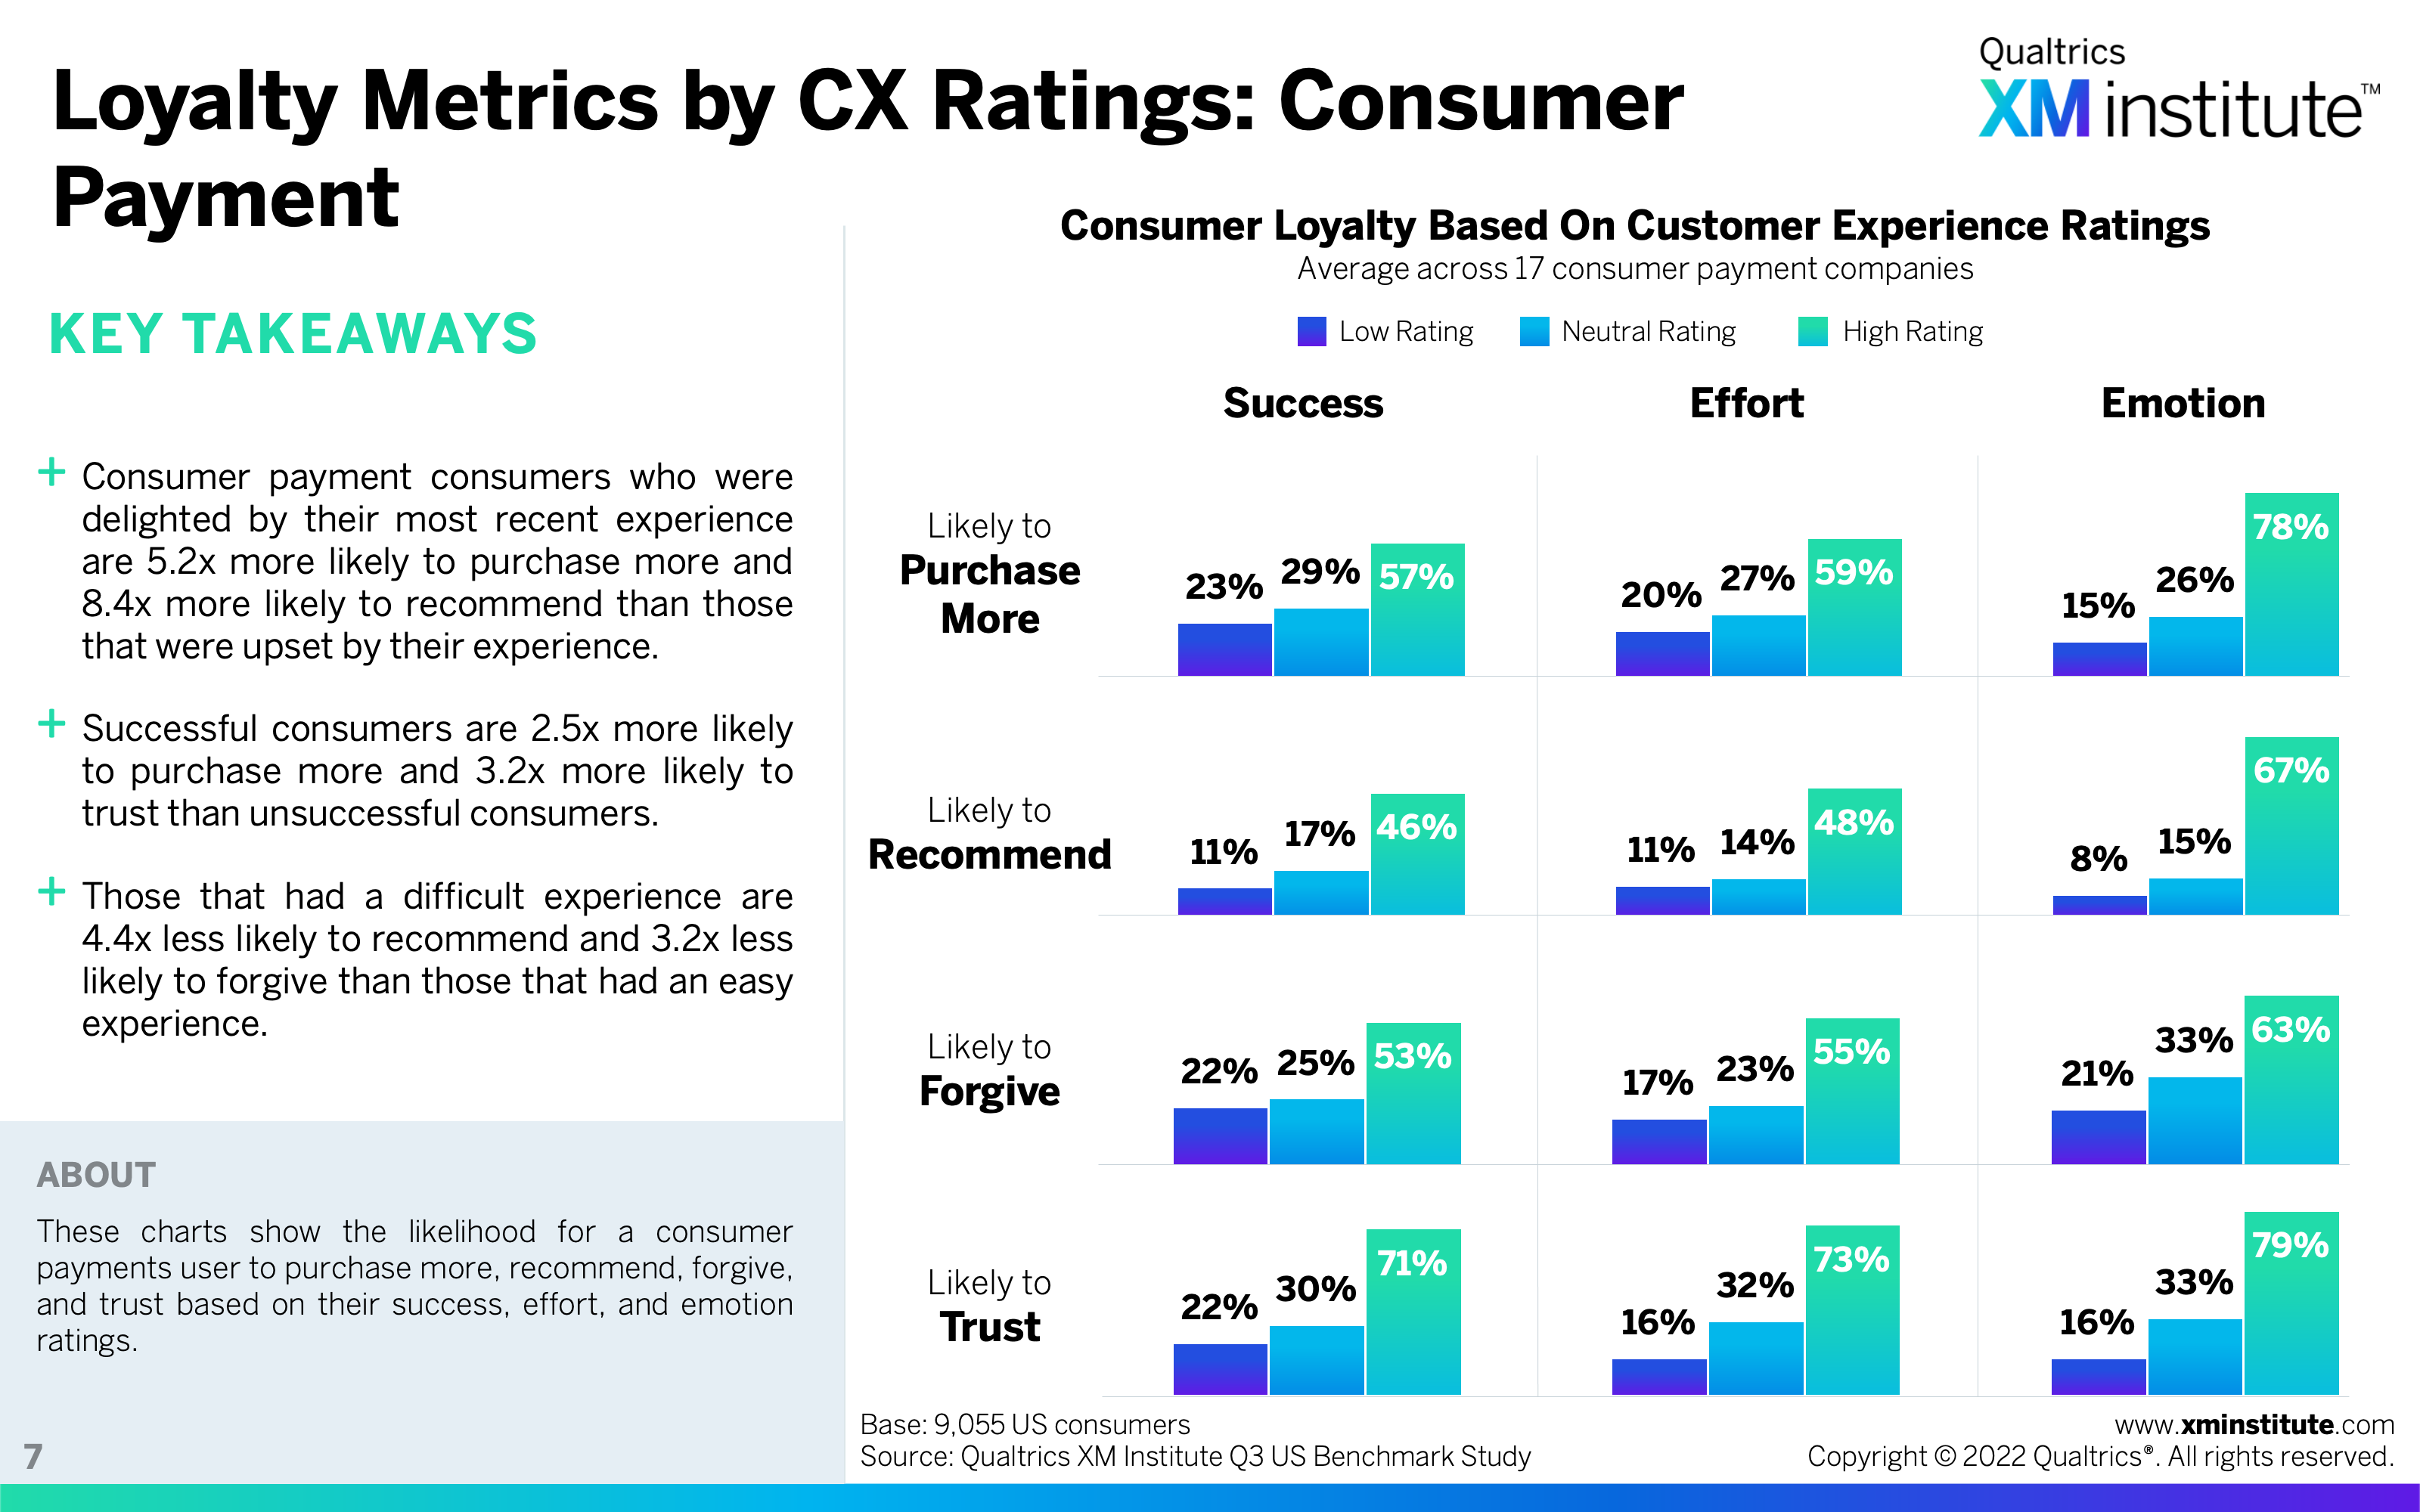
- Consumer payment loyalty is least affected by consumer experience. Consumers with high effort ratings are on average 42 points more likely than those with low effort ratings to recommend, forgive, trust, and buy more – the smallest gap across all 22 industries. Consumers with high success ratings are 39 points more likely to exhibit these behaviors, and high emotion rates garner a 53 point gap, which are each the smallest gaps present for the component.
Figures
Here are the figures in this Data Snapshot:
- Loyalty Metrics by CX Ratings: Overall
- Loyalty Metrics by CX Ratings: Airlines
- Loyalty Metrics by CX Ratings: Auto

- Loyalty Metrics by CX Ratings: Bank
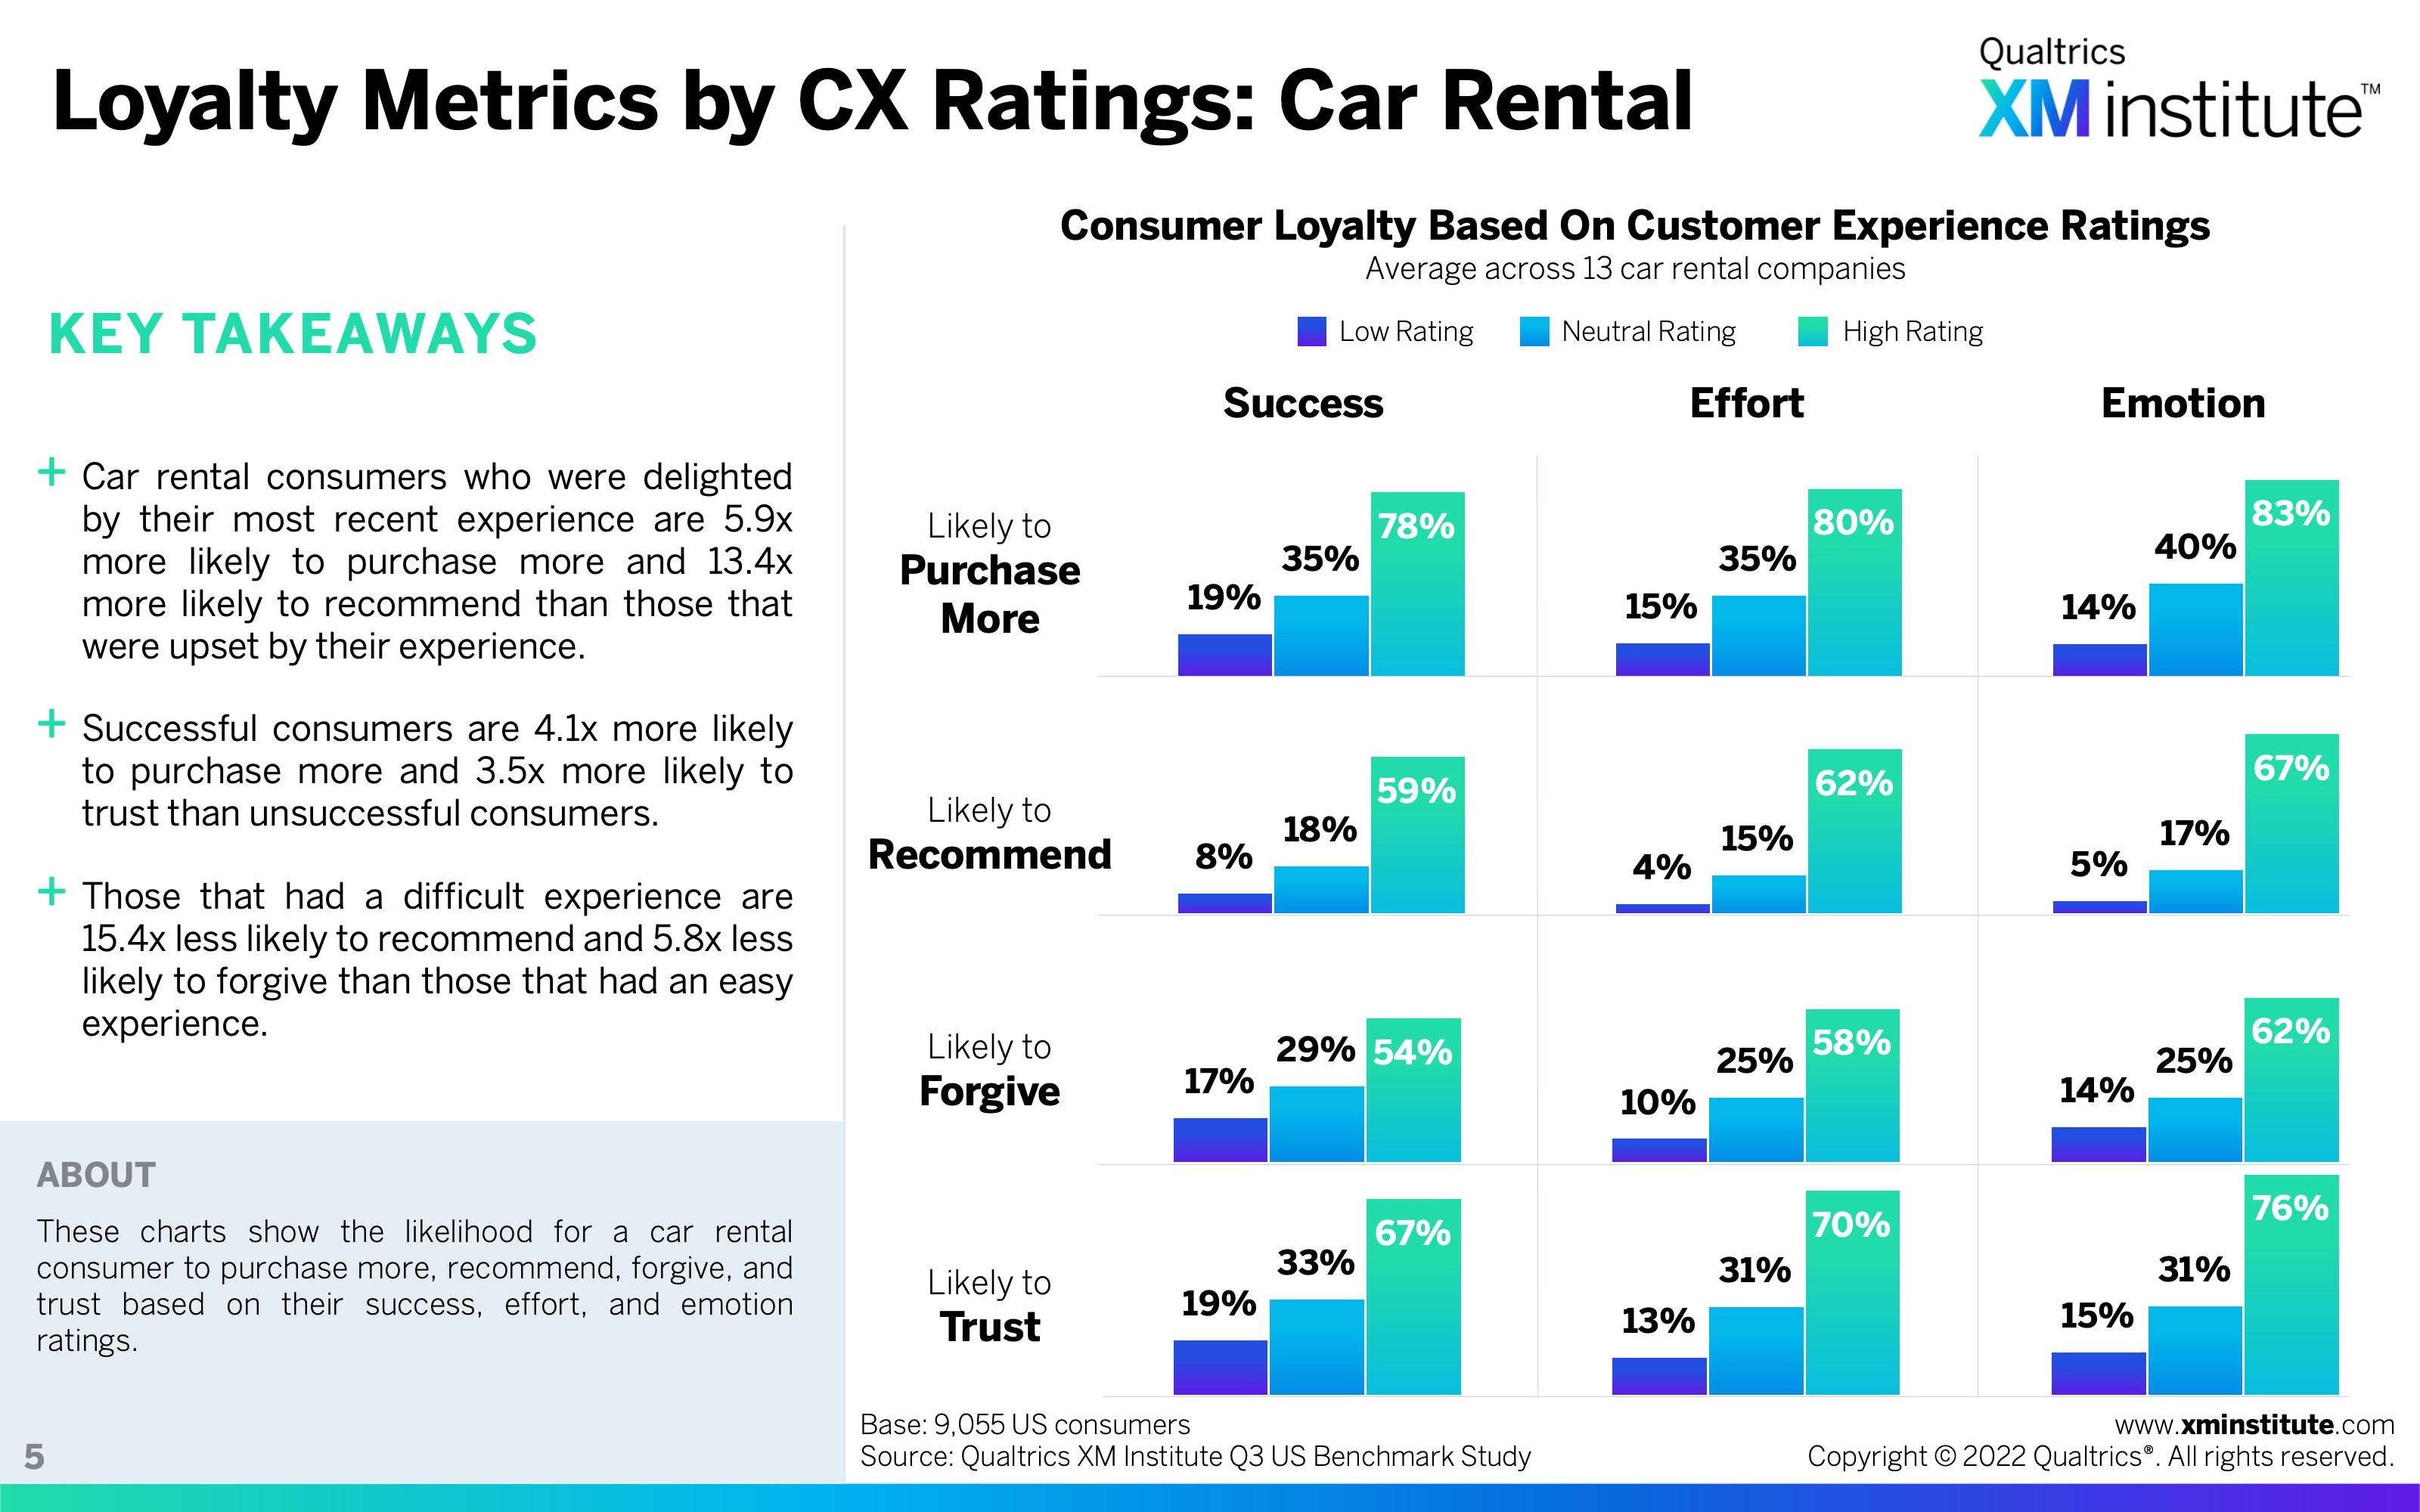
- Loyalty Metrics by CX Ratings: Car Rental
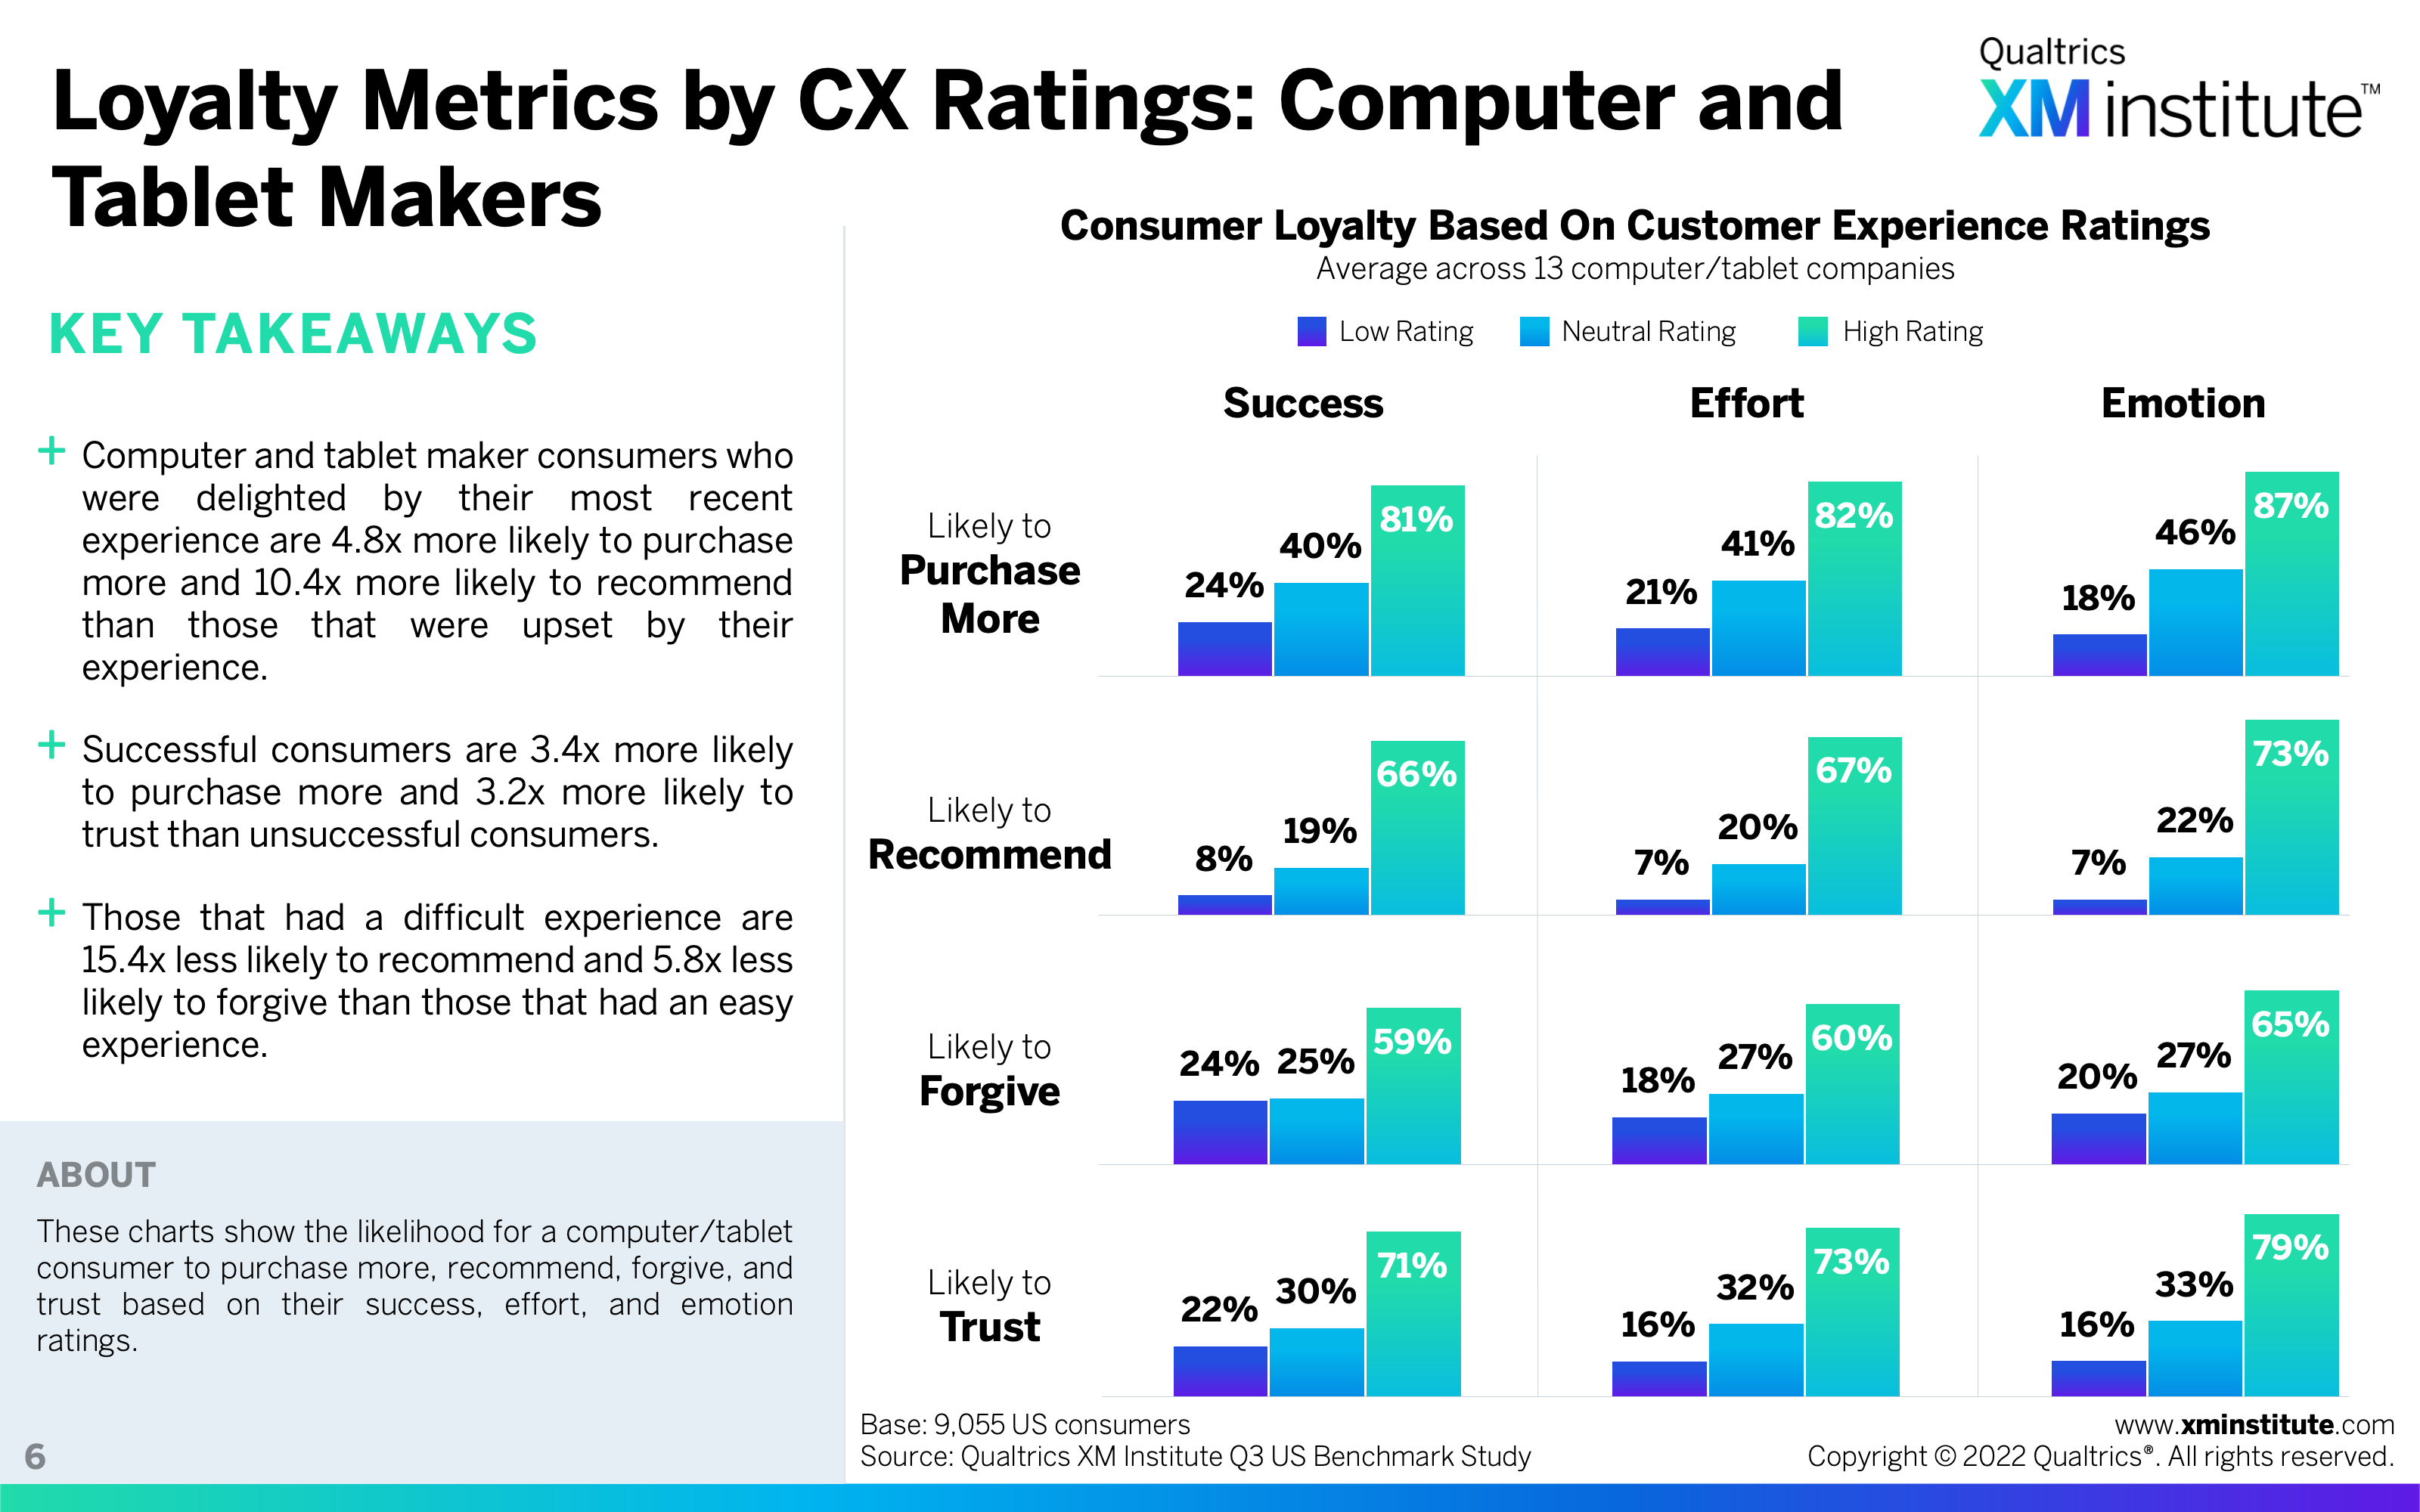
- Loyalty Metrics by CX Ratings: Computer and Tablet Makers
- Loyalty Metrics by CX Ratings: Consumer Payment
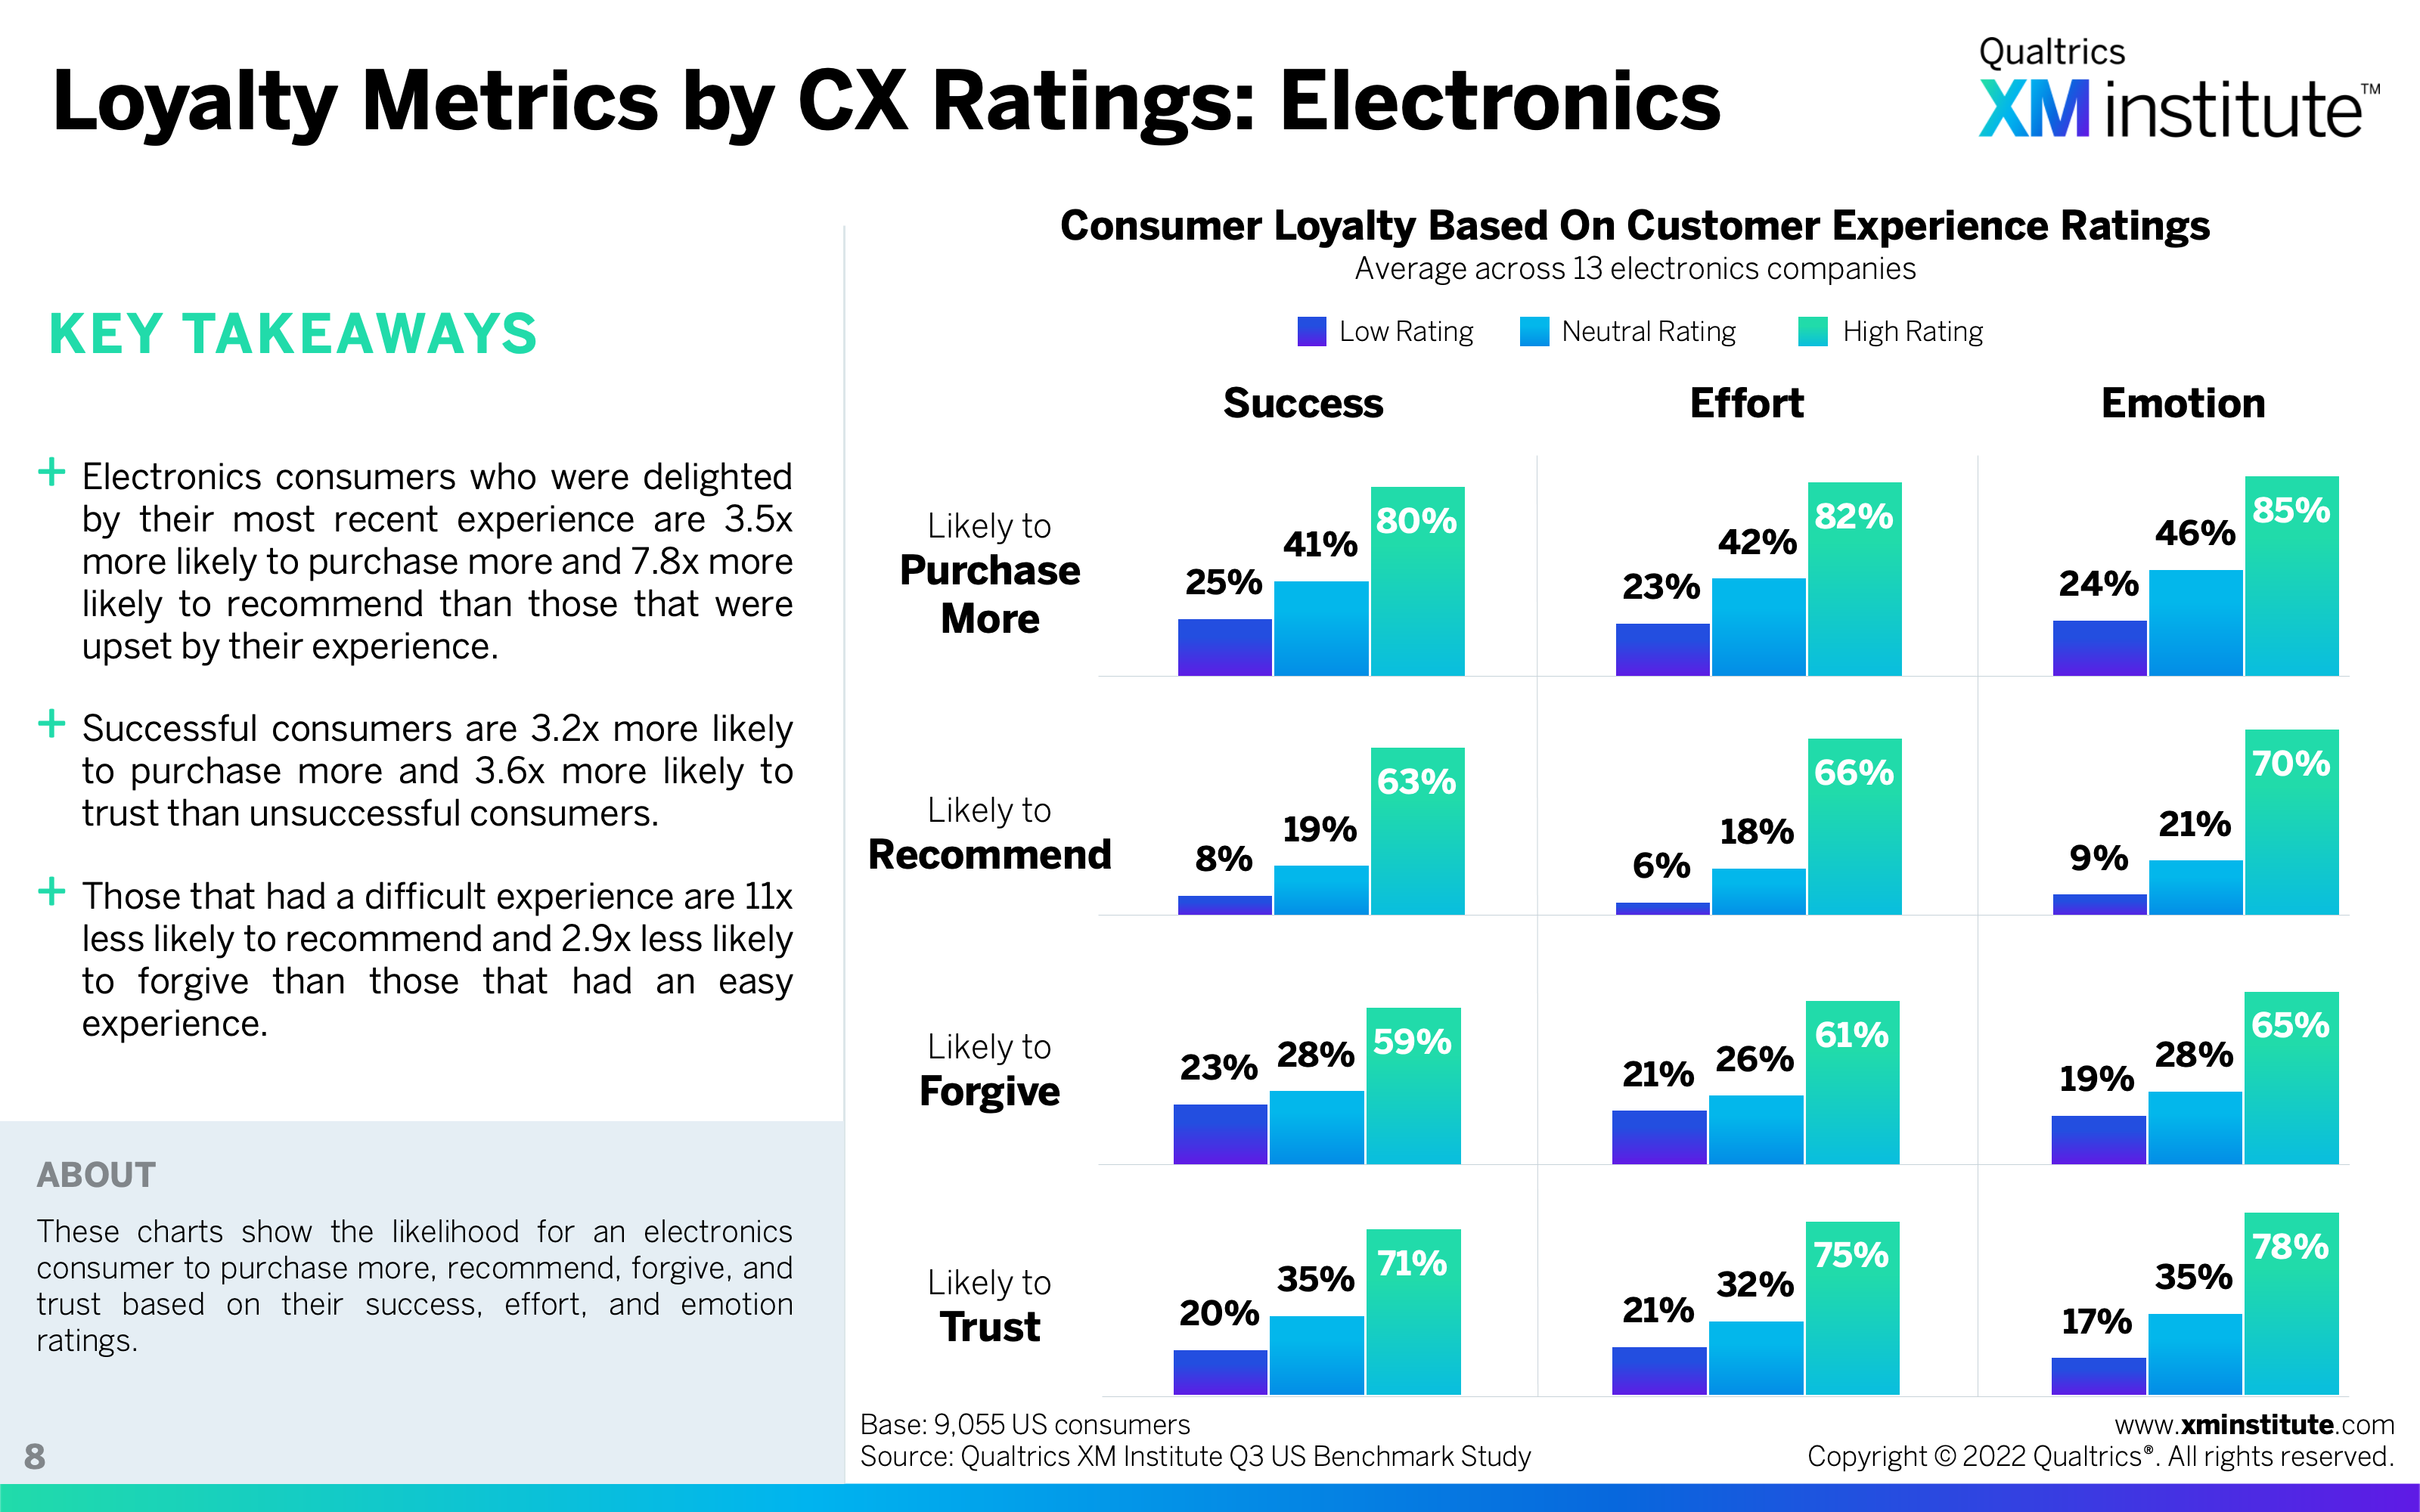
- Loyalty Metrics by CX Ratings: Electronics
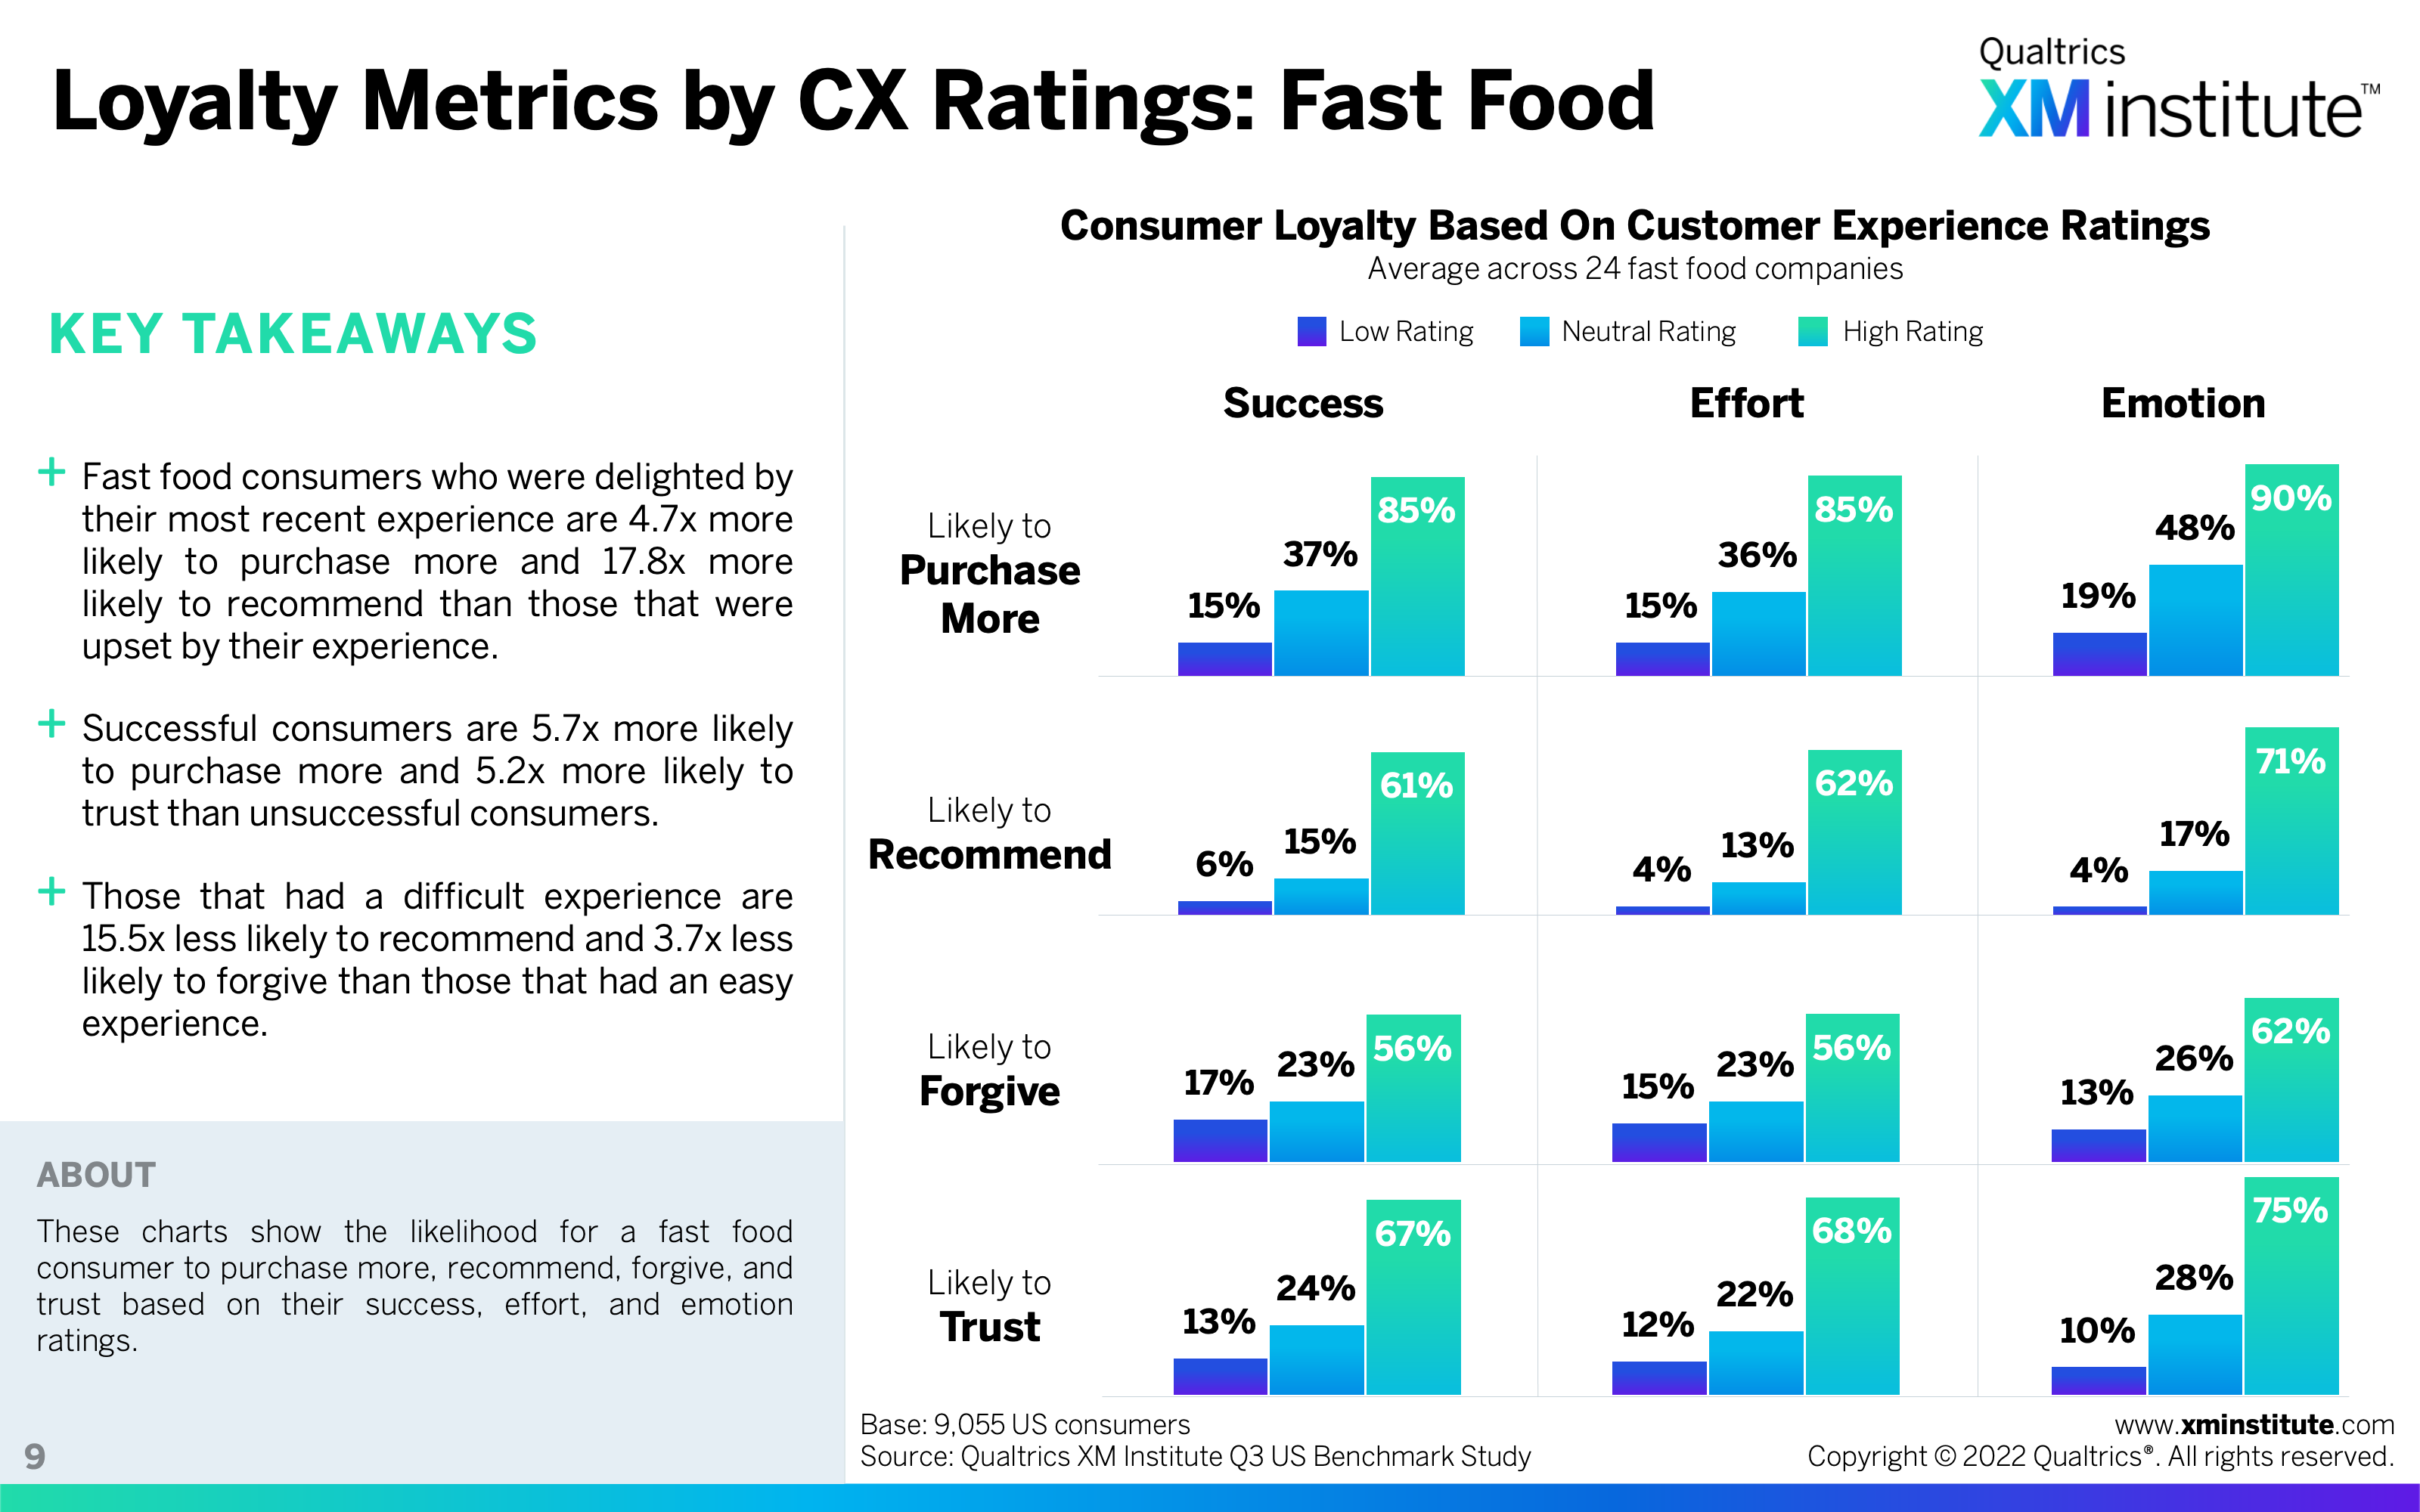
- Loyalty Metrics by CX Ratings: Fast Food
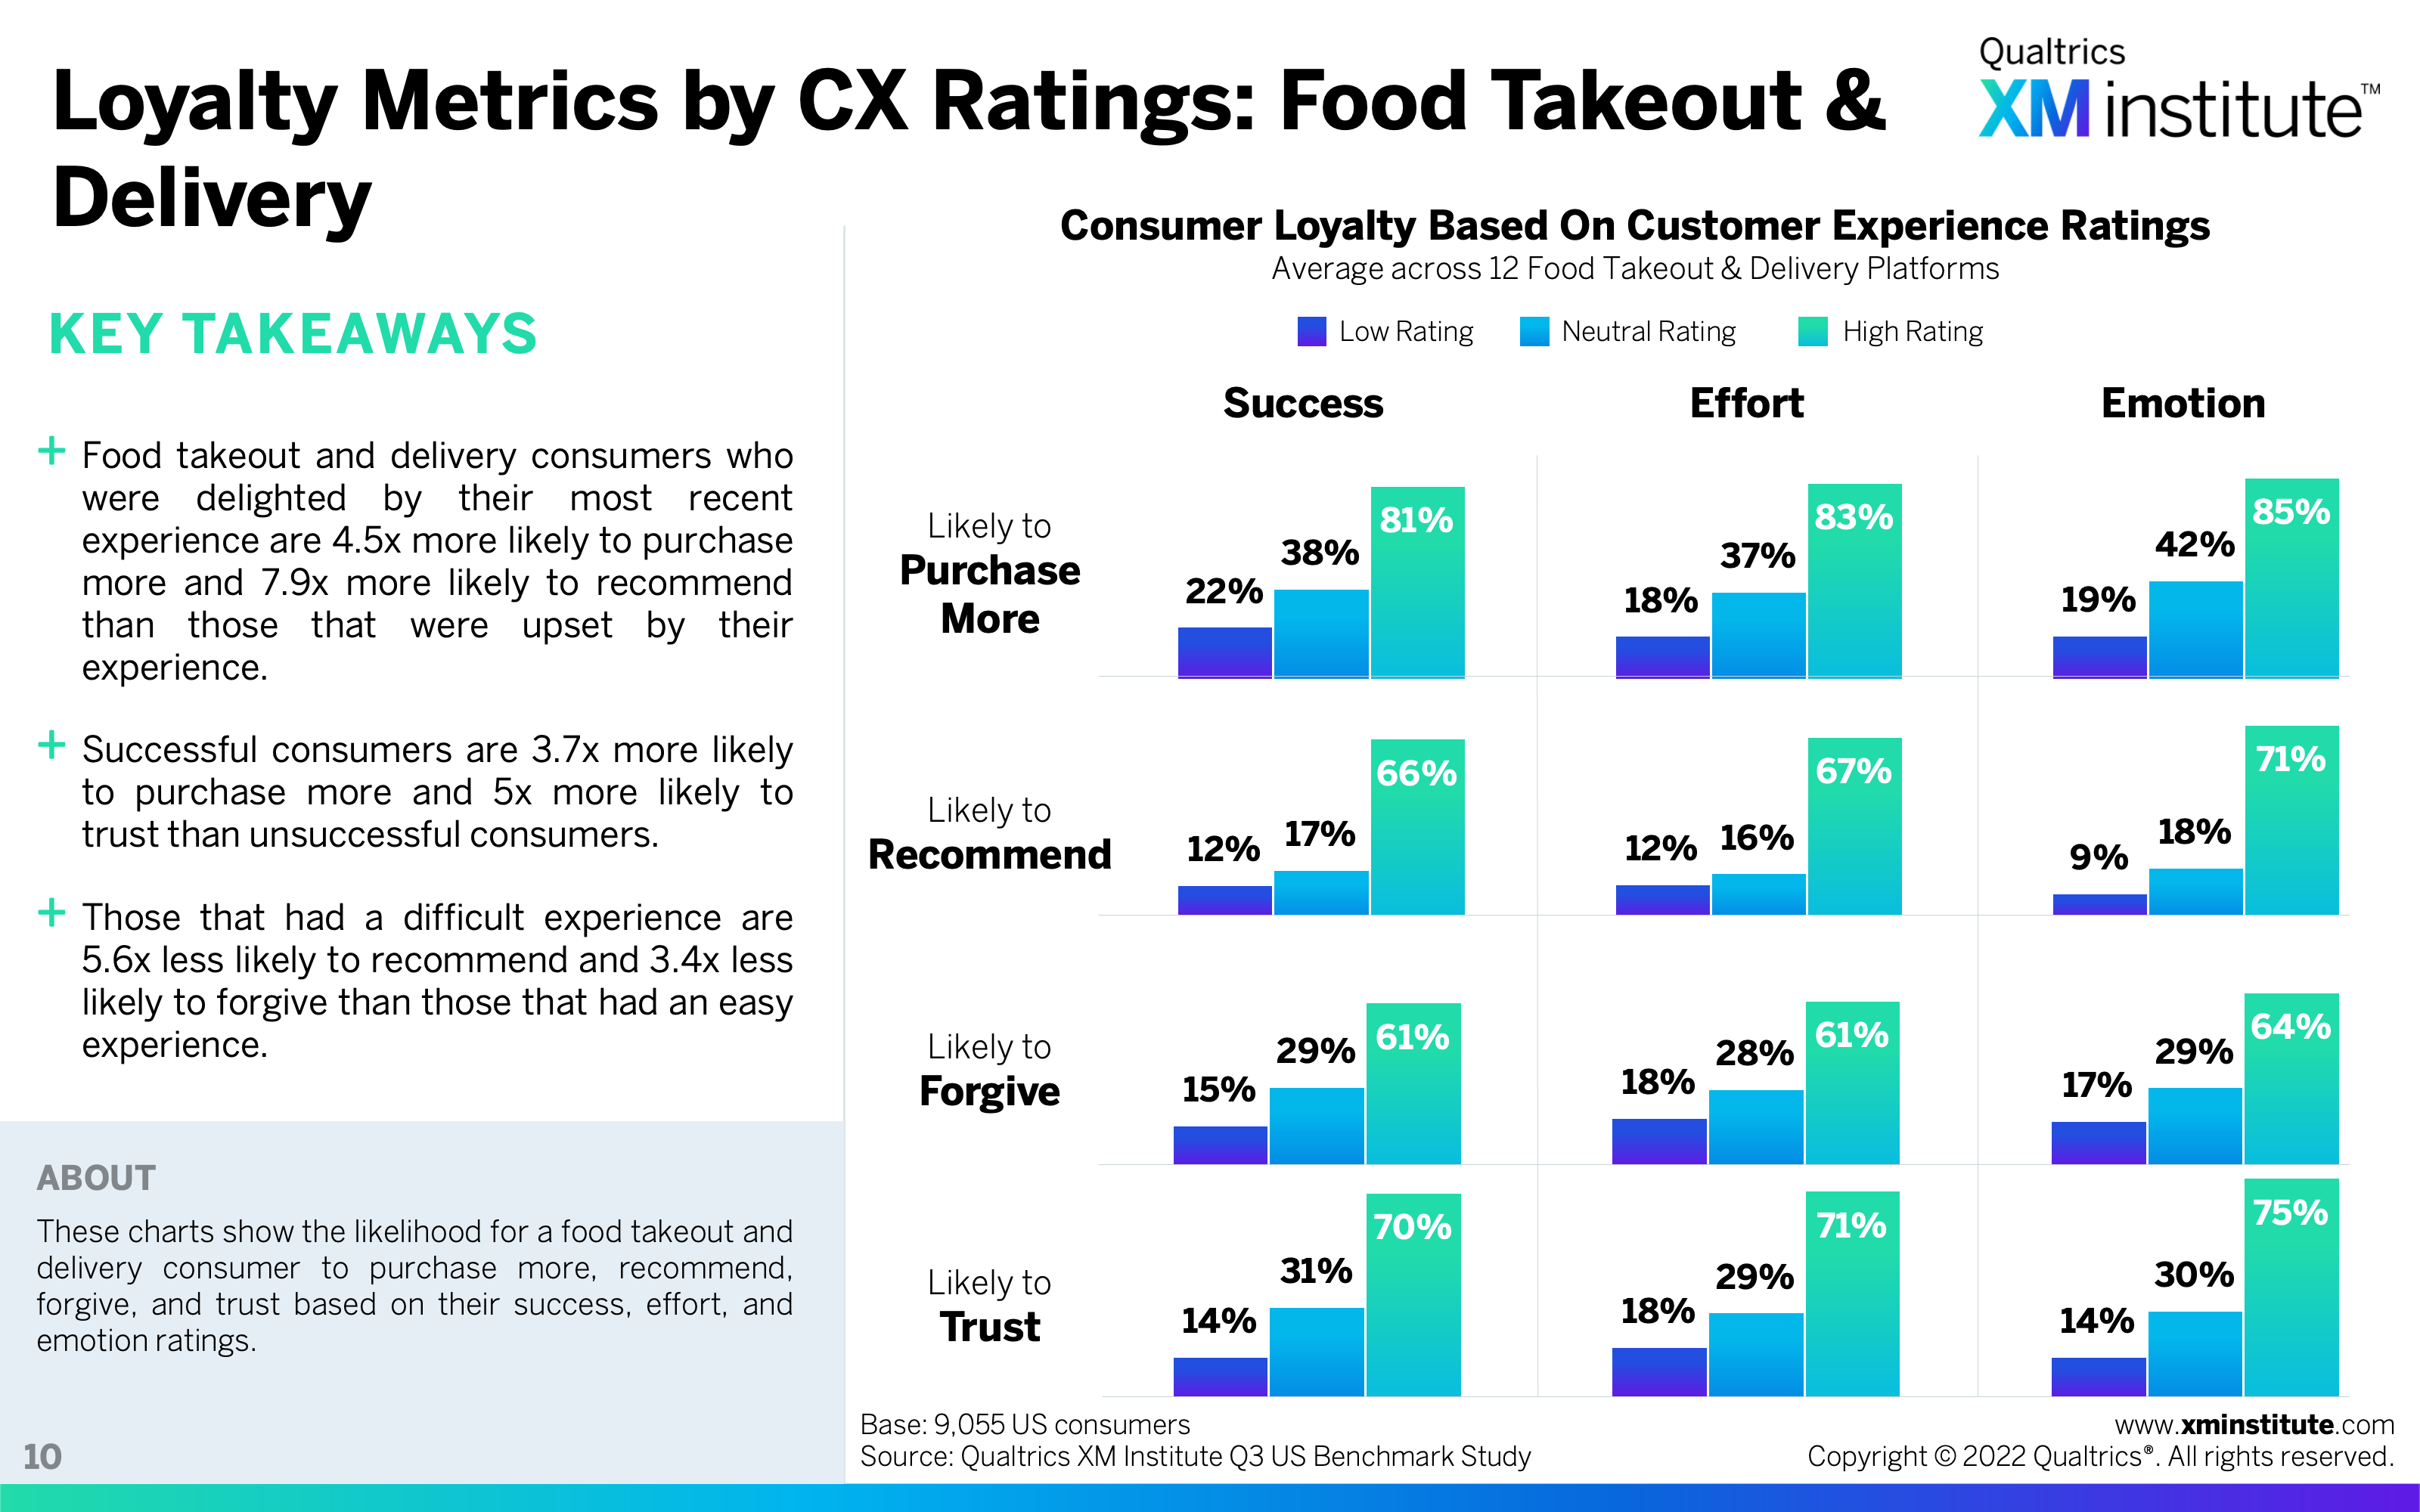
- Loyalty Metrics by CX Ratings: Food Takeout & Delivery
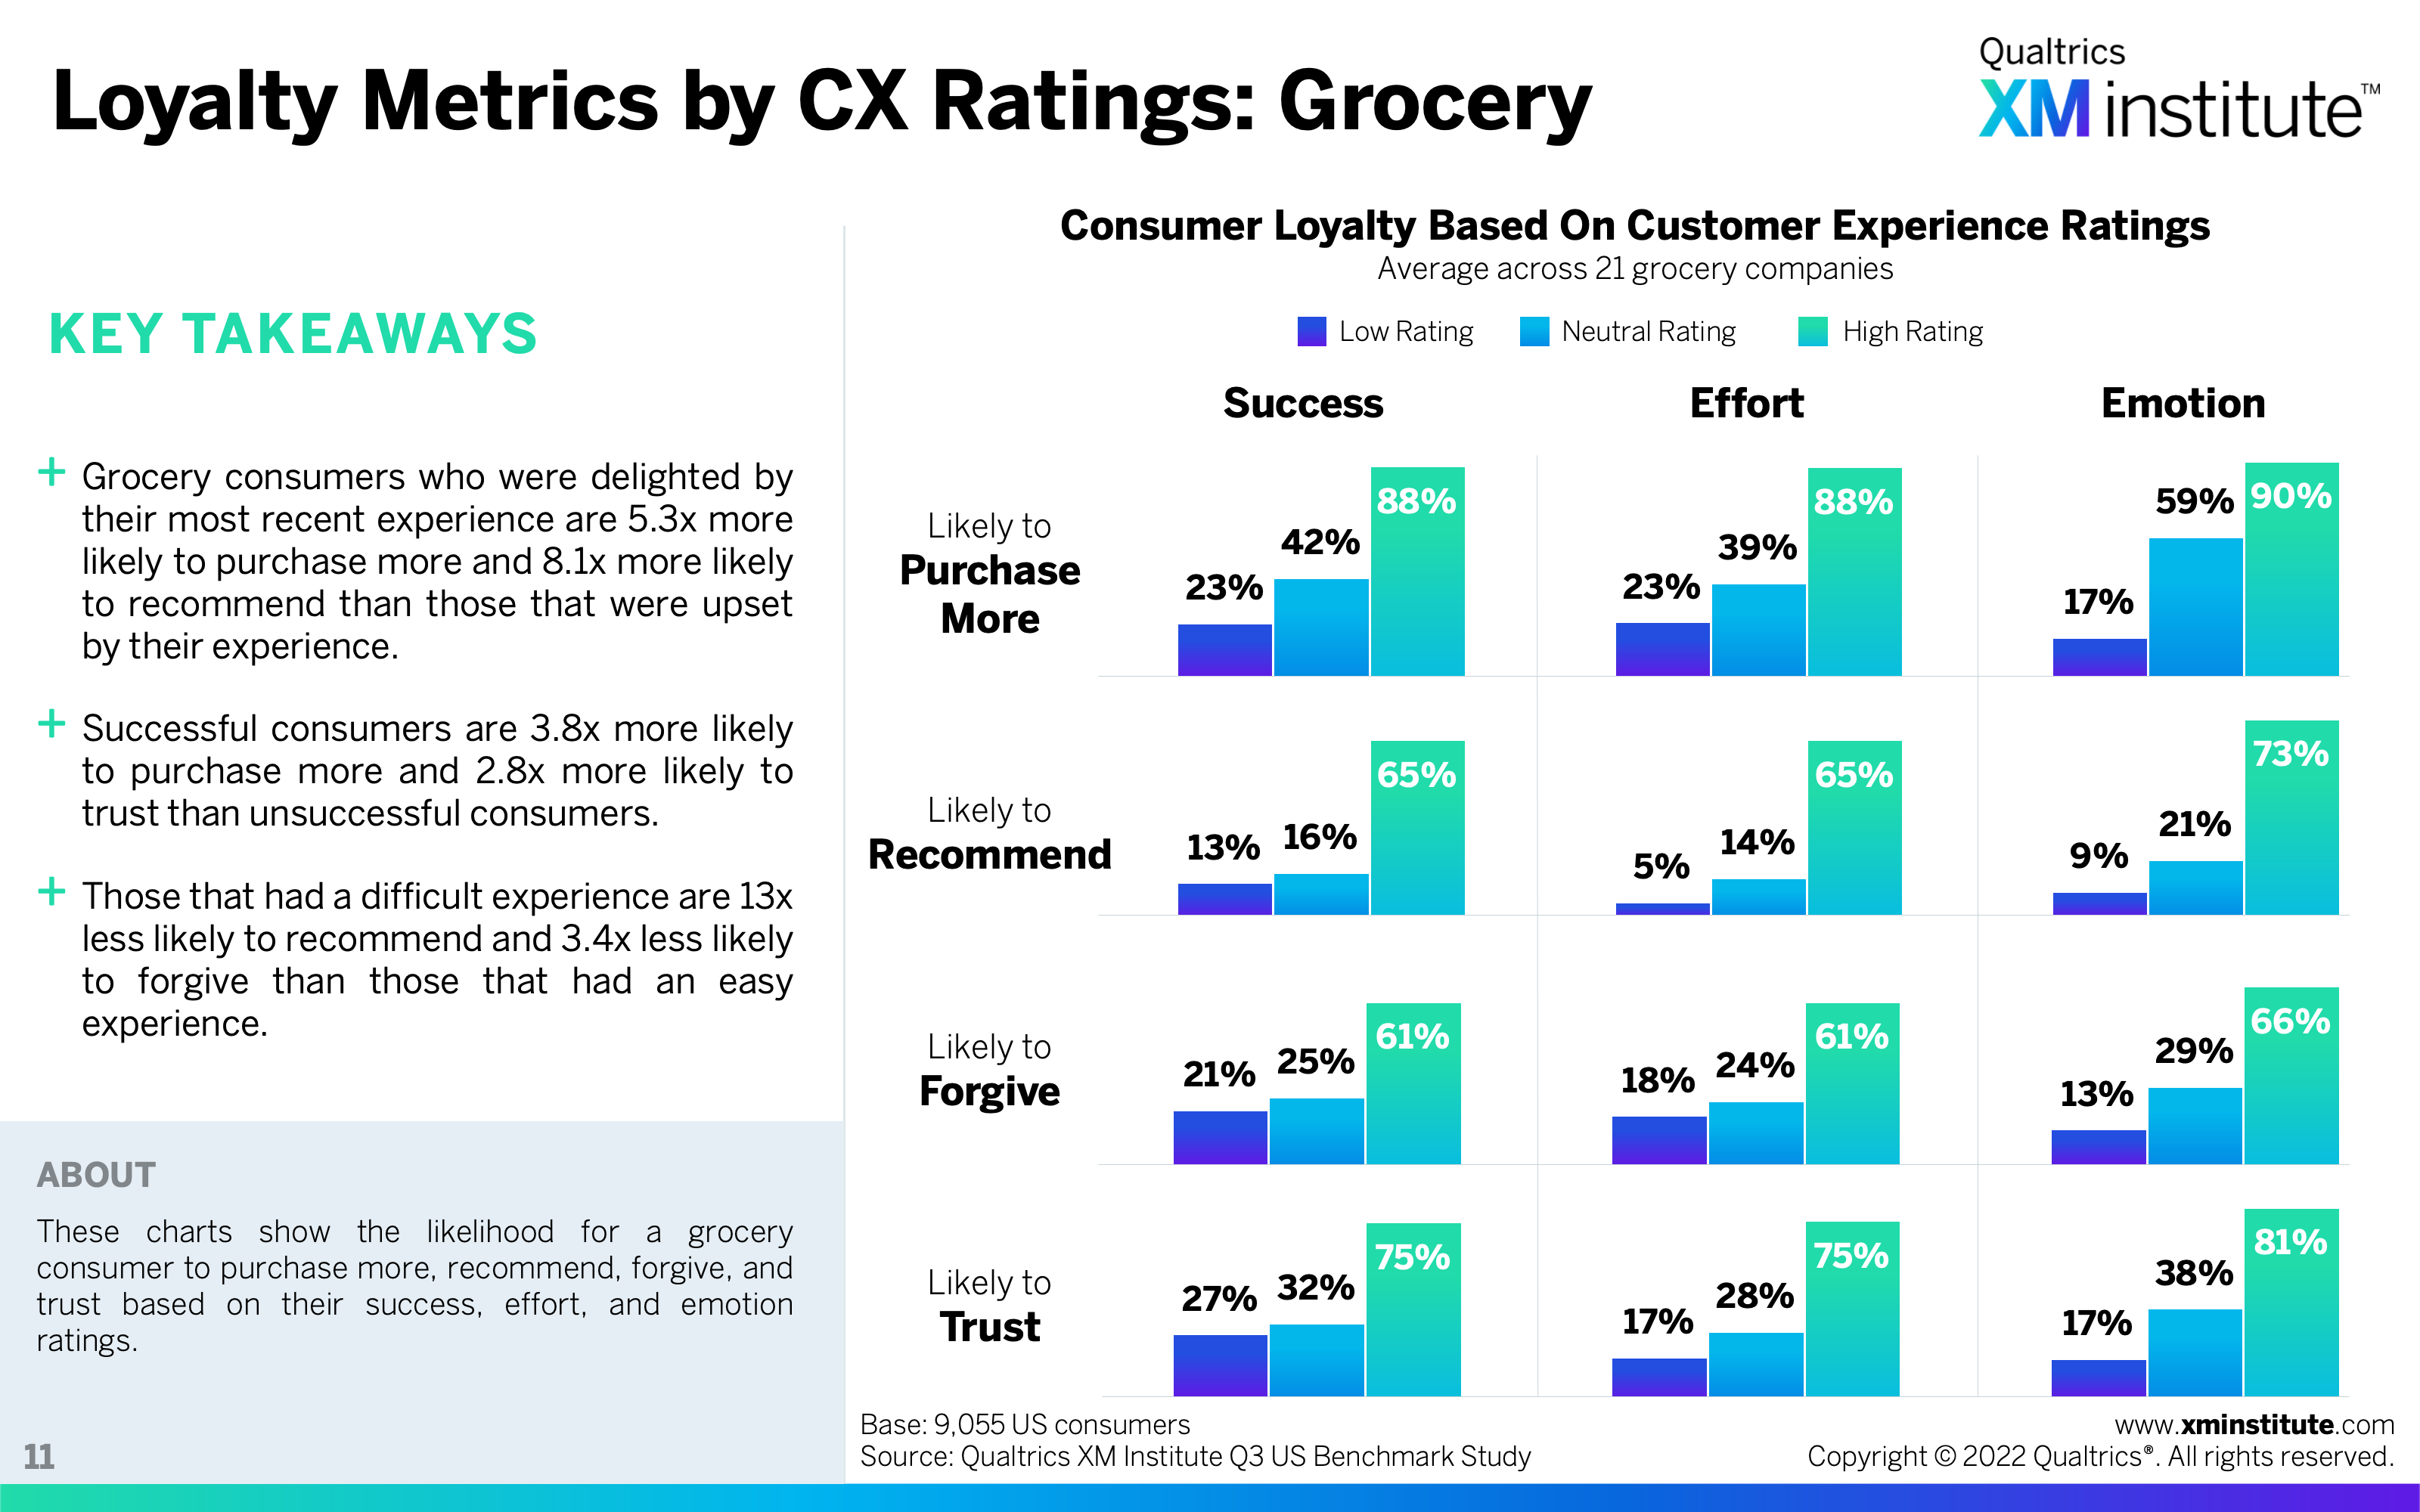
- Loyalty Metrics by CX Ratings: Grocery
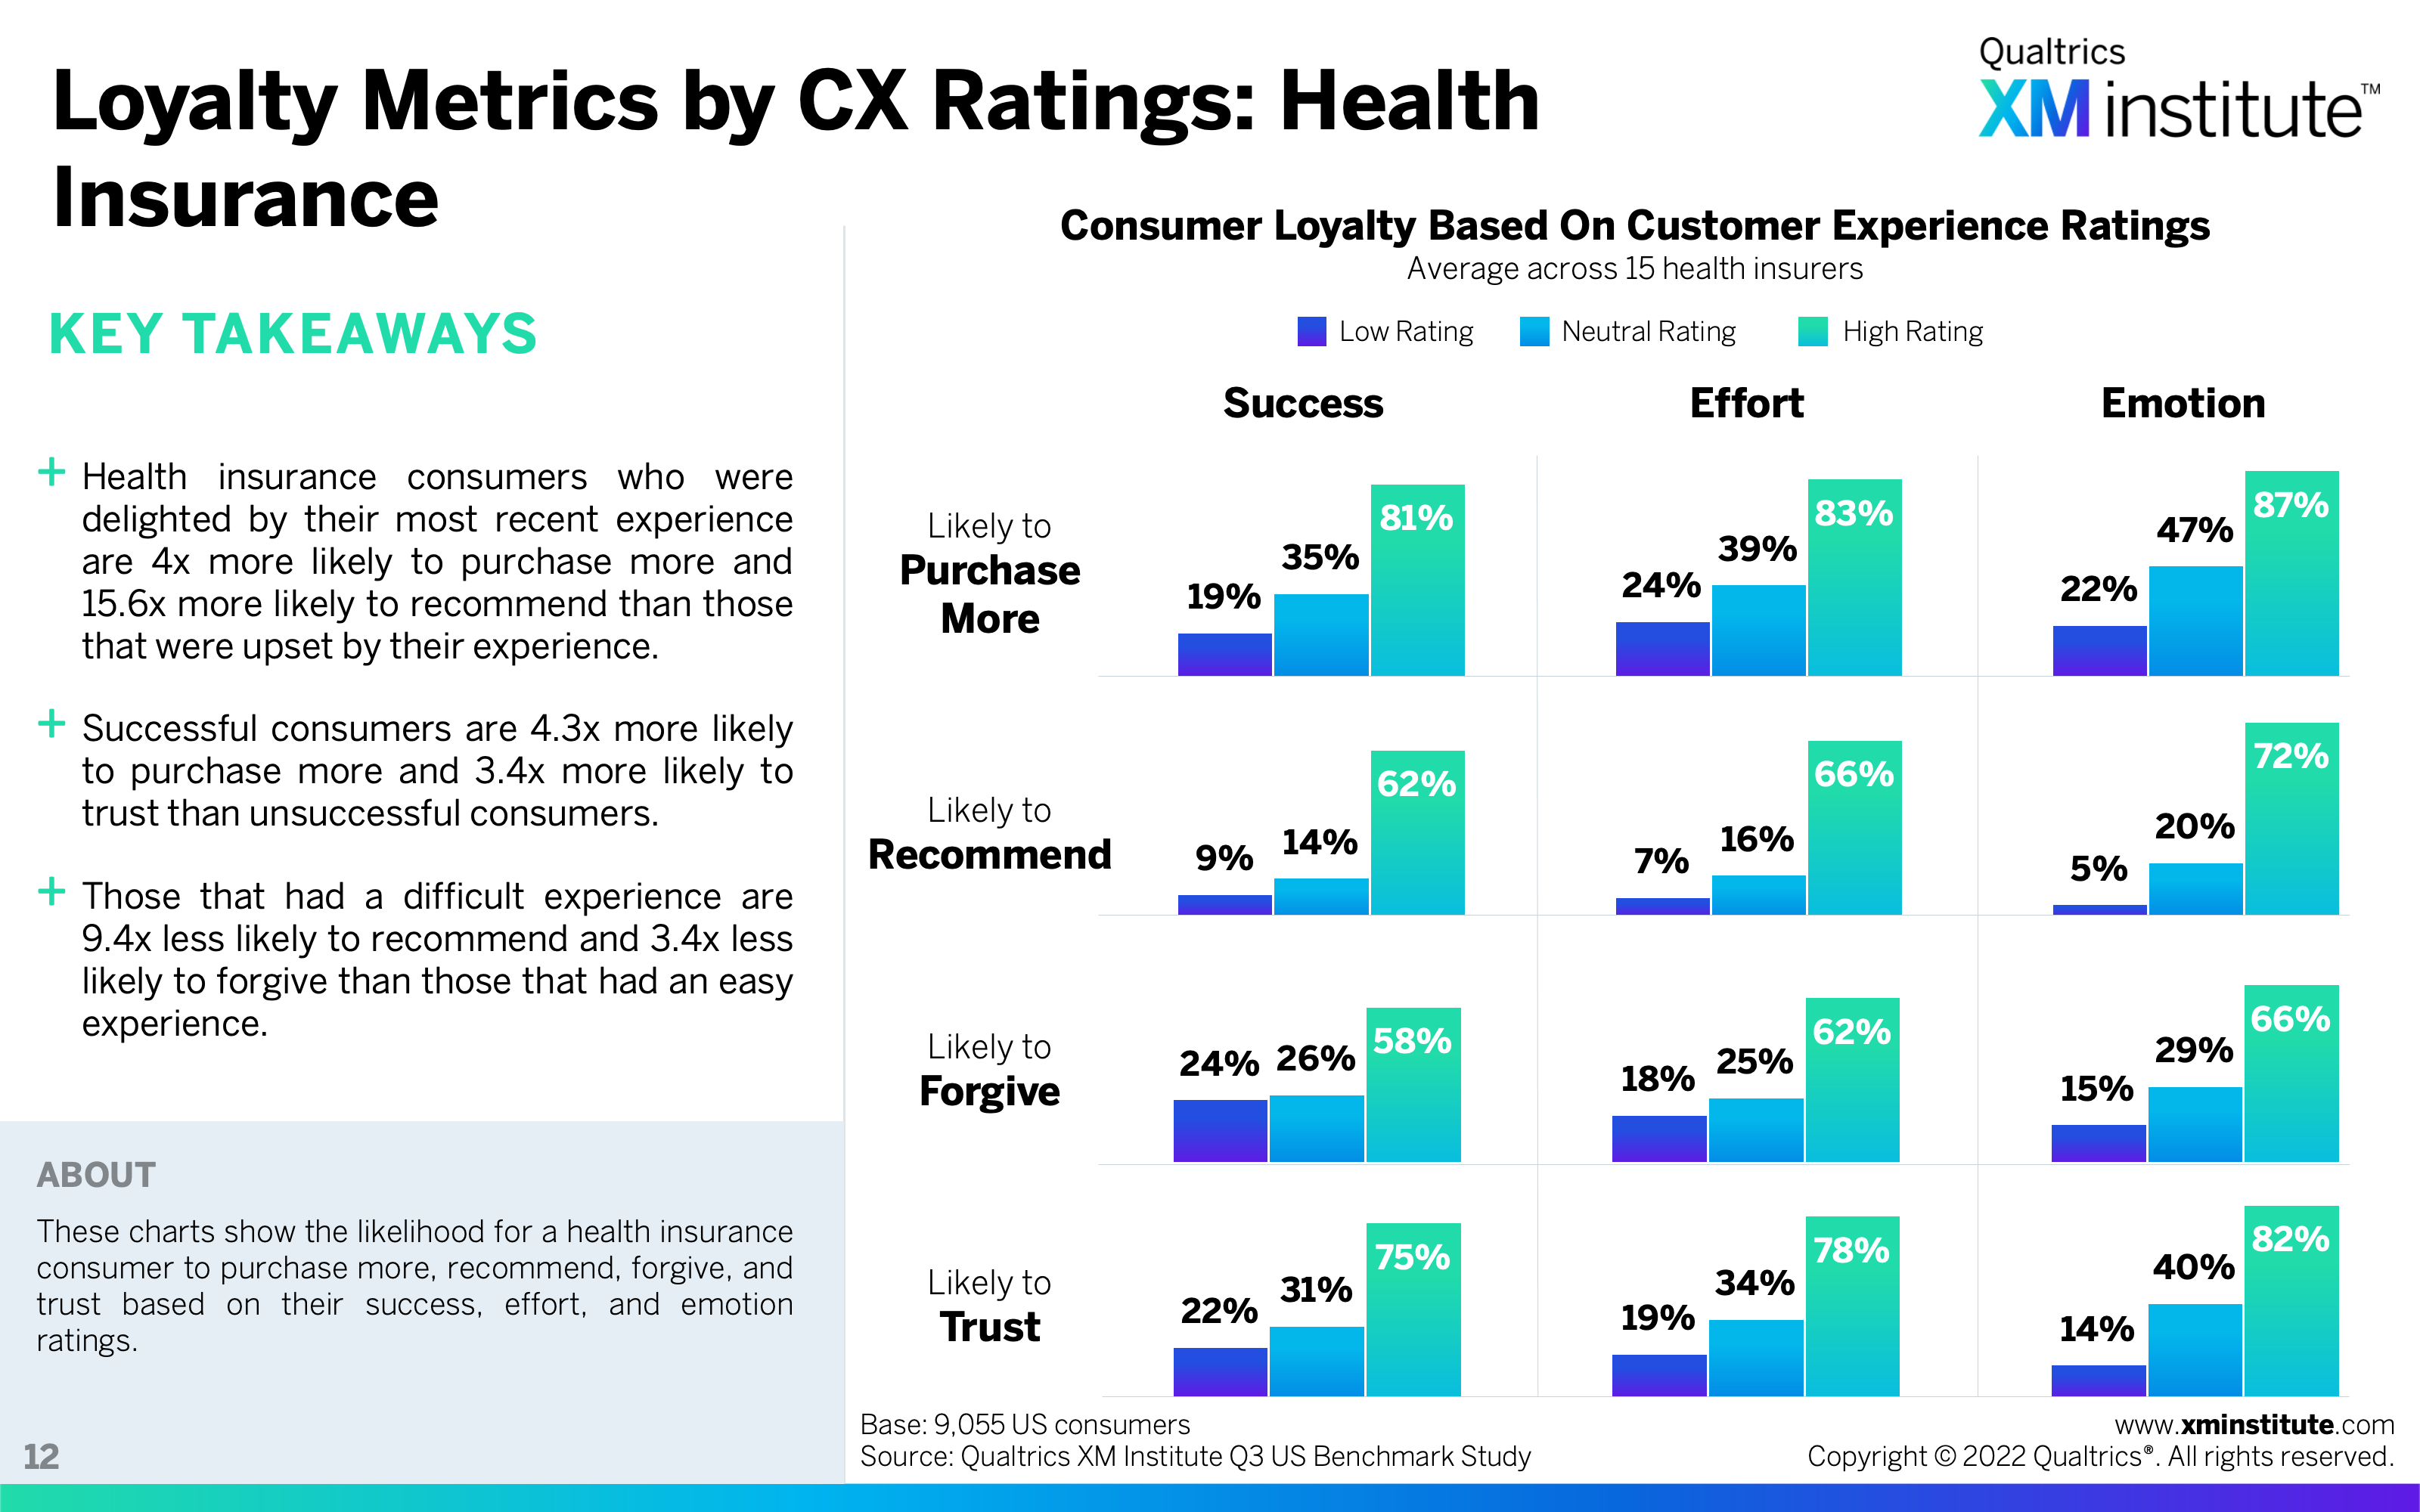
- Loyalty Metrics by CX Ratings: Health Insurance
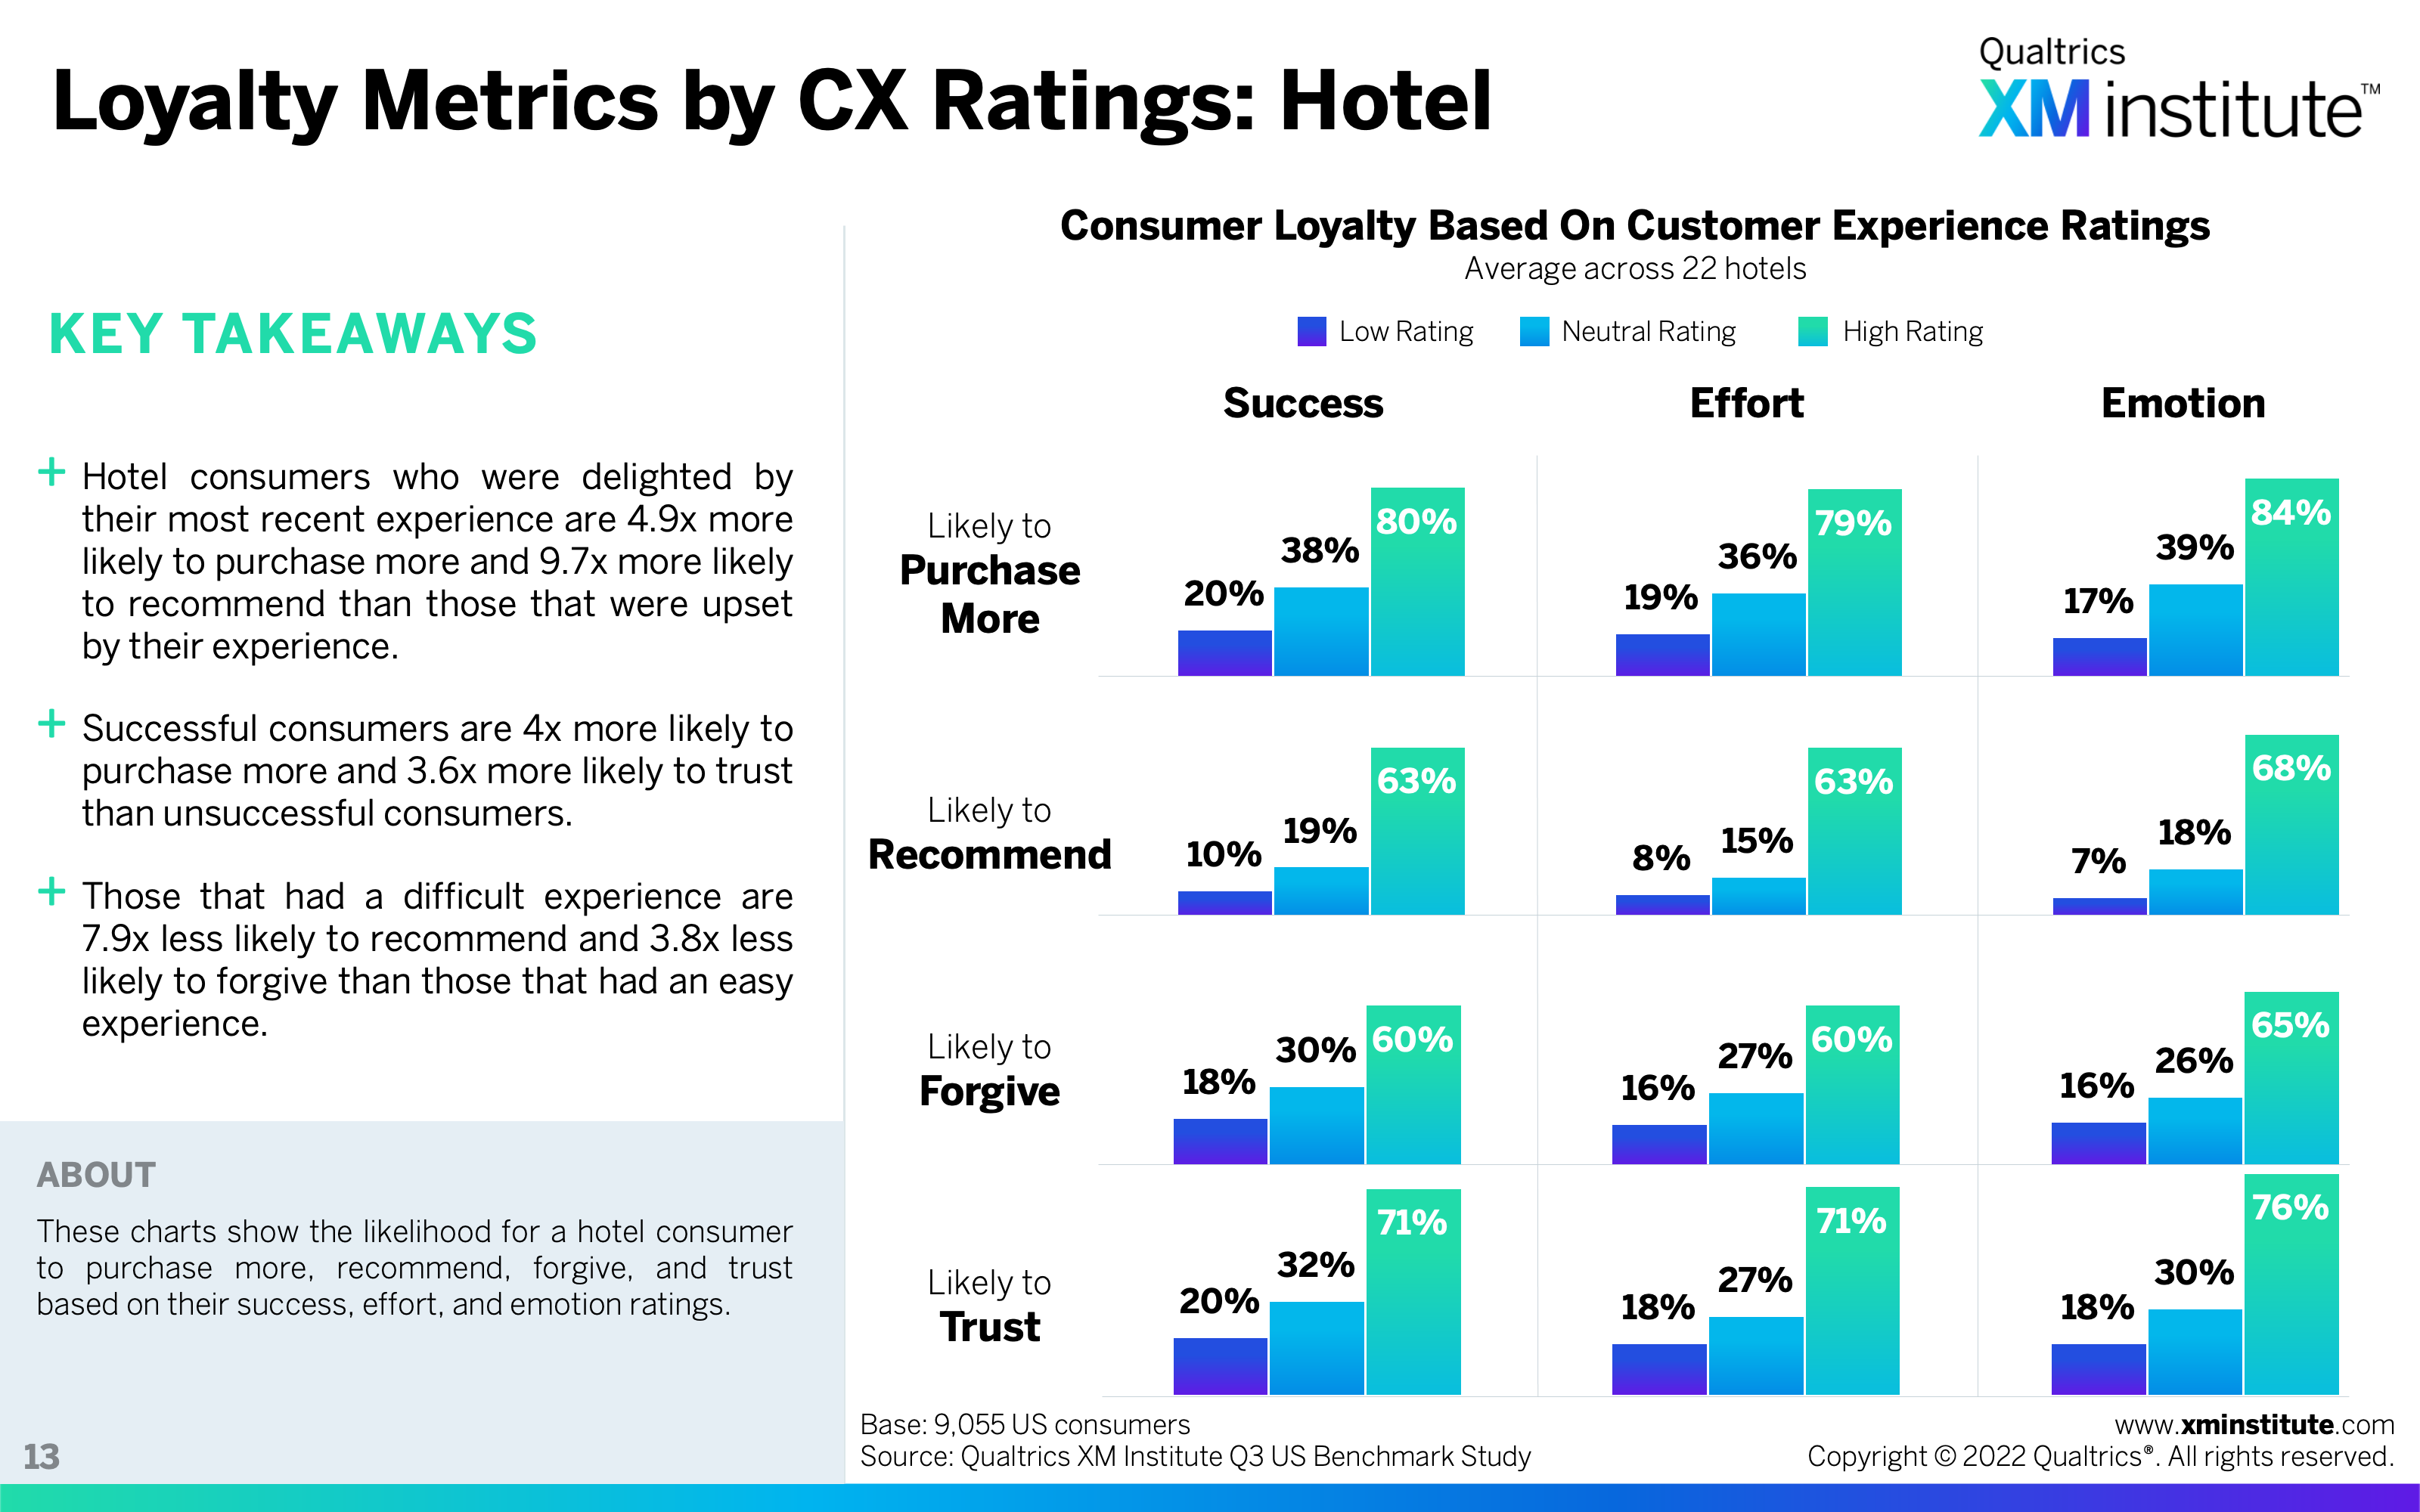
- Loyalty Metrics by CX Ratings: Hotel
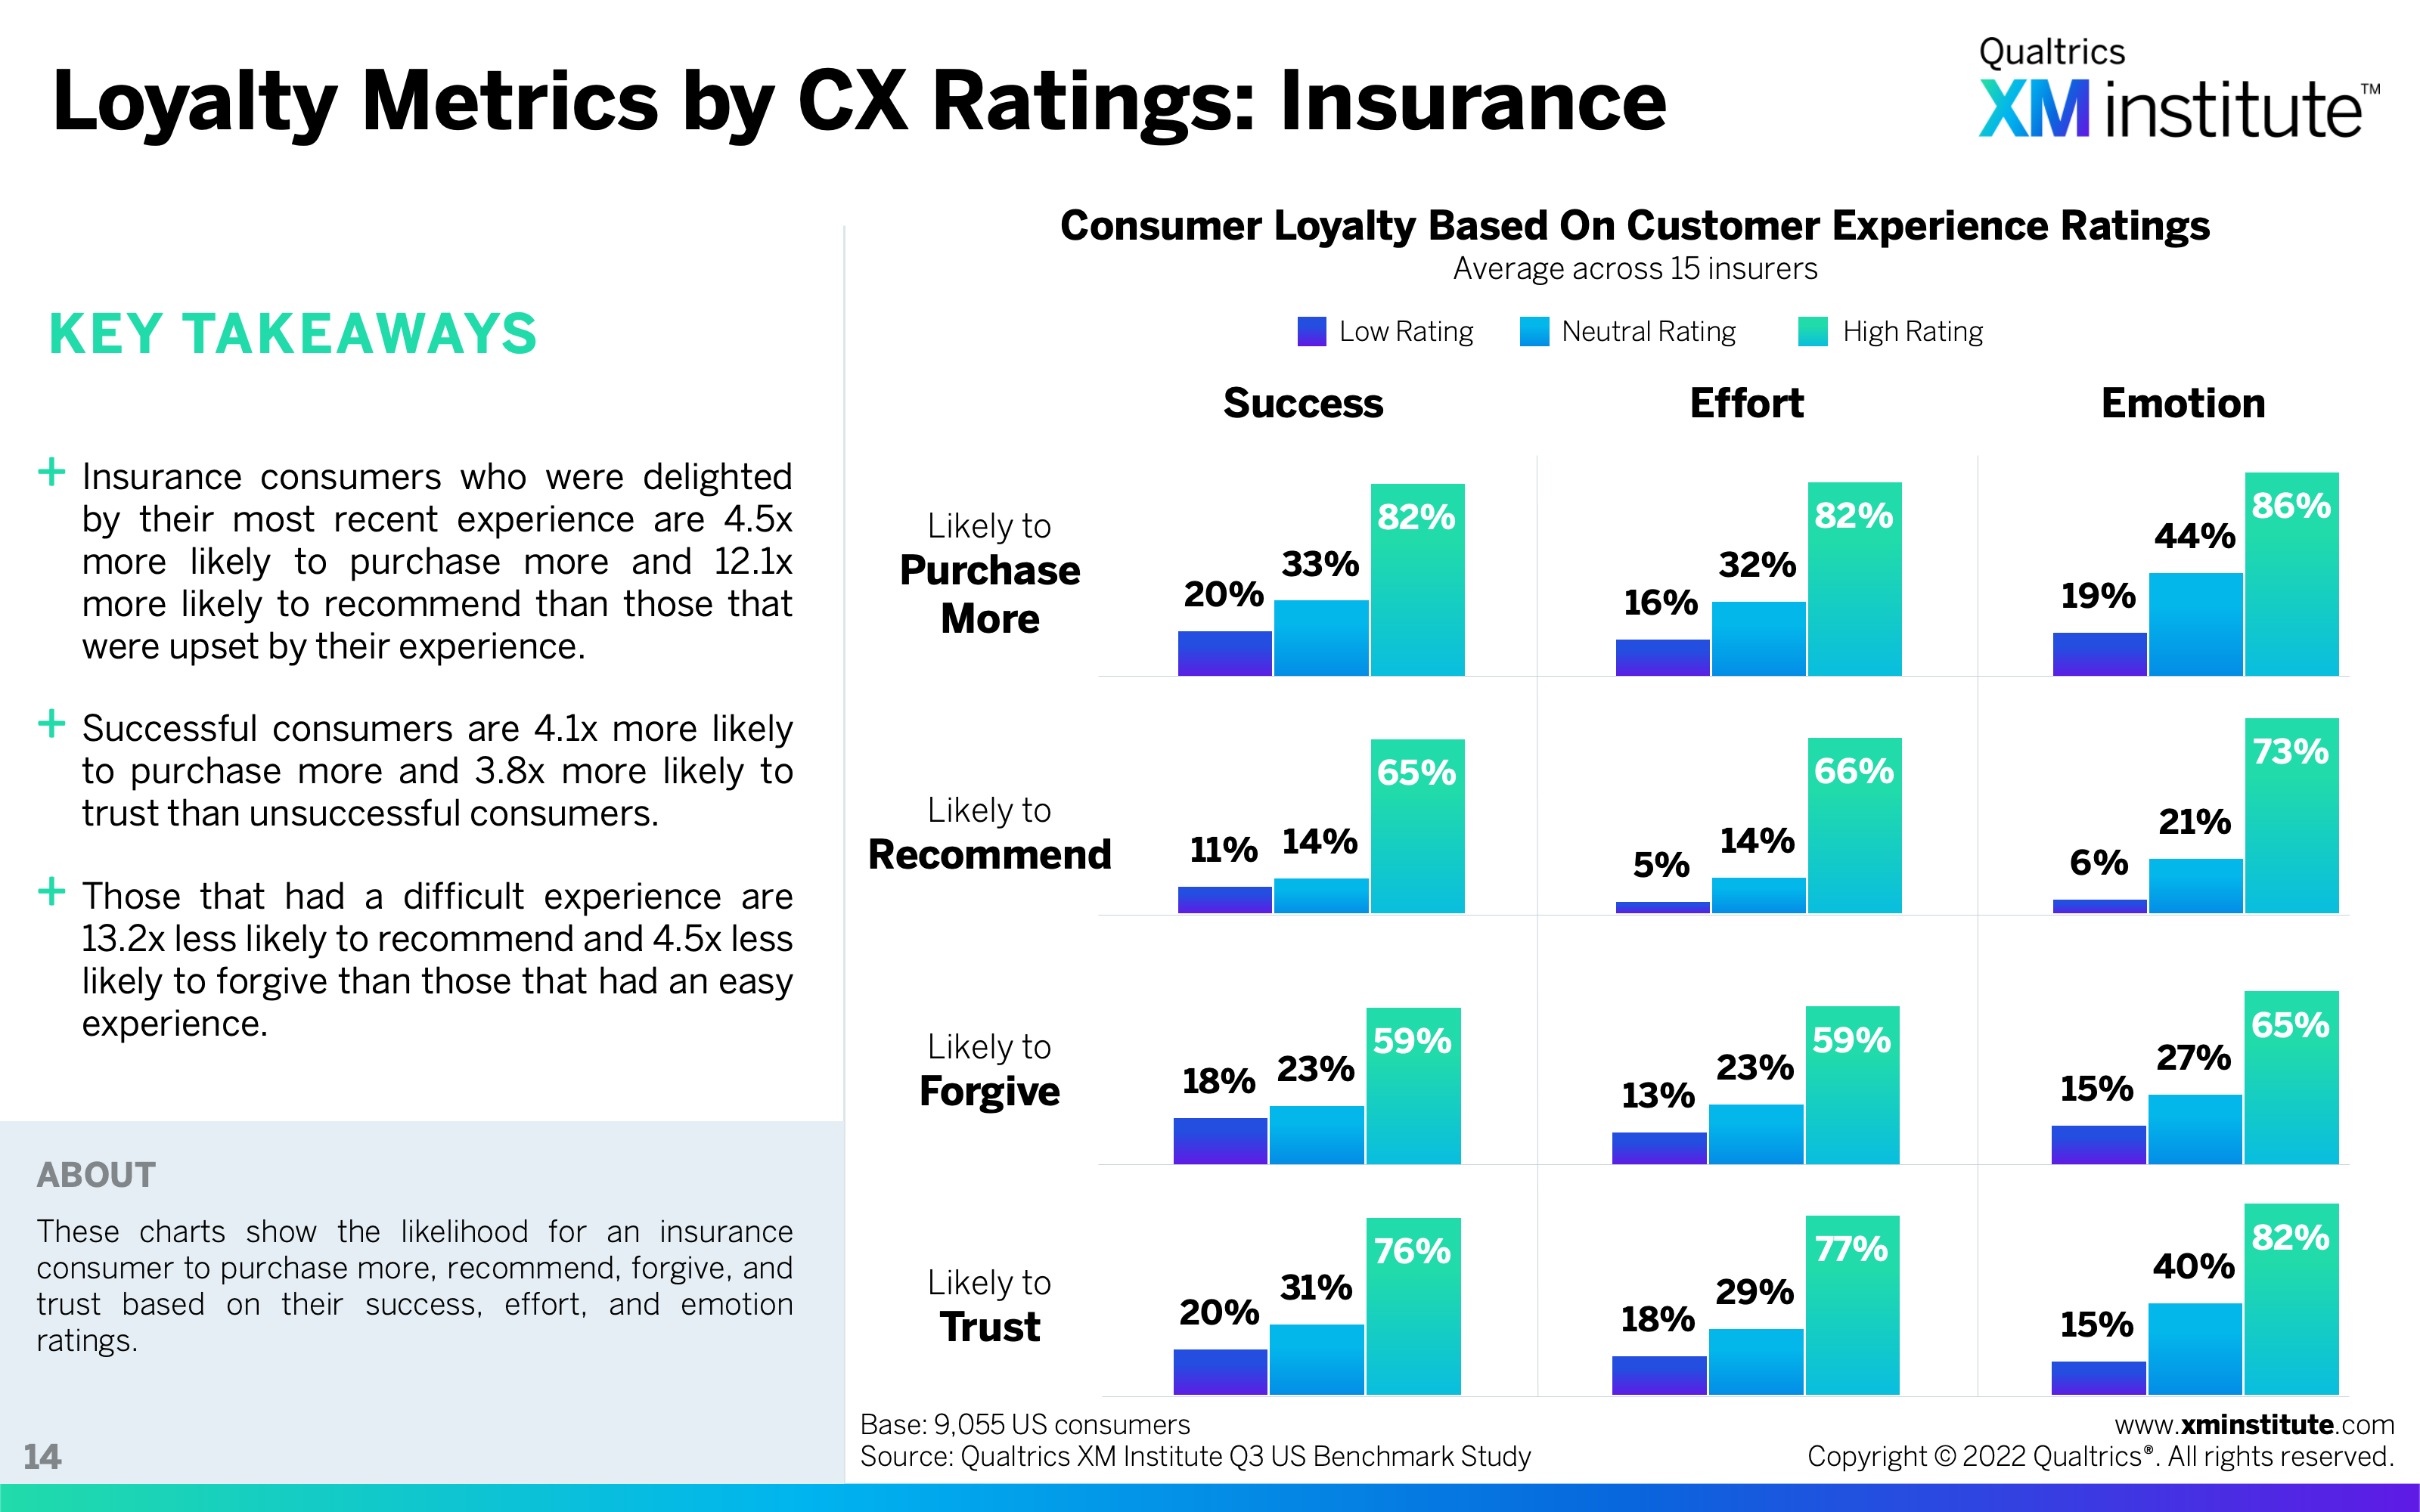
- Loyalty Metrics by CX Ratings: Insurance
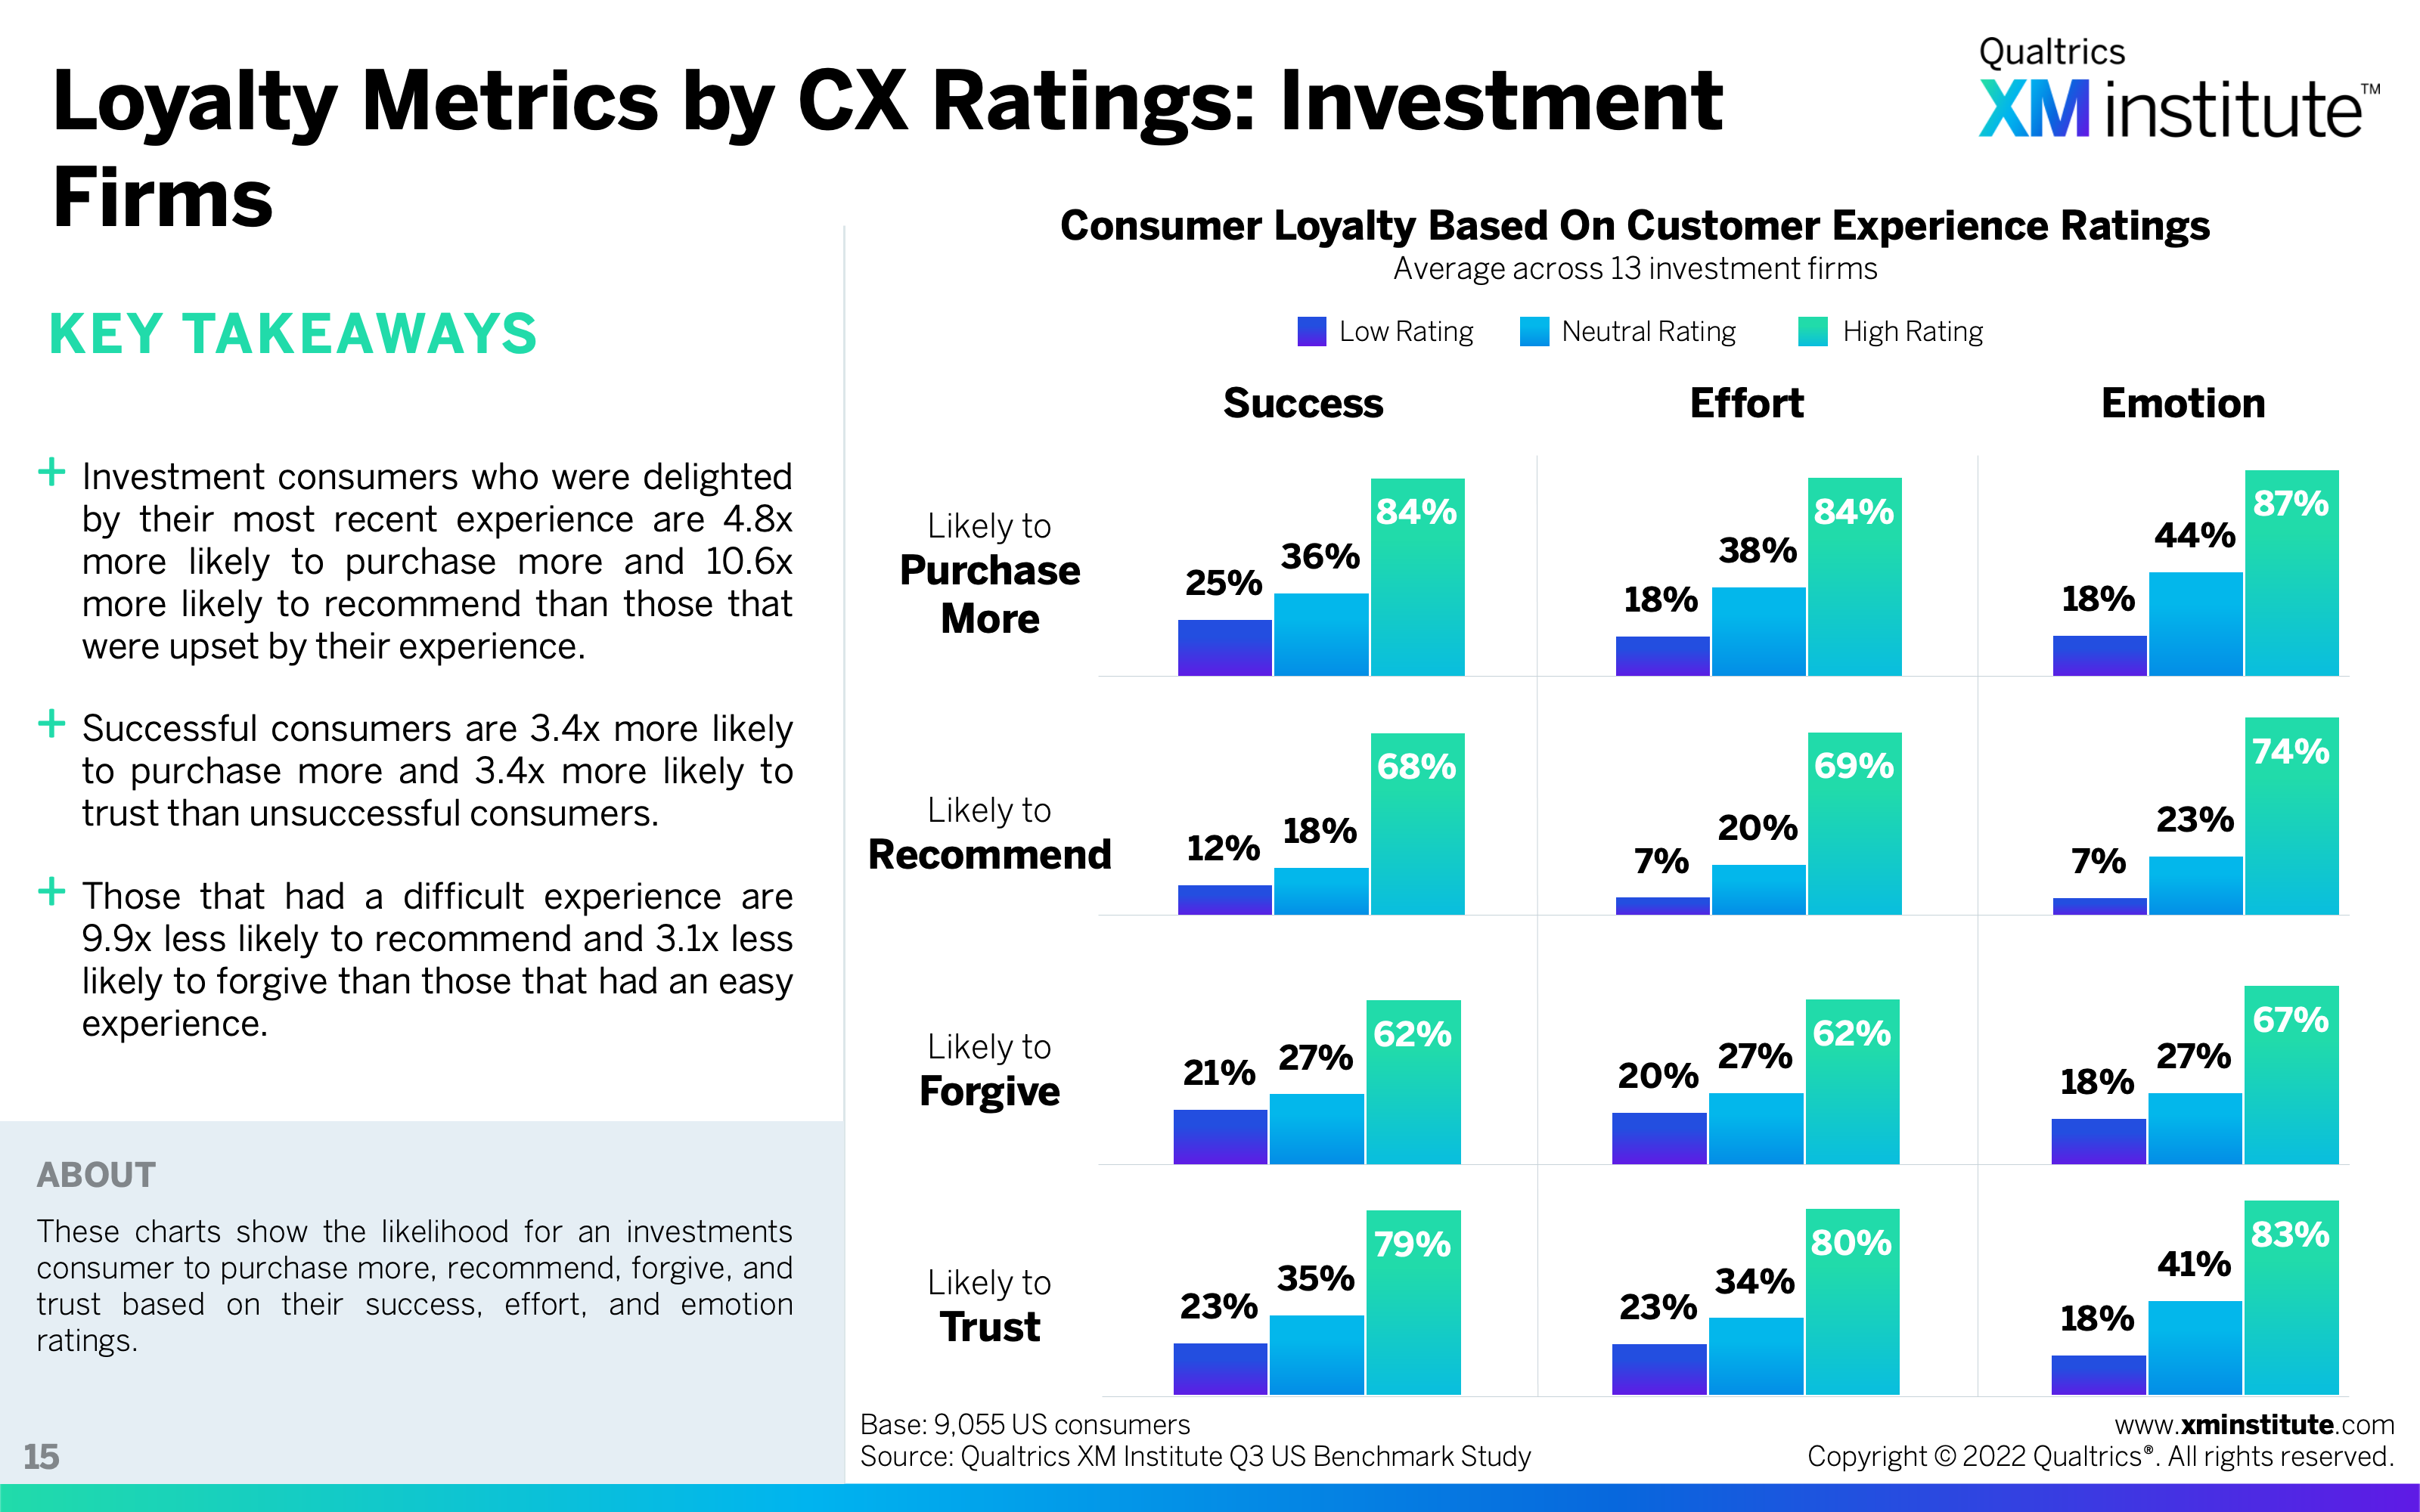
- Loyalty Metrics by CX Ratings: Investment Firms
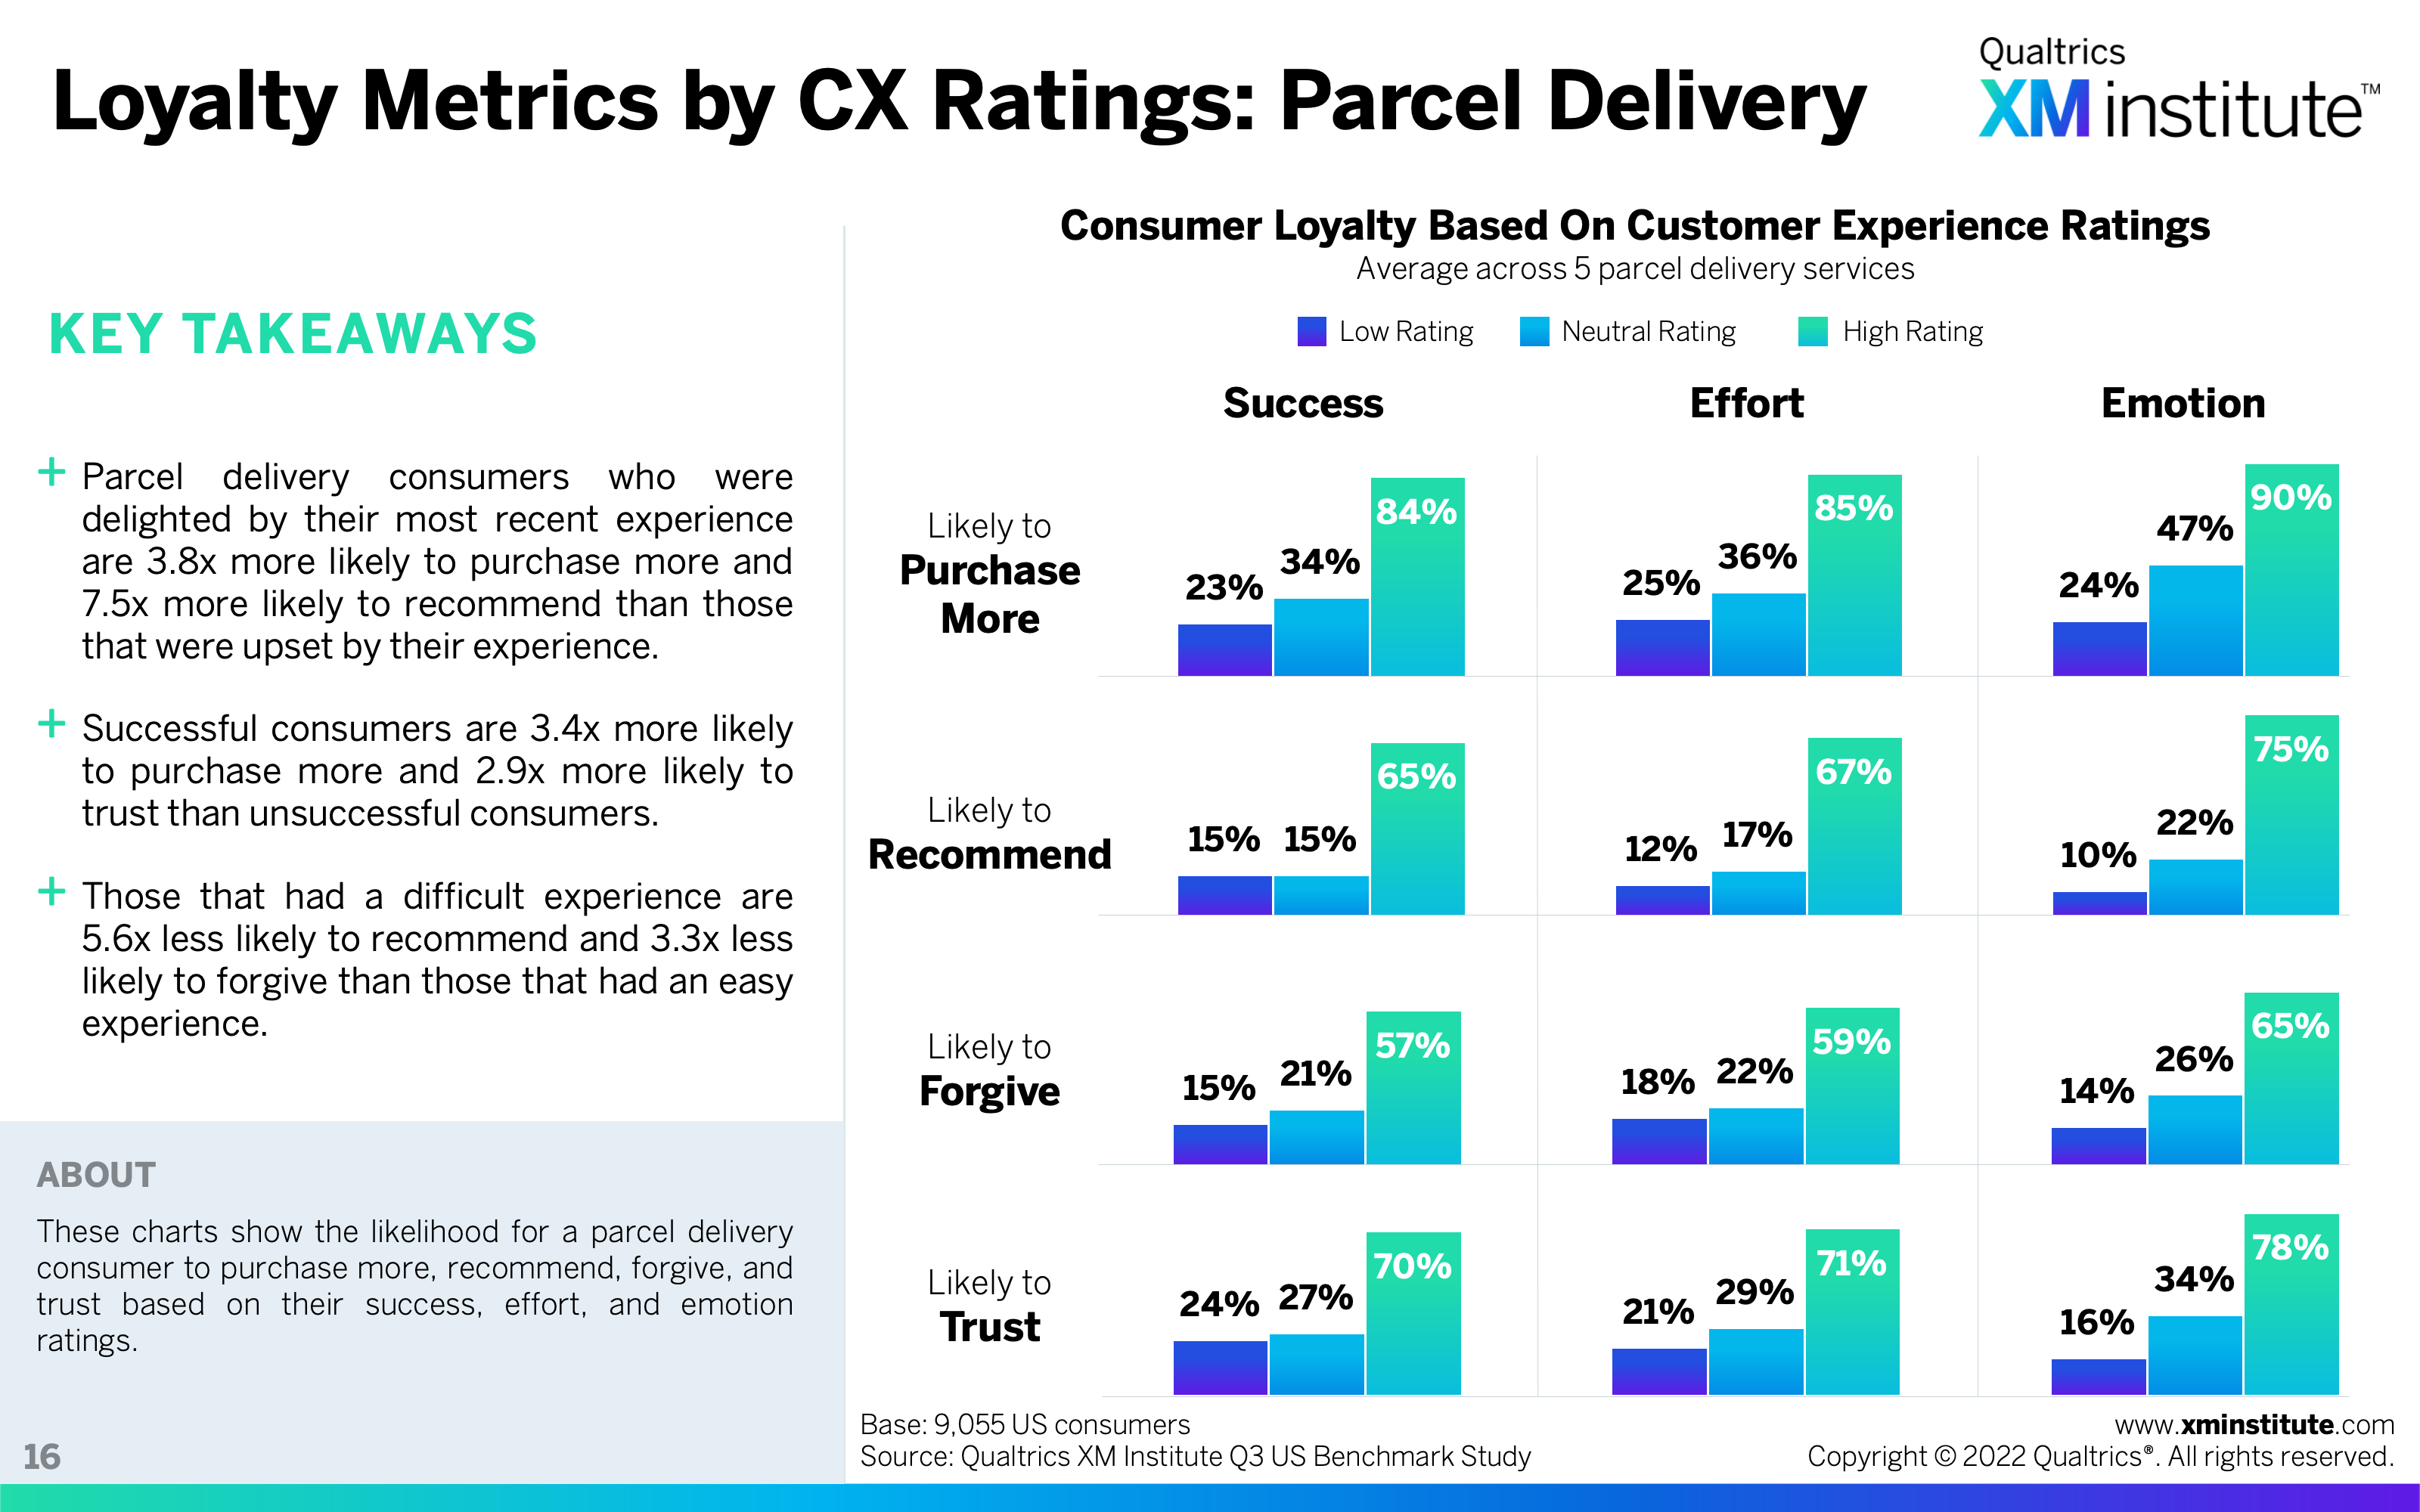
- Loyalty Metrics by CX Ratings: Parcel Delivery
- Loyalty Metrics by CX Ratings: Retail

- Loyalty Metrics by CX Ratings: Software

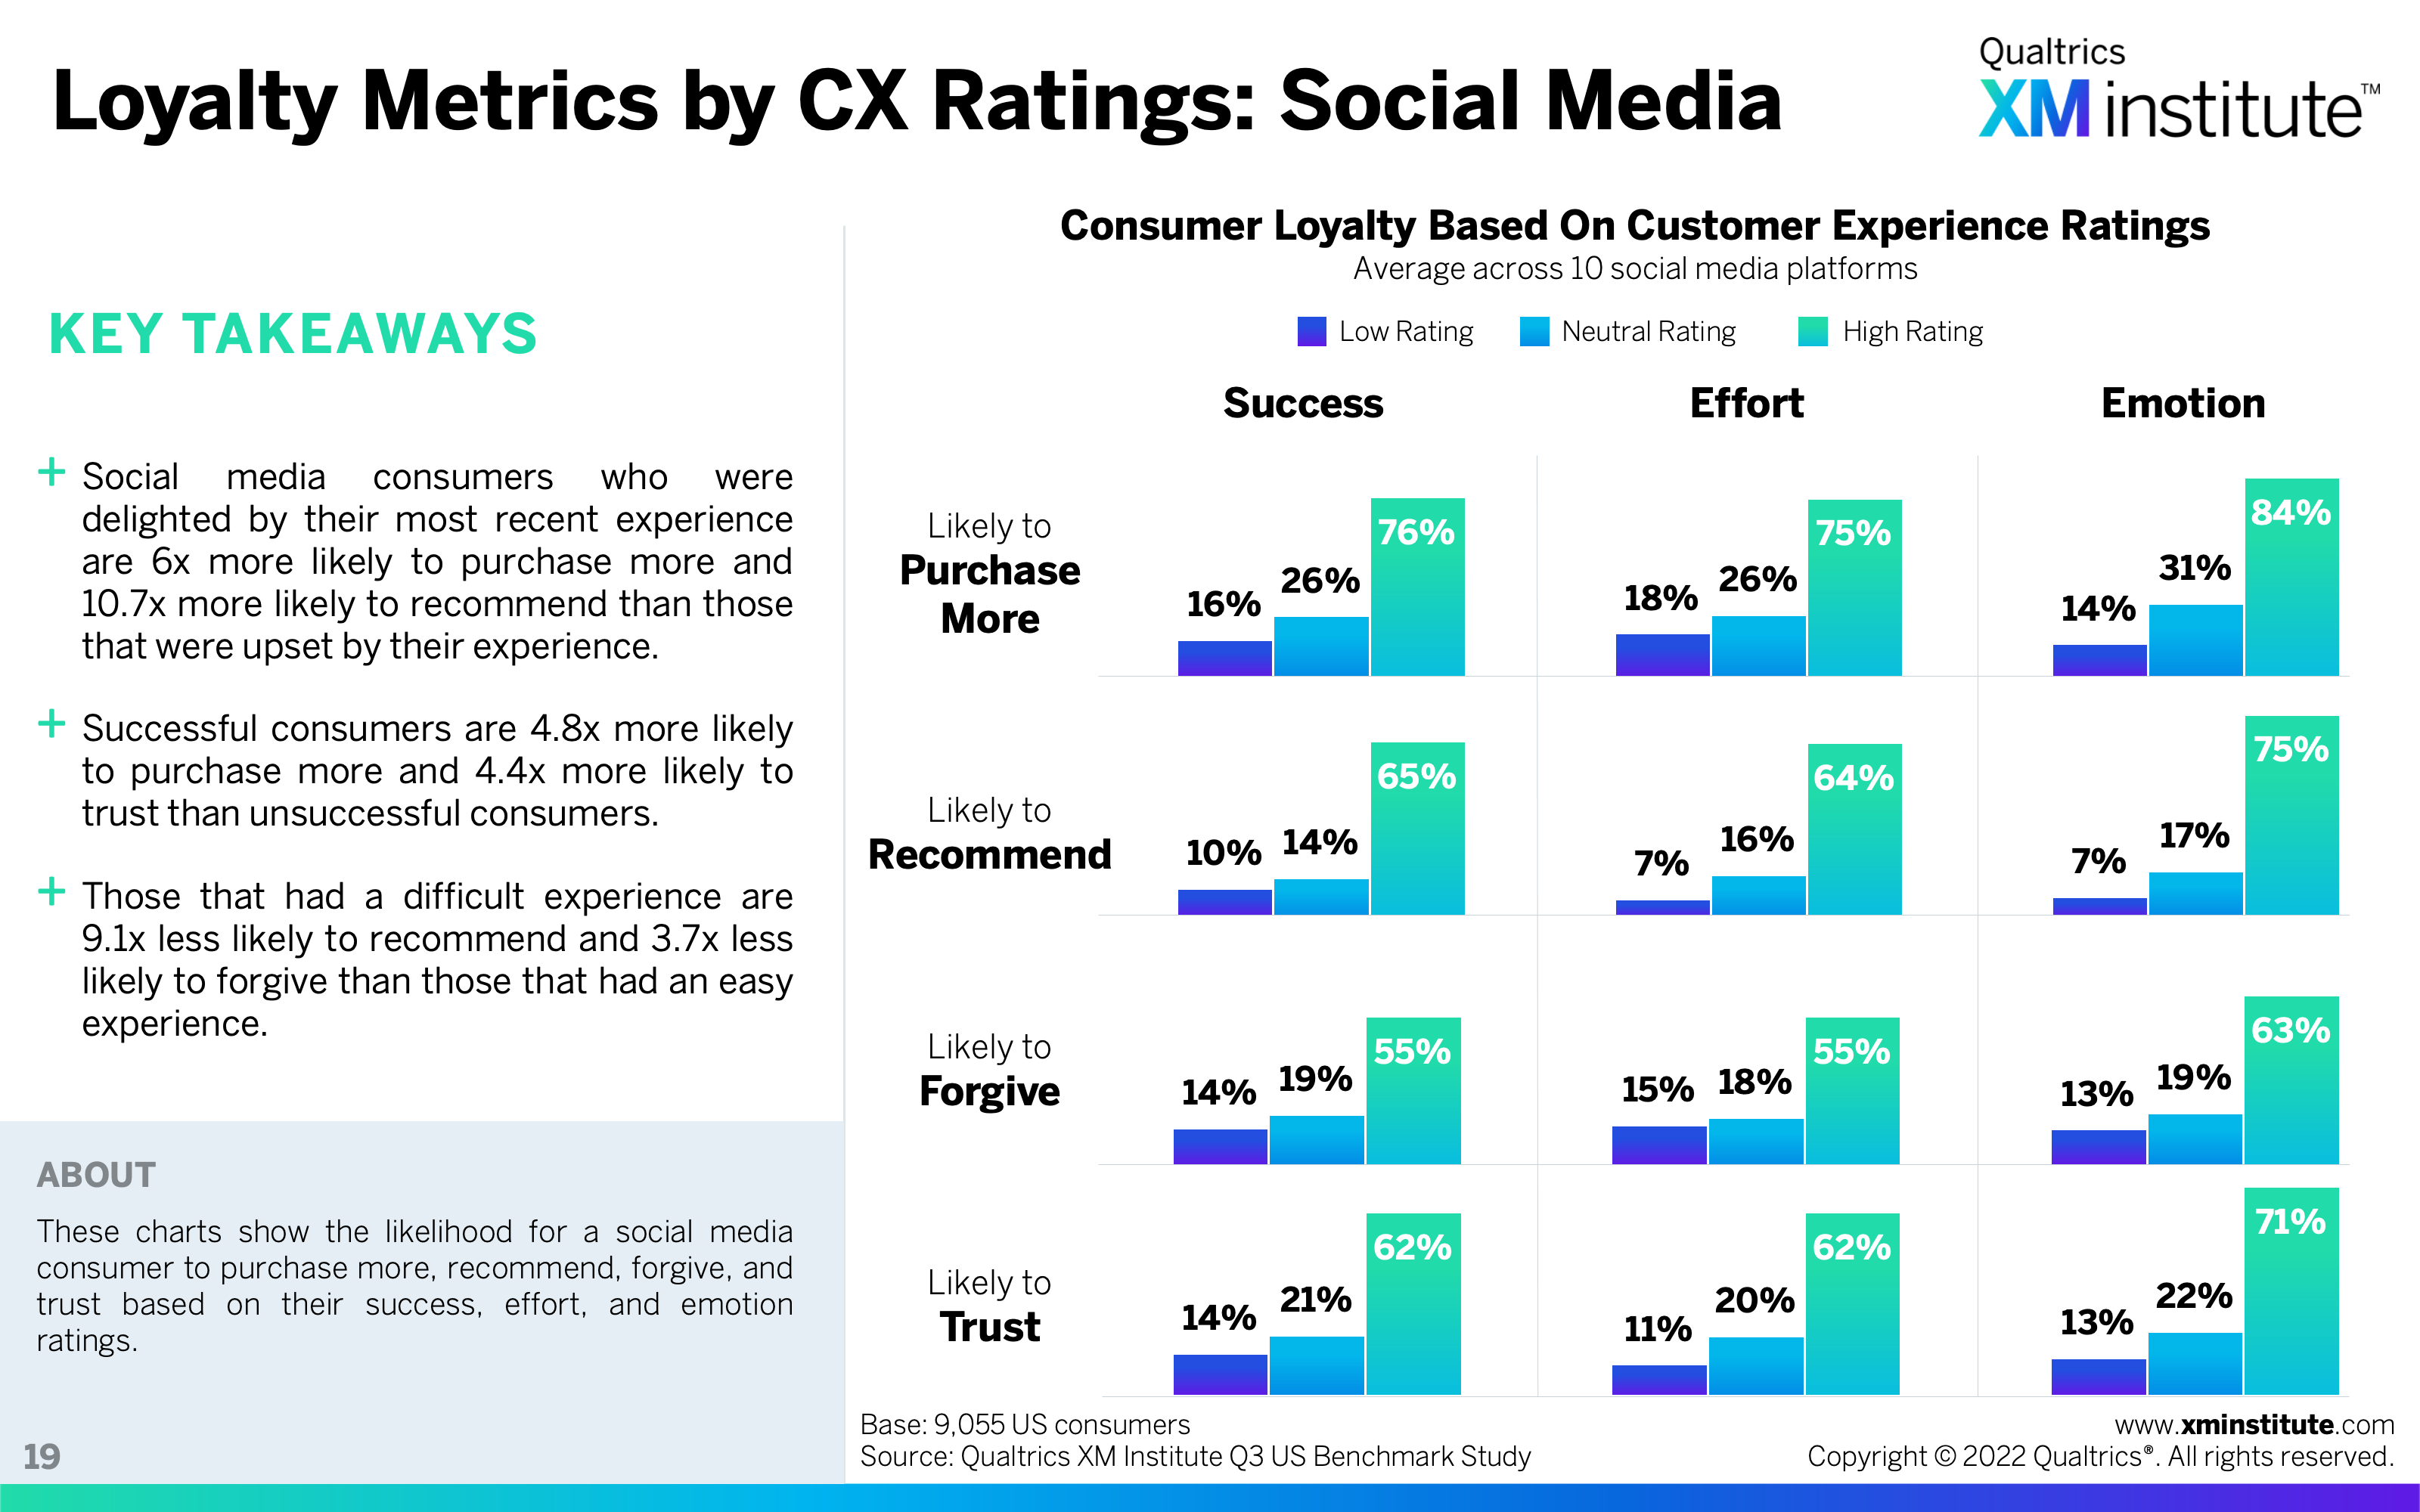
- Loyalty Metrics by CX Ratings: Social Media
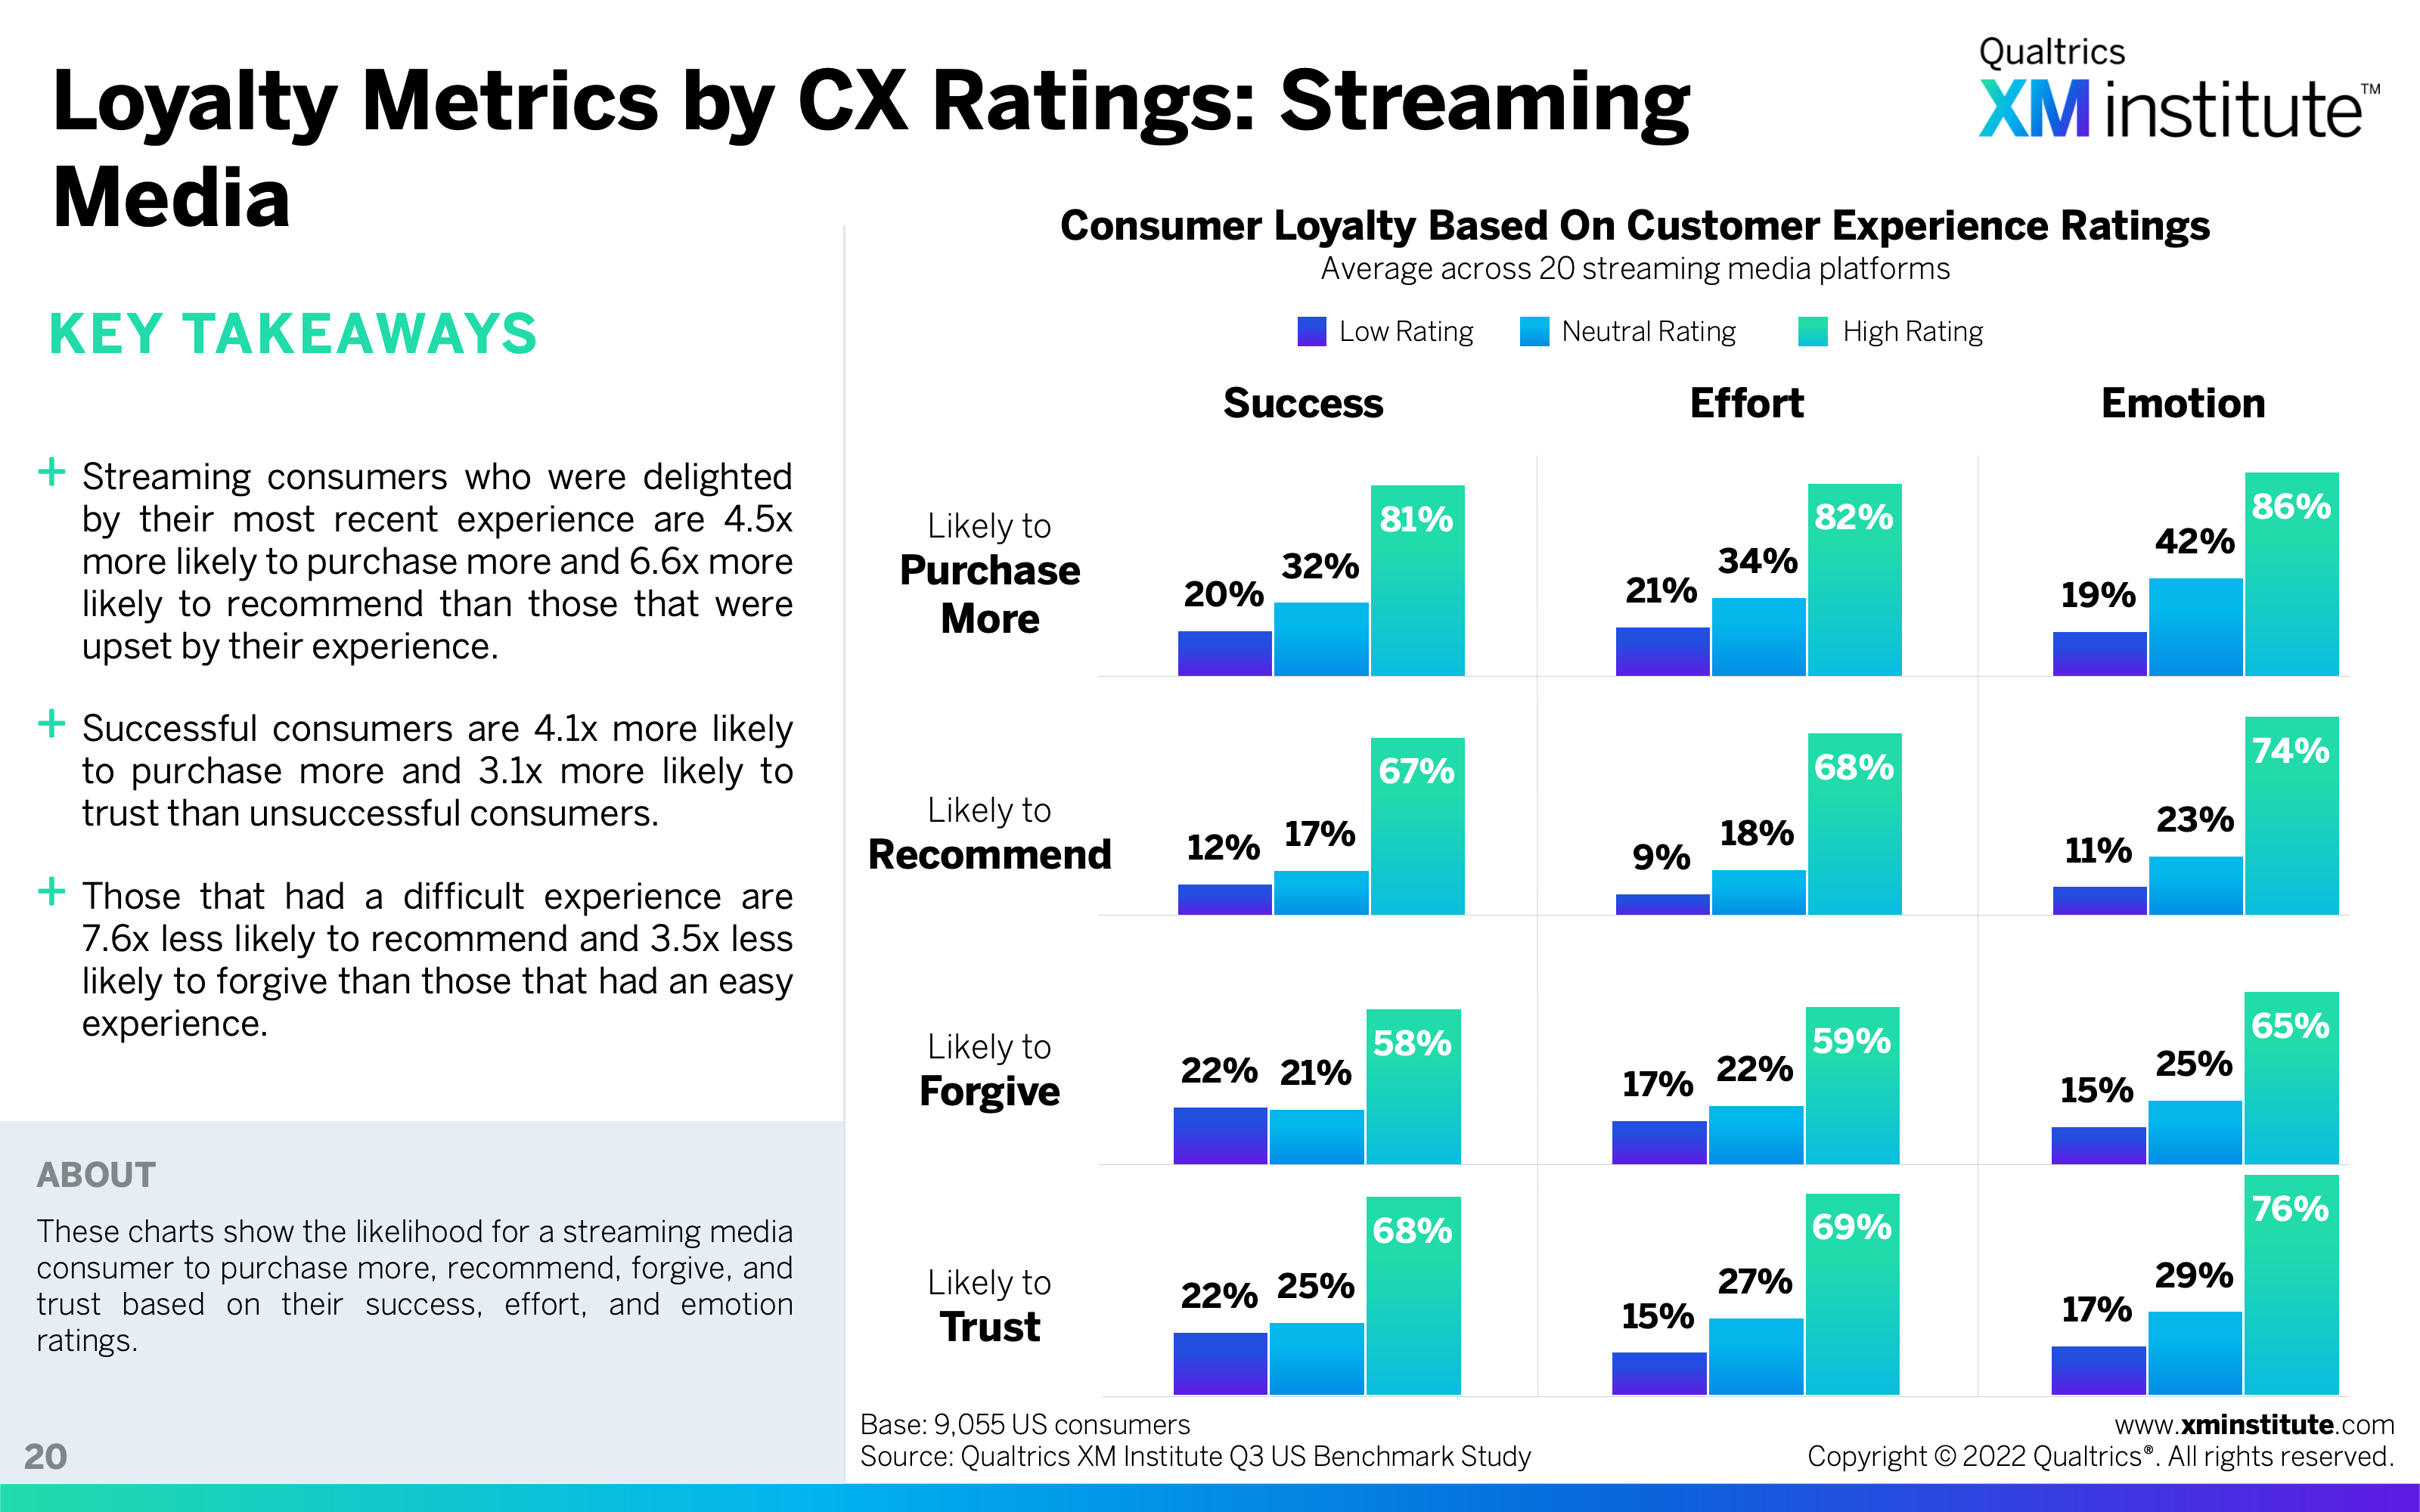
- Loyalty Metrics by CX Ratings: Streaming Media
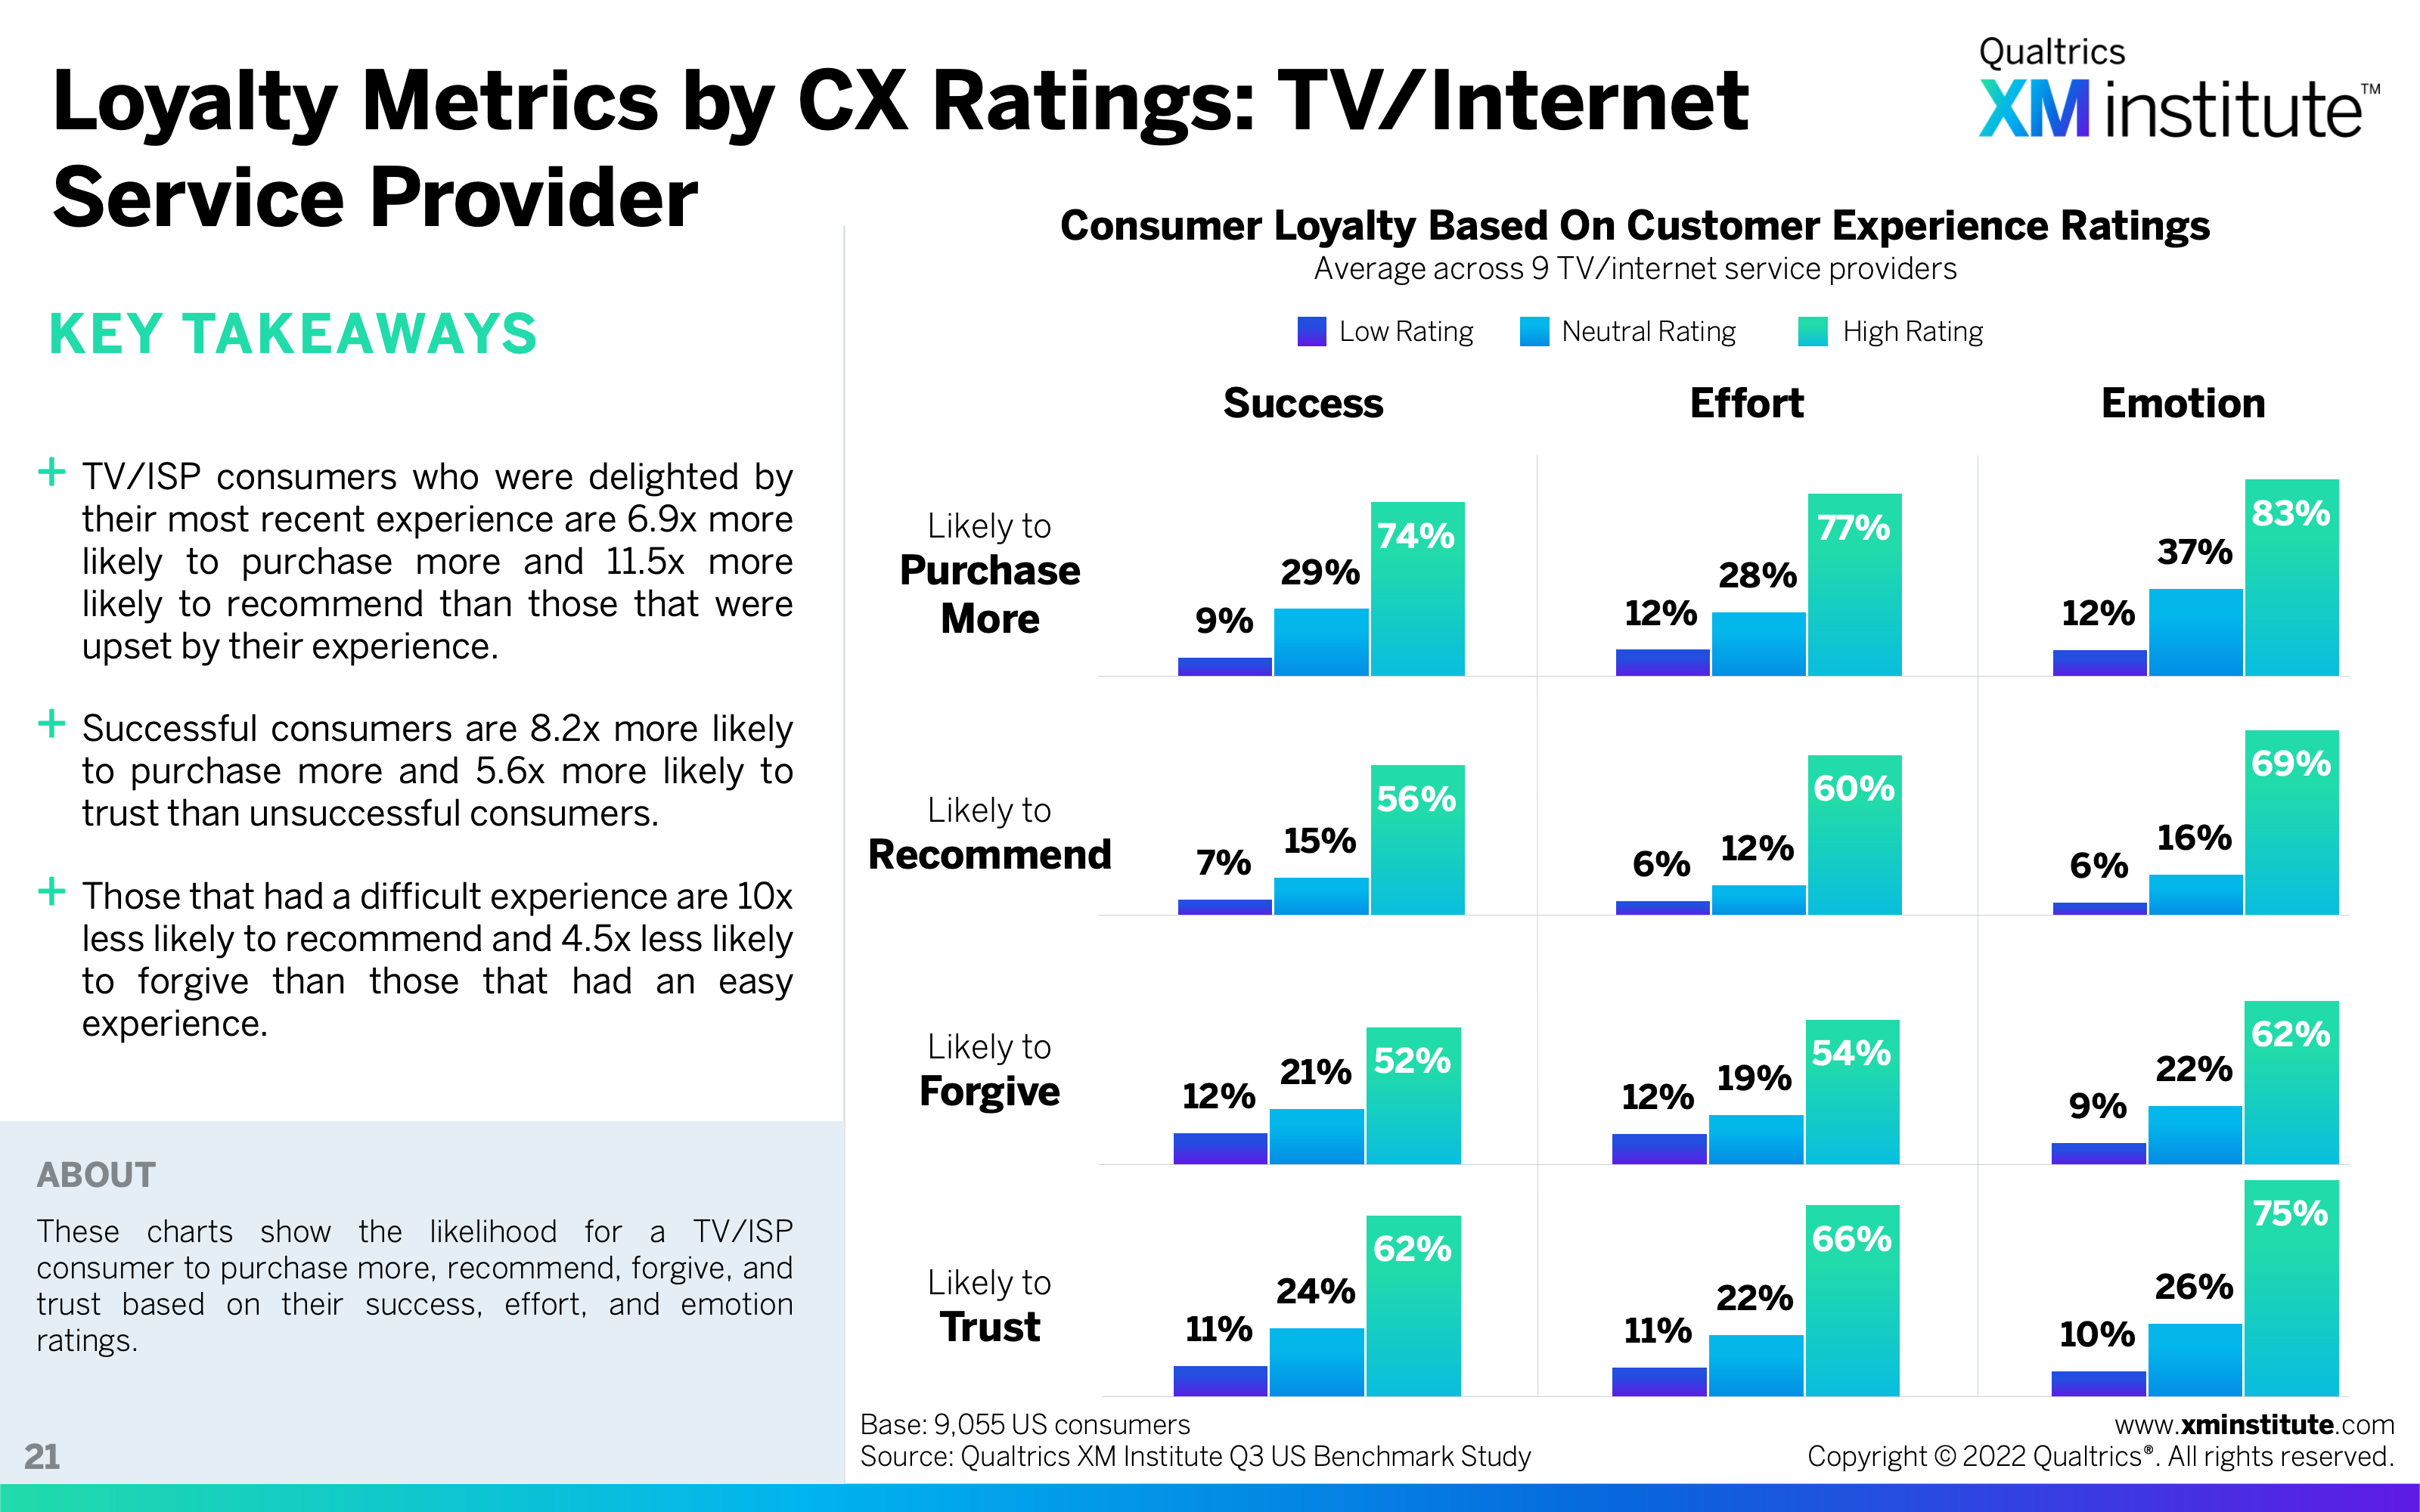
- Loyalty Metrics by CX Ratings: TV/Internet Service Provider
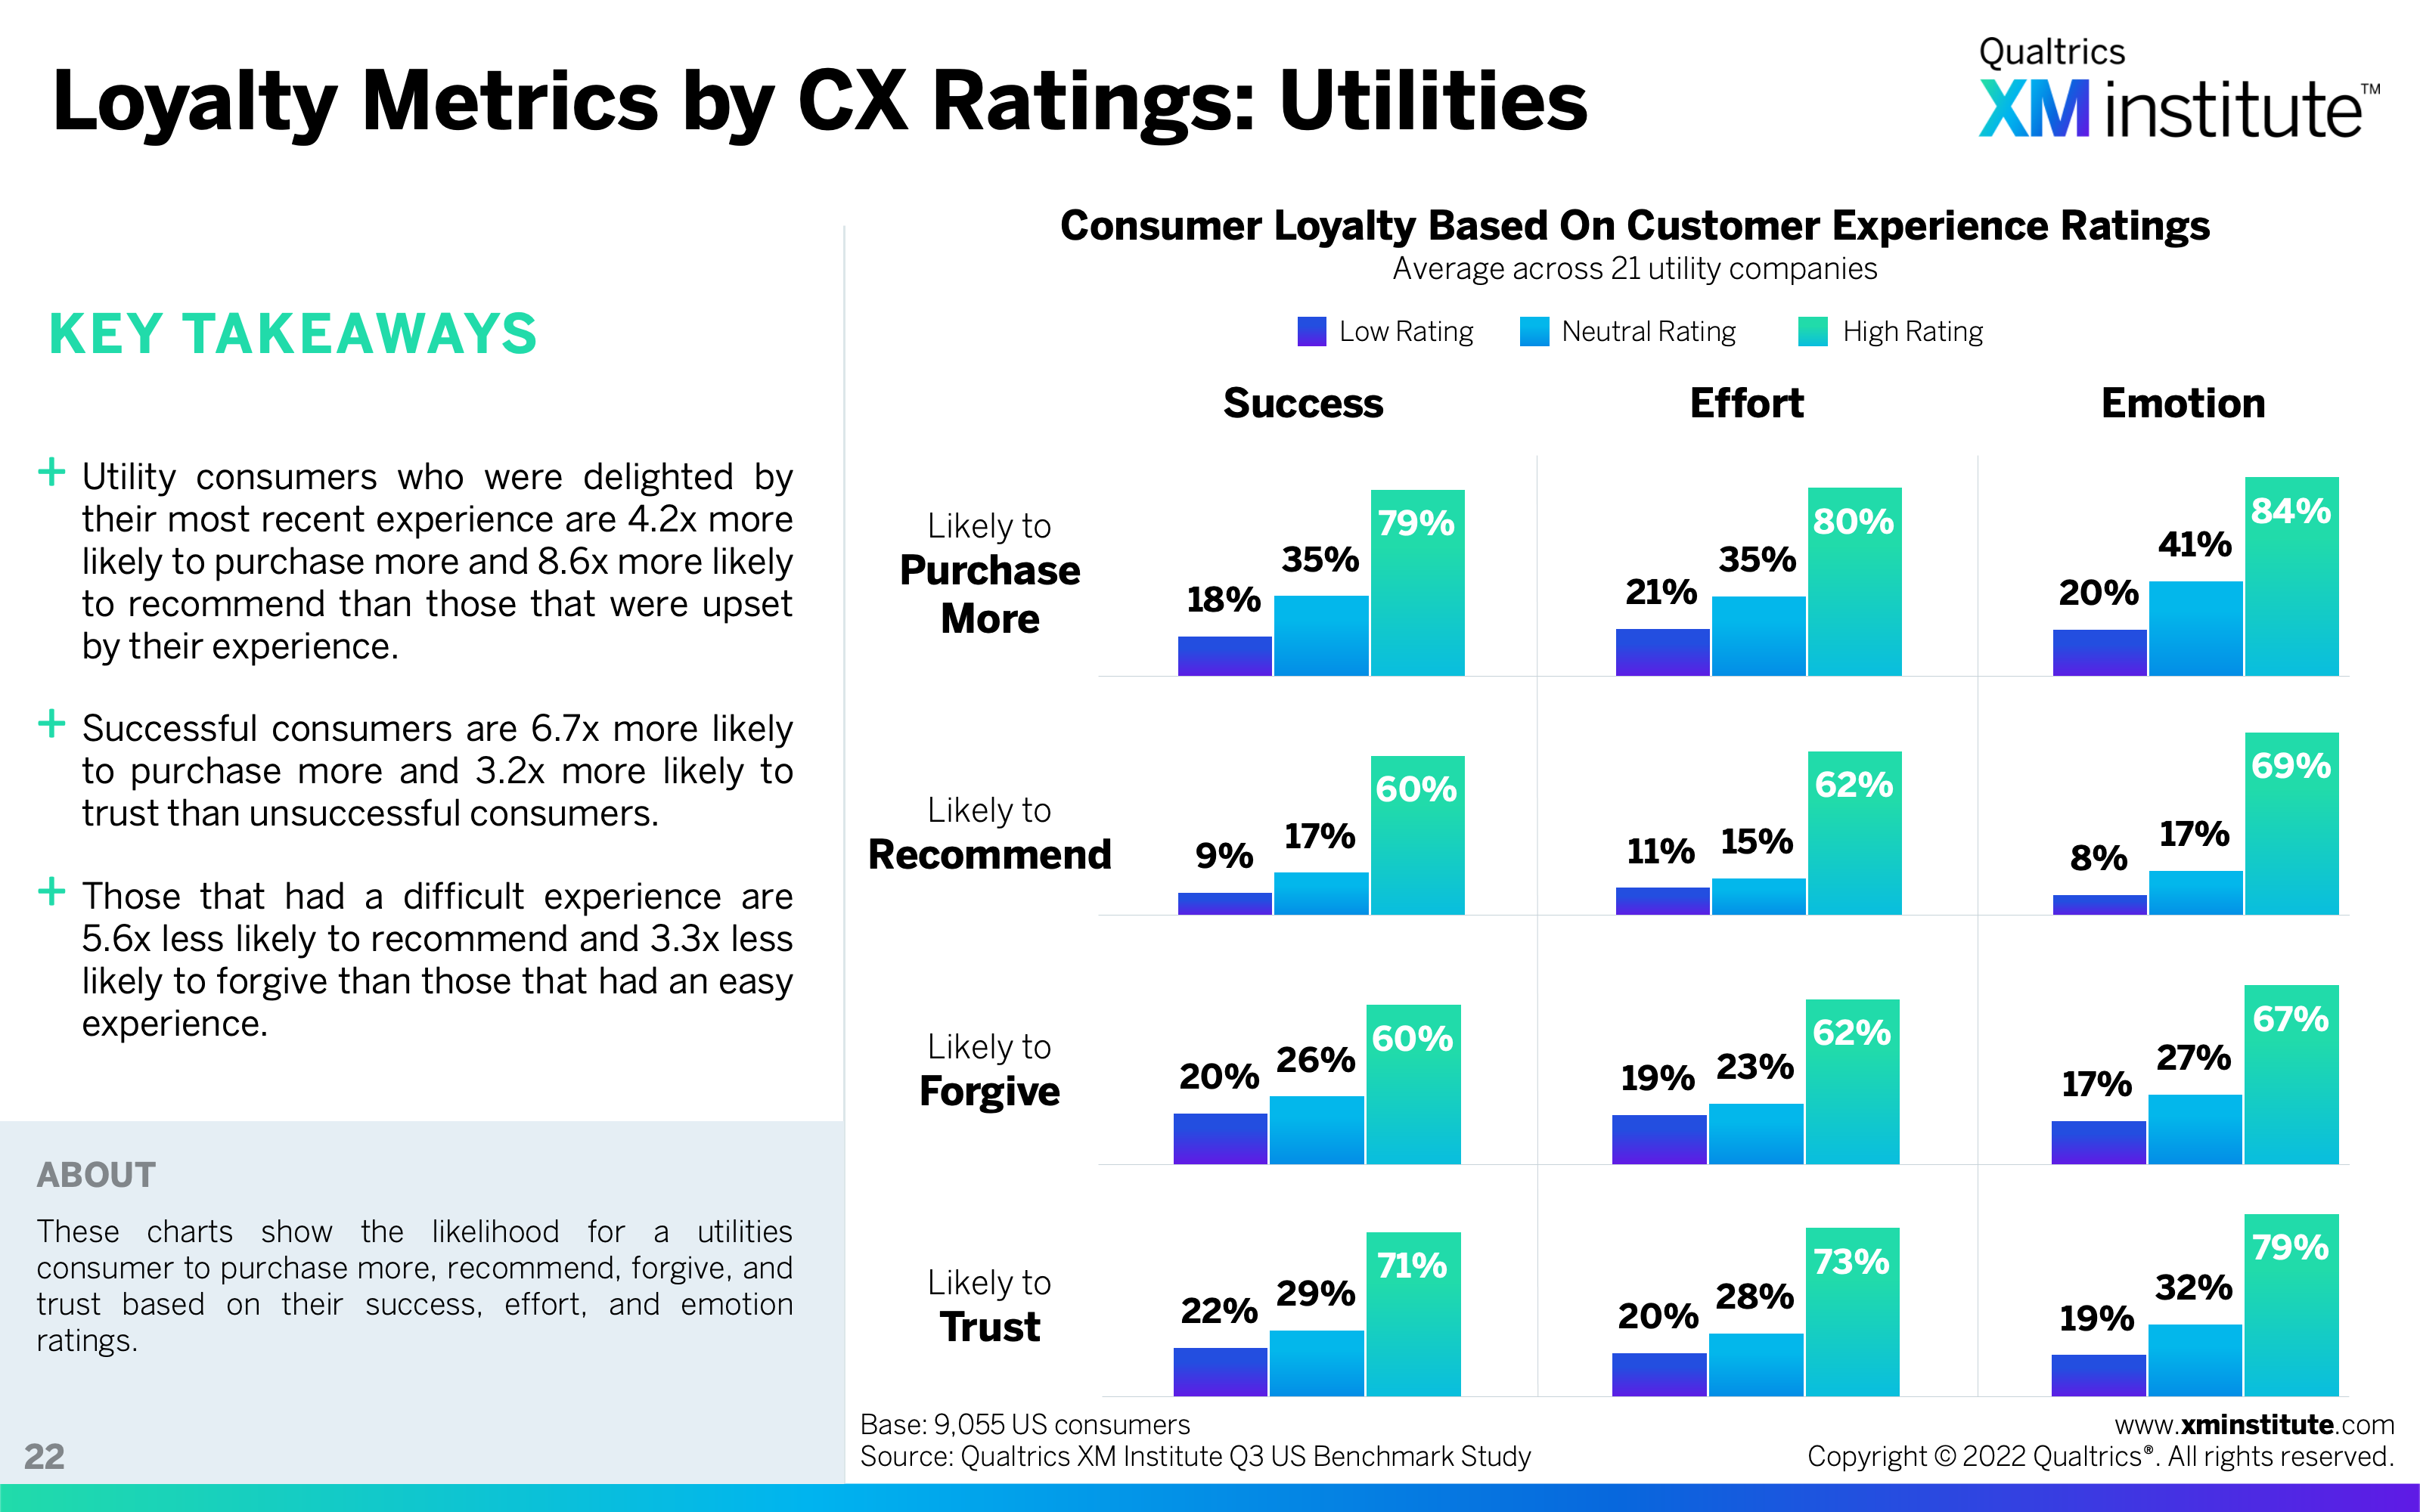
- Loyalty Metrics by CX Ratings: Utilities
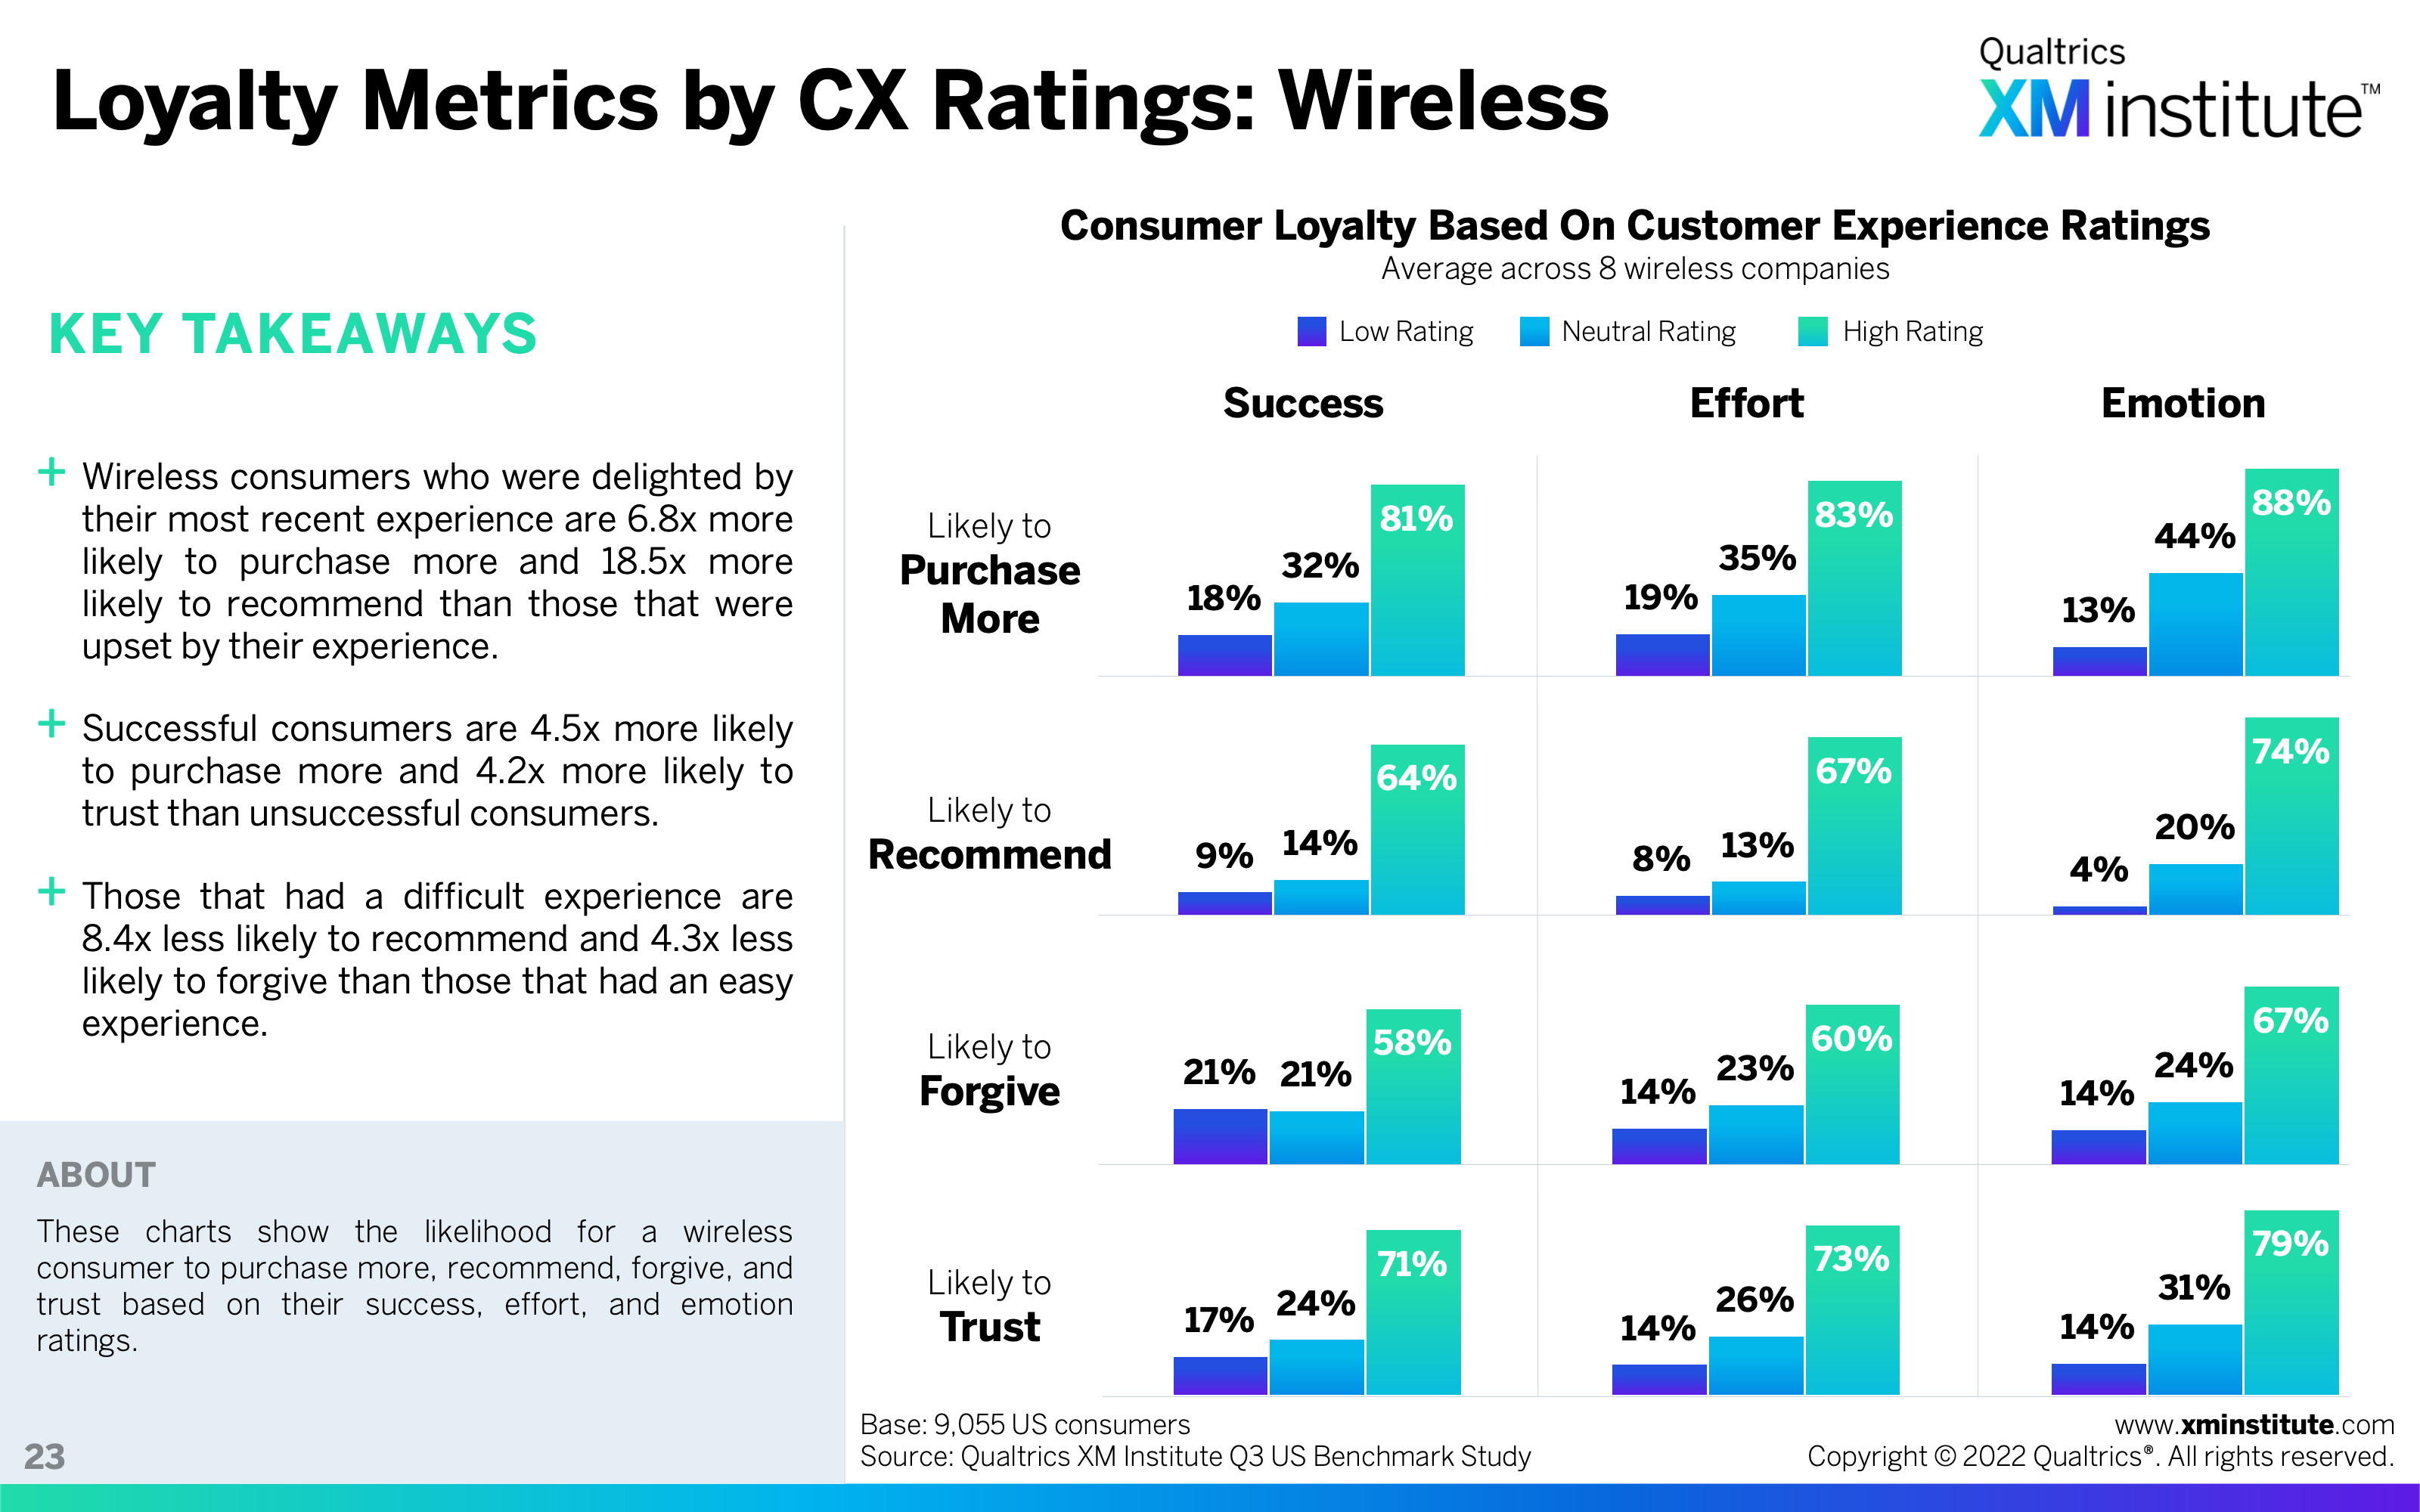
- Loyalty Metrics by CX Ratings: Wireless
- Methodology