Key Findings
As part of Qualtrics XM Institute’s 2023 Global Consumer Study, we asked more than 28,000 consumers if and how they shared their experience following a good or bad interaction with an organization. To understand how consumers’ preferred feedback channels have changed since 2021, we compared these results to our findings from the Q1 2021 Global Consumer Study. From our analysis, we found that:
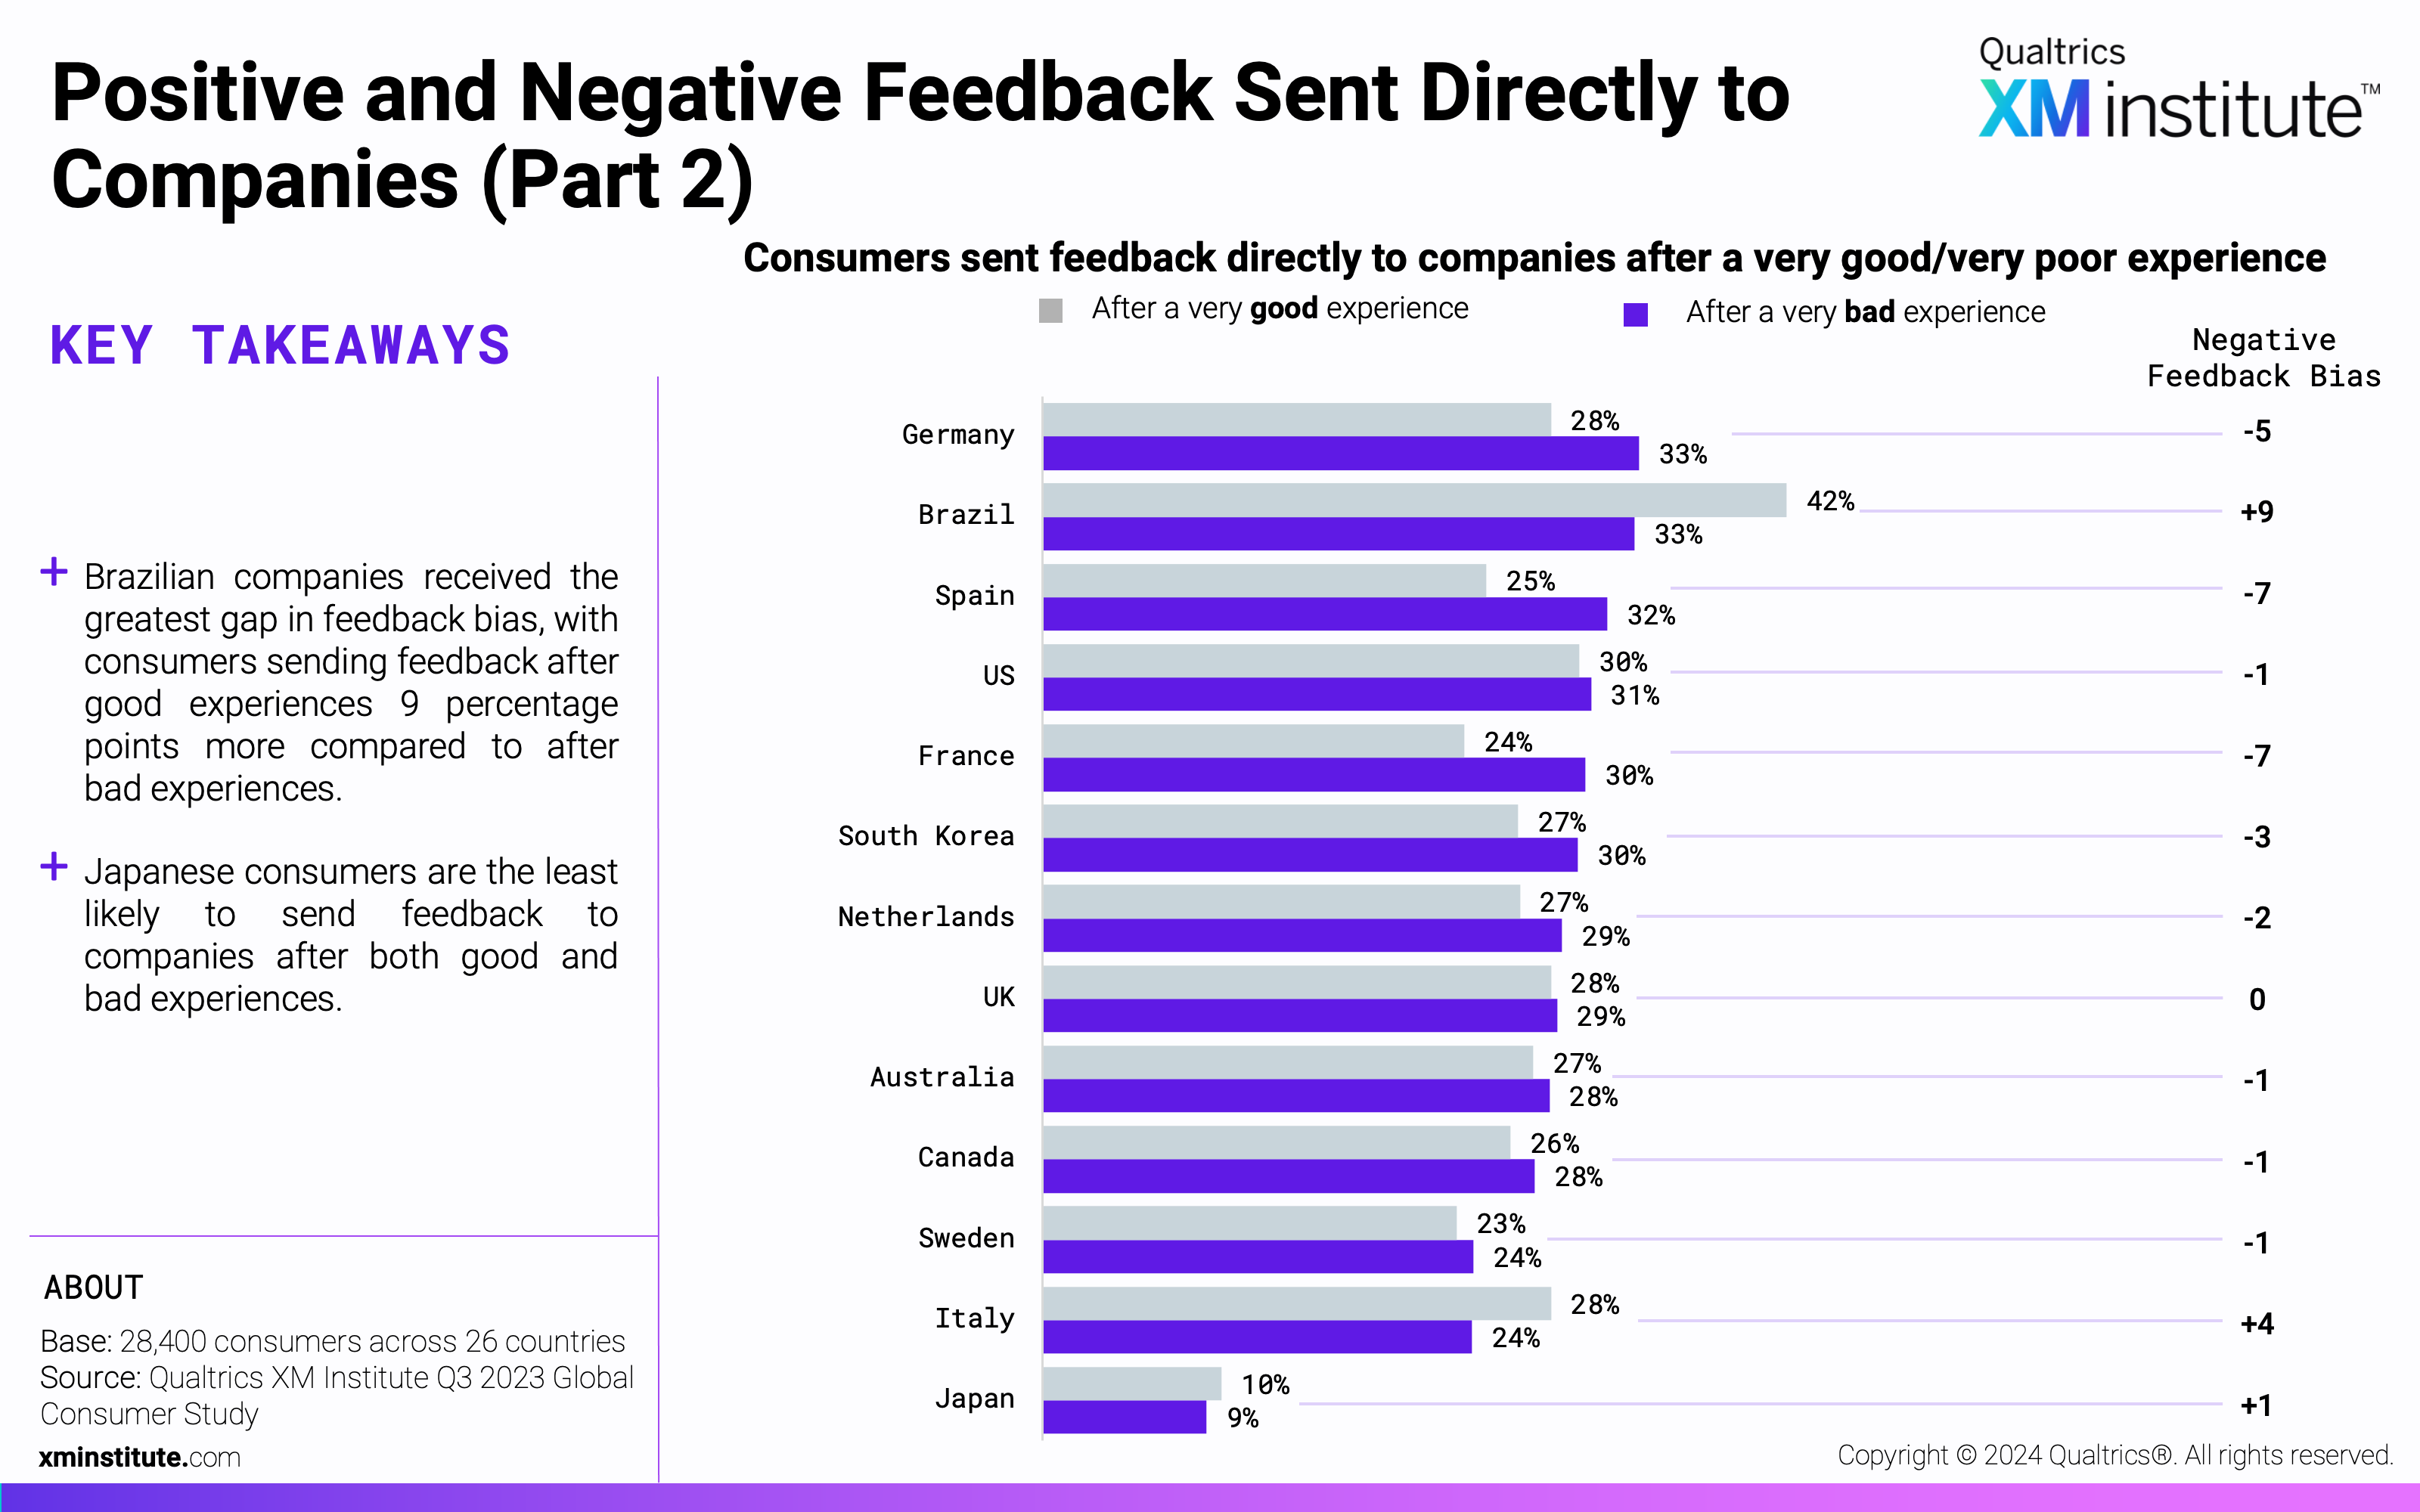
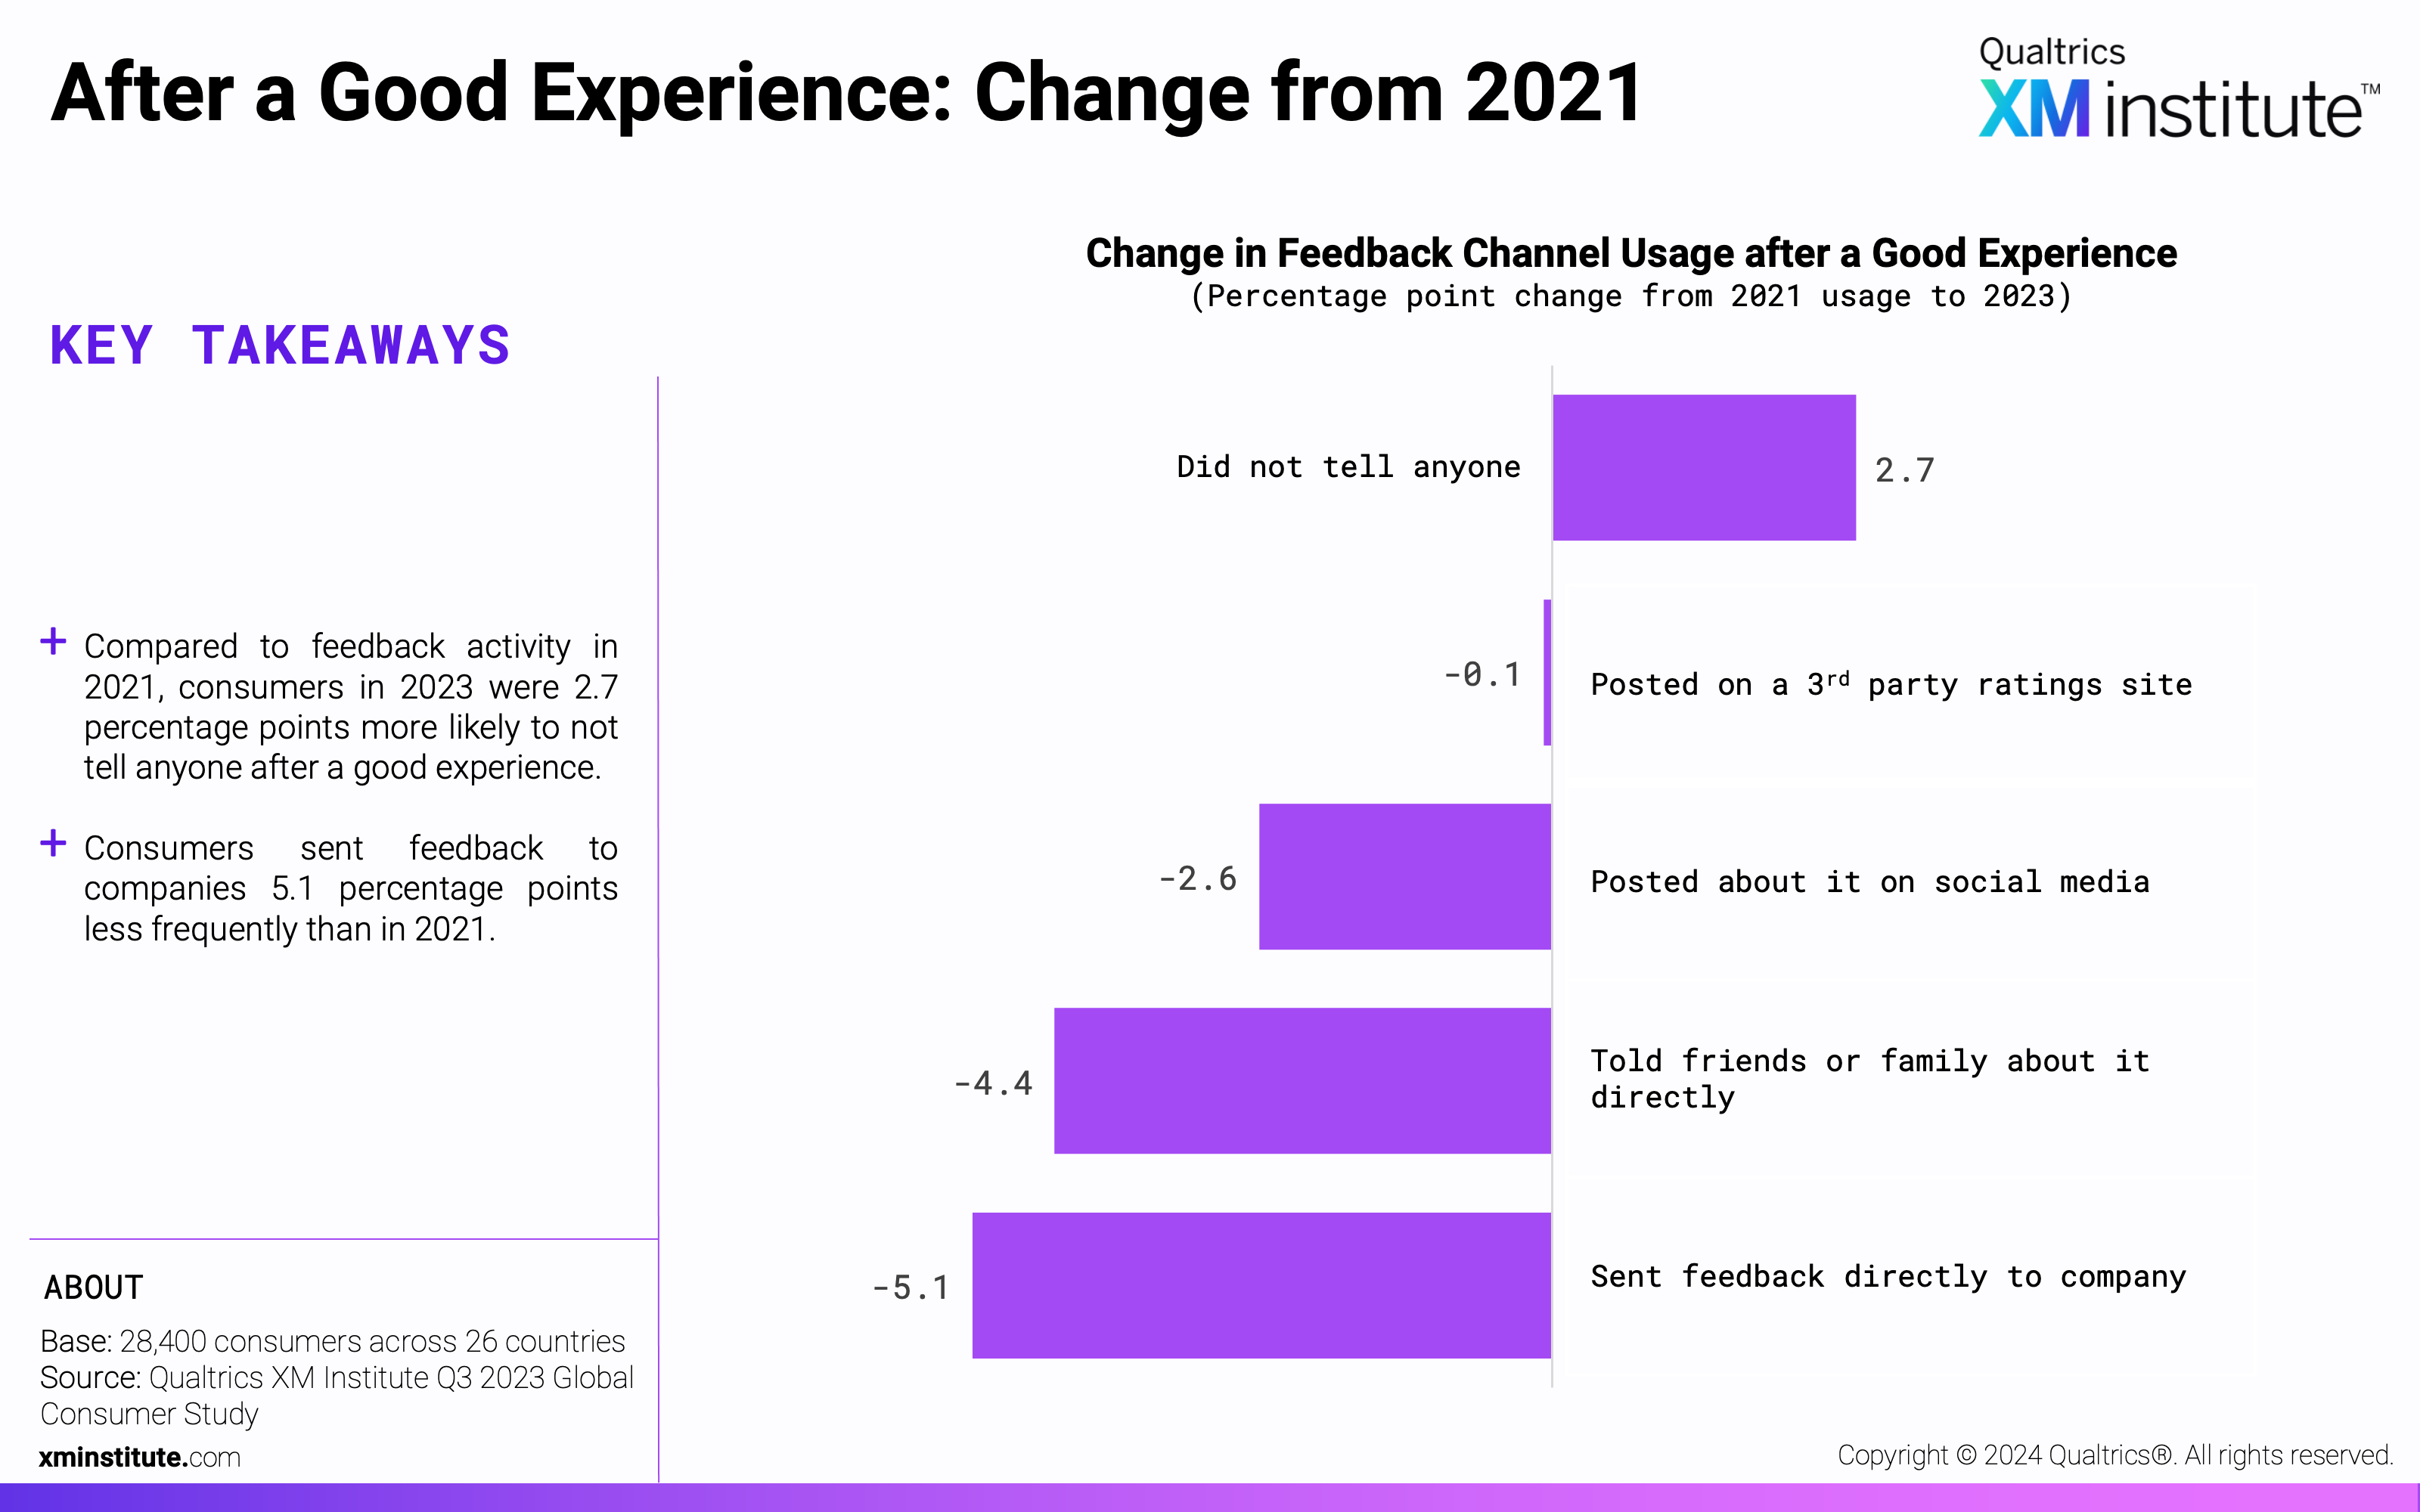
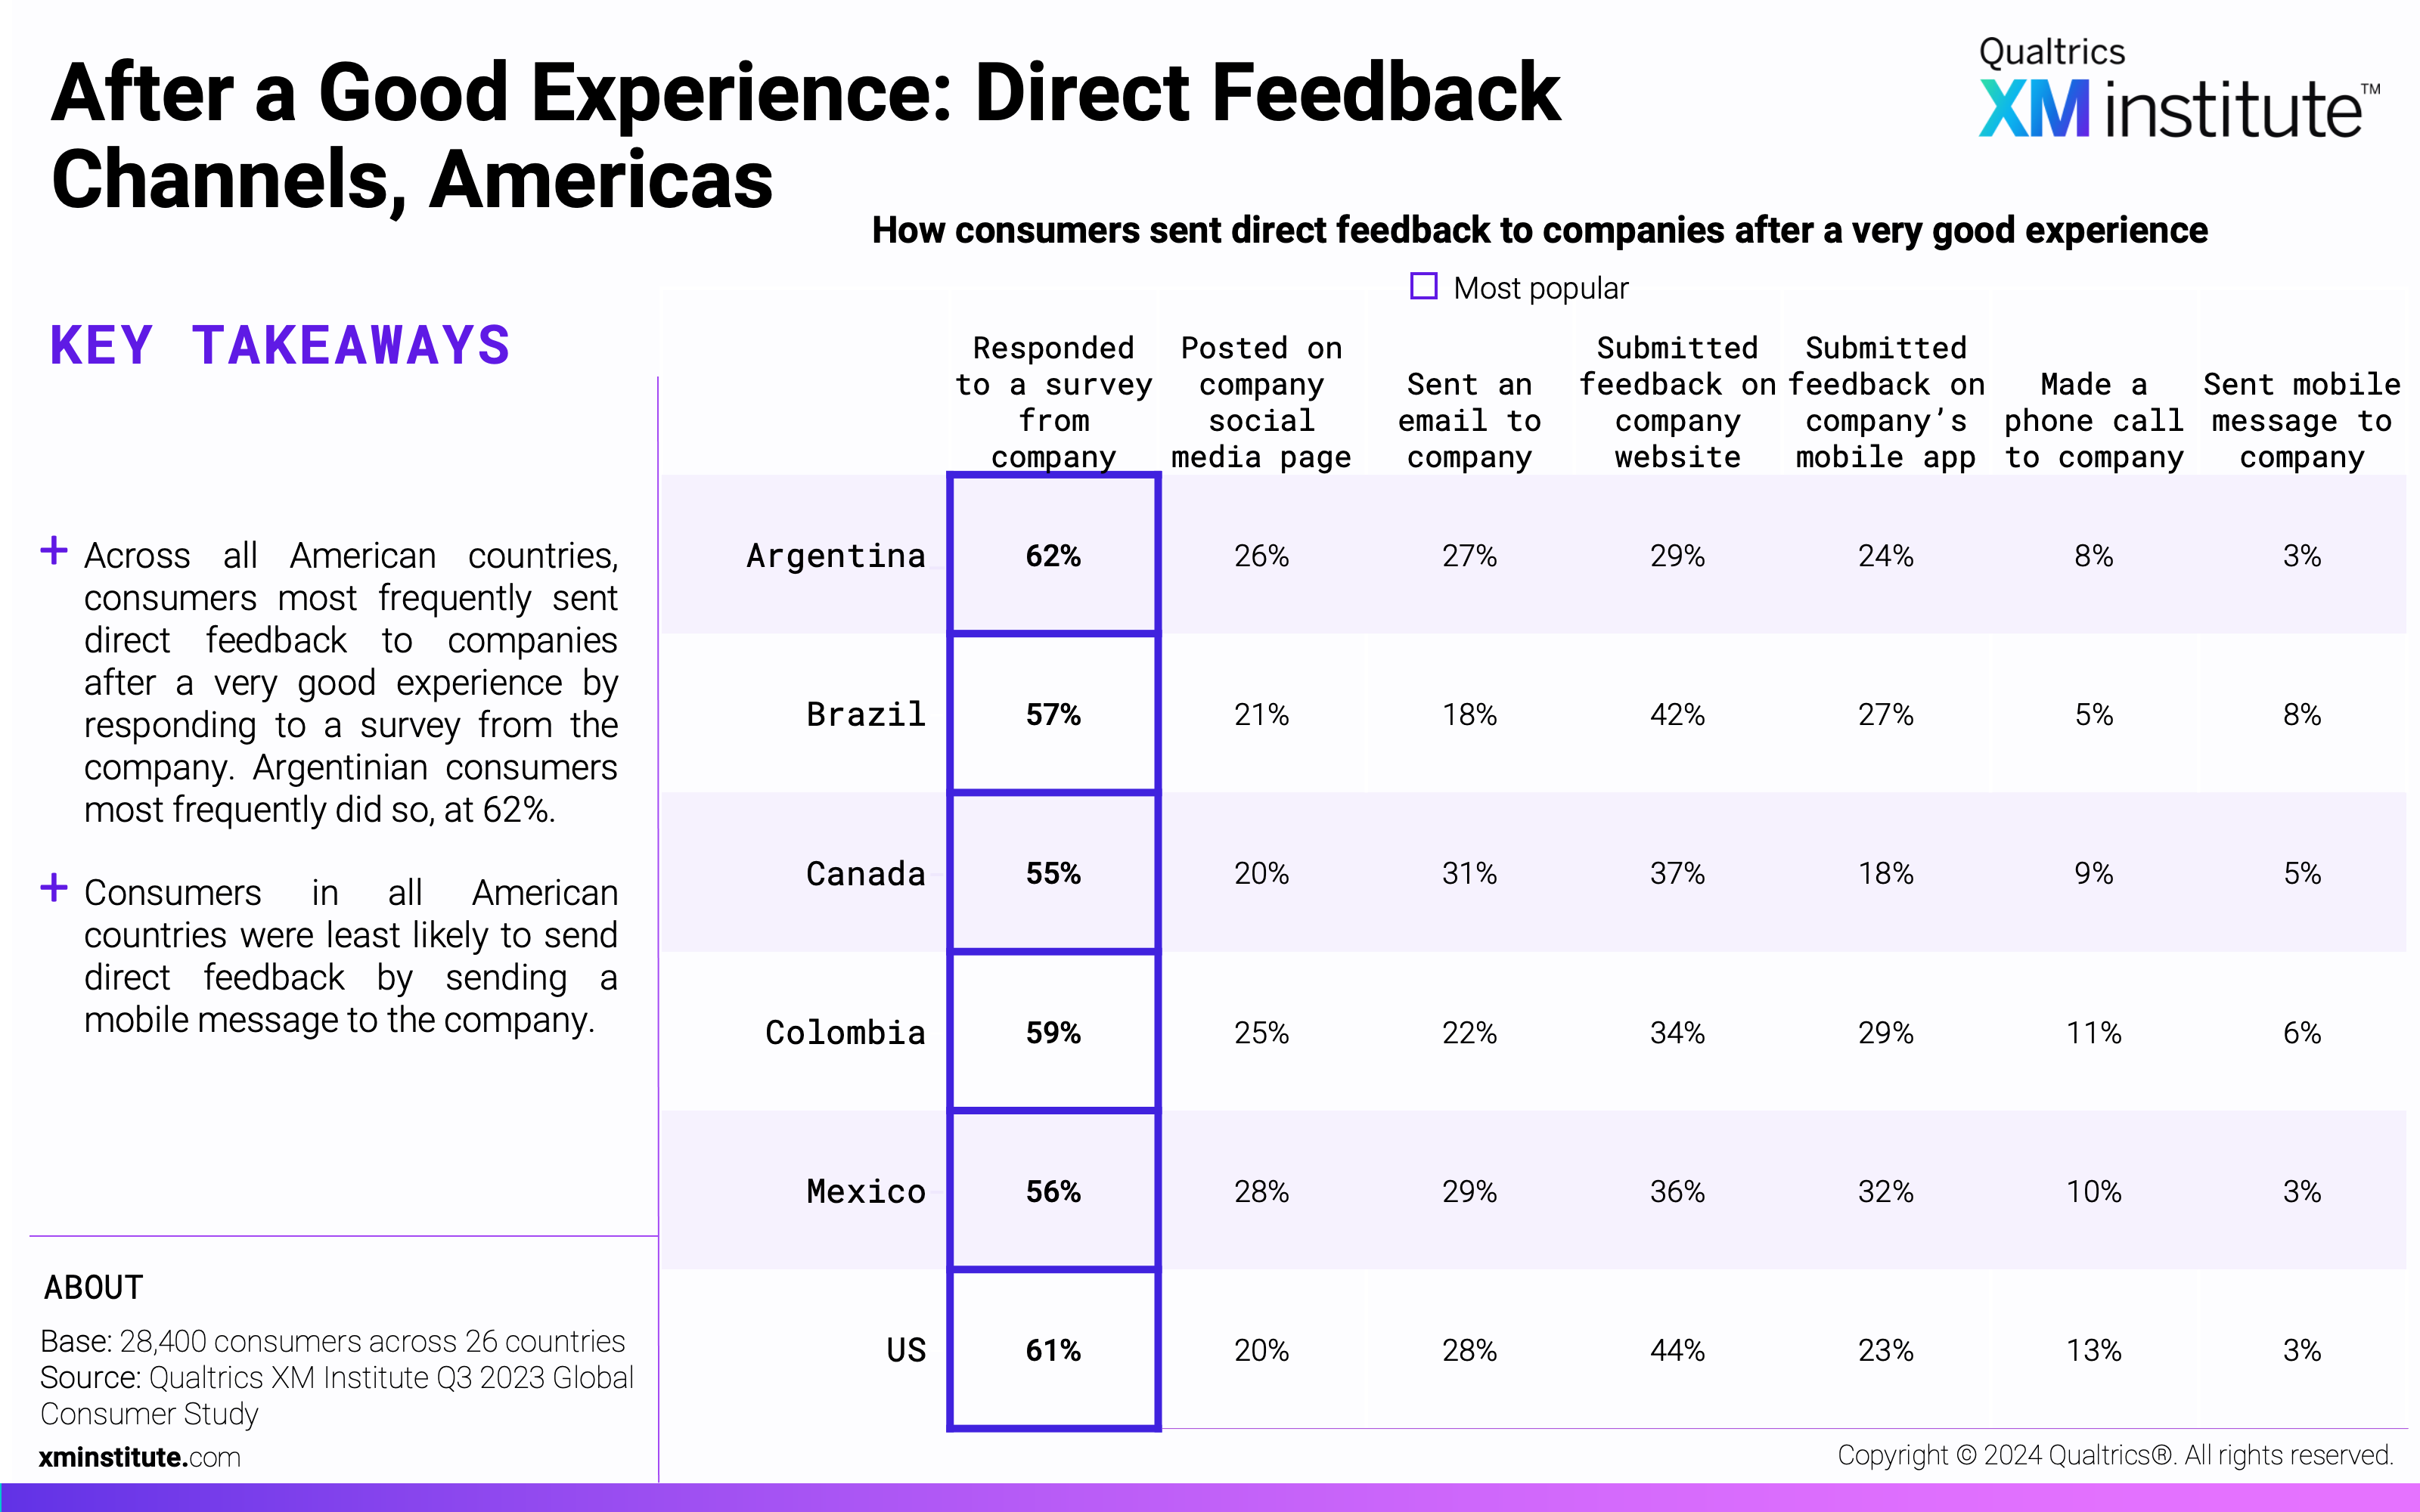
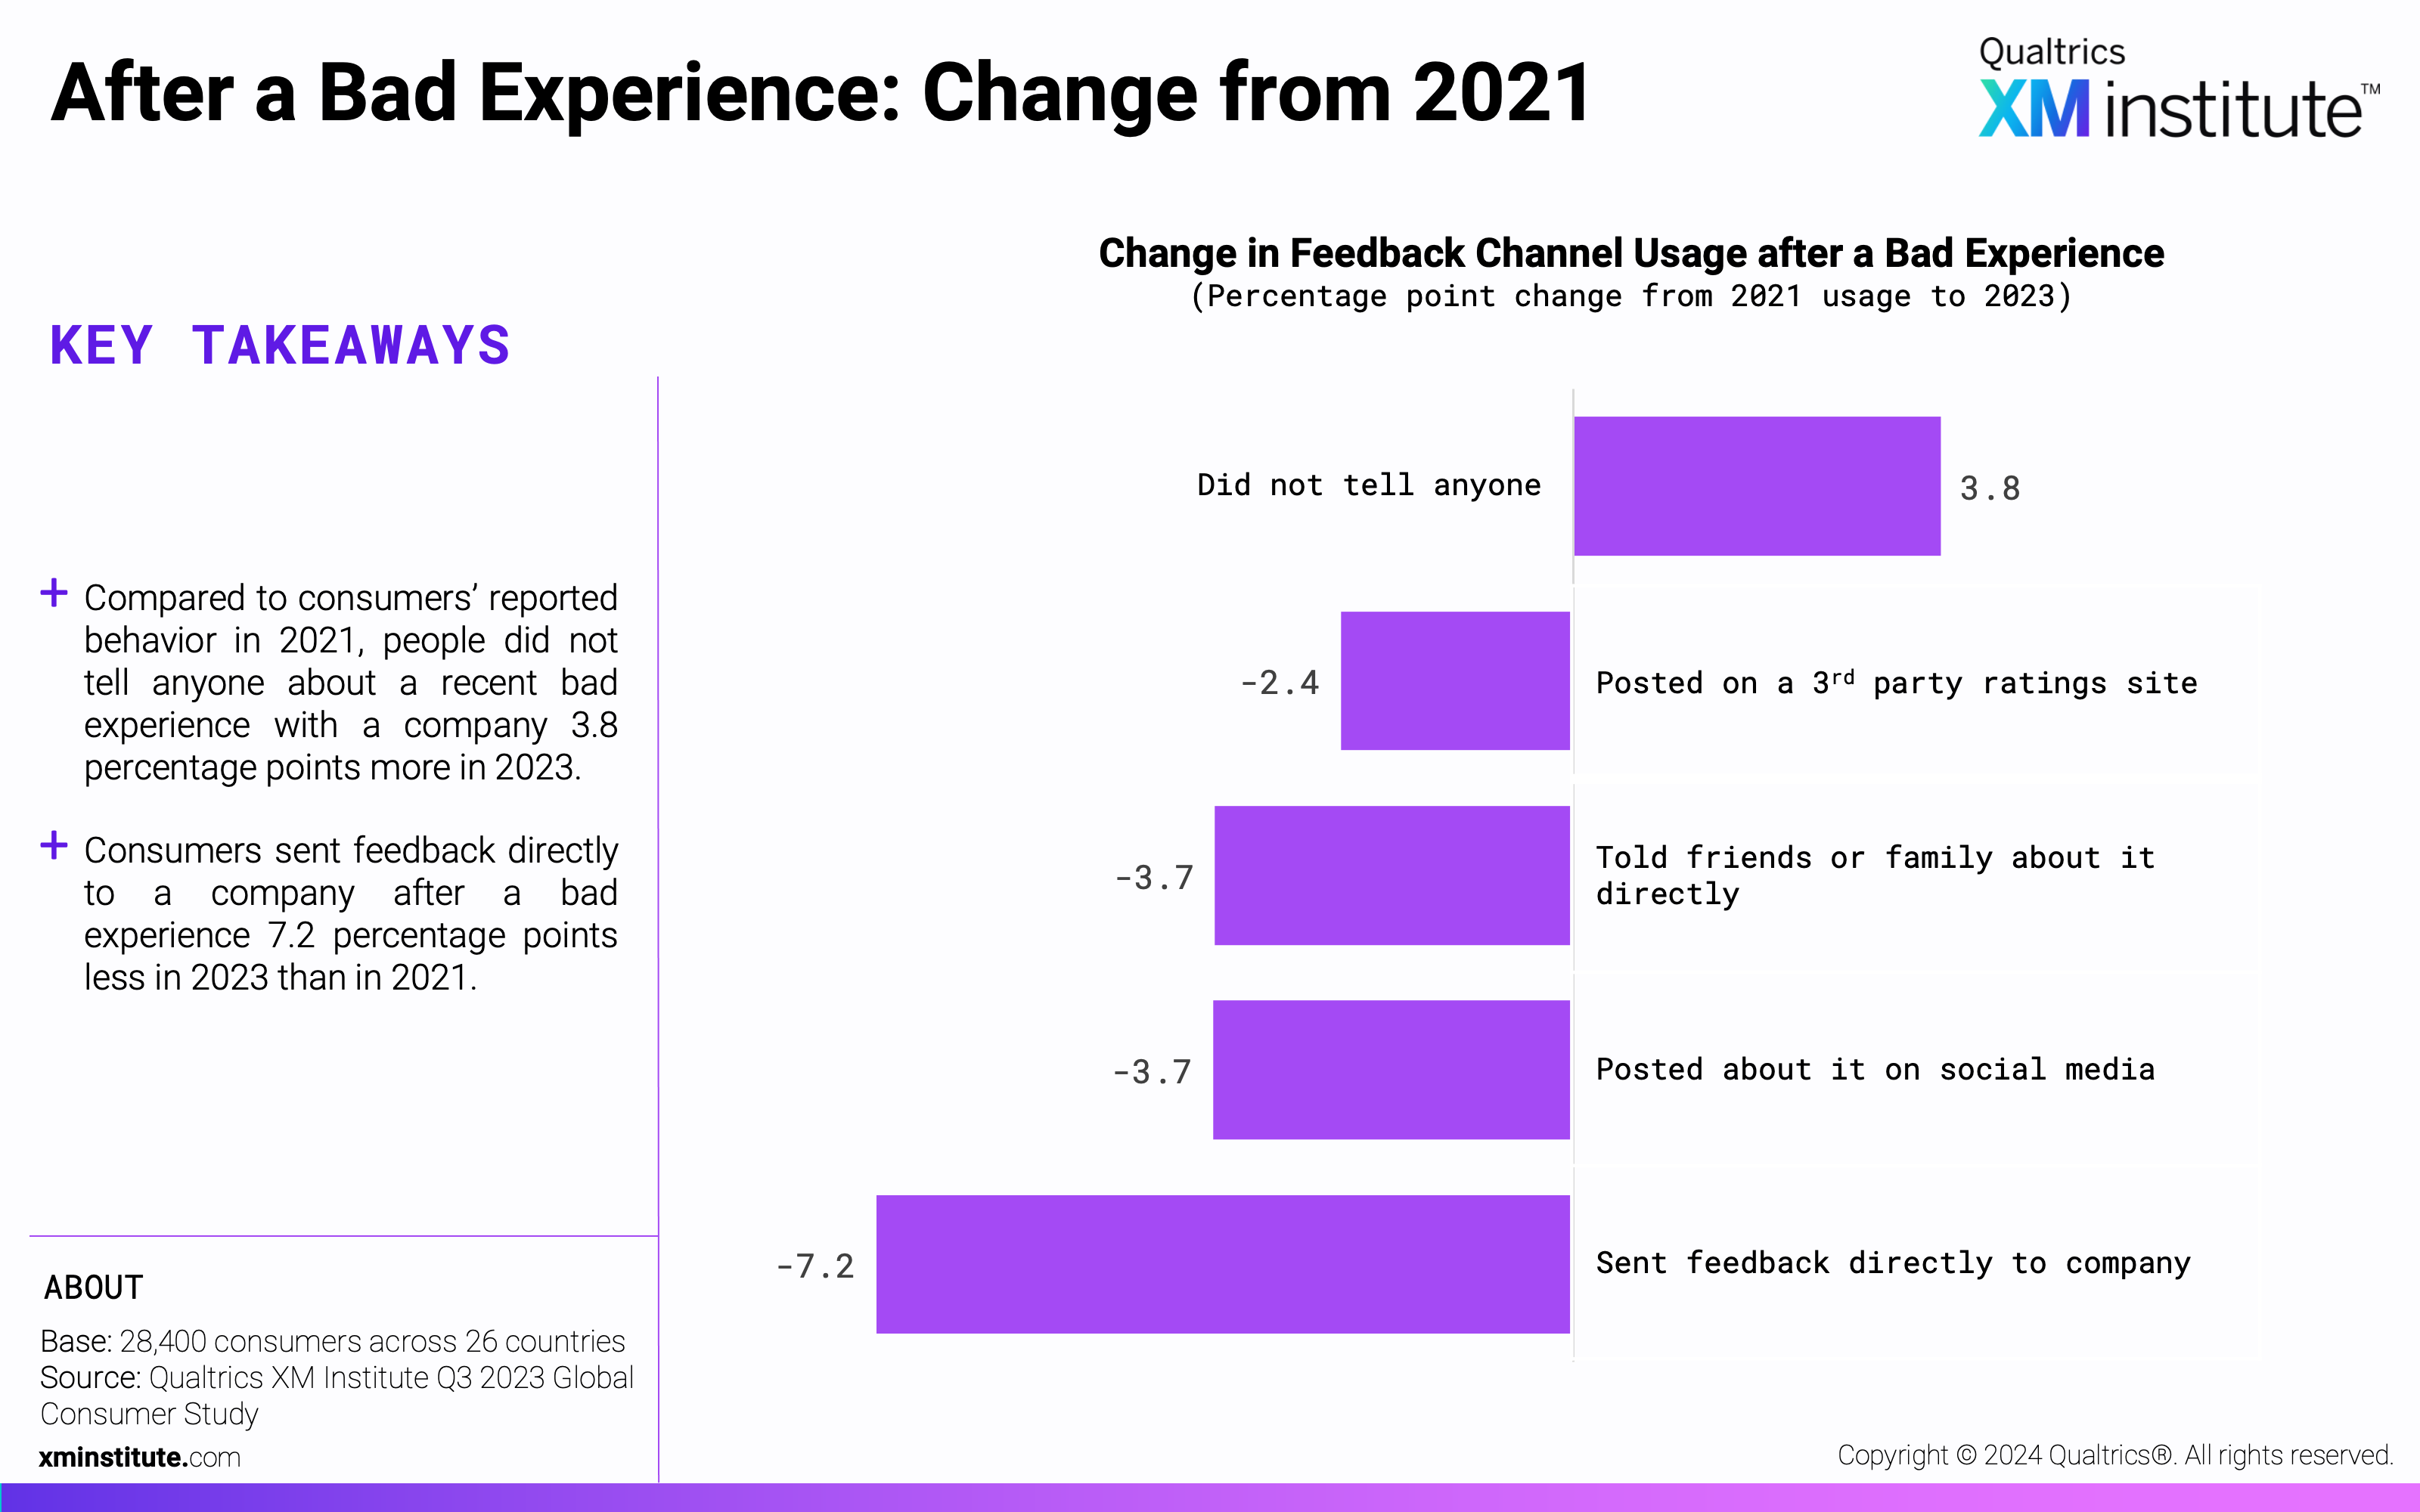
- Consumers today are less likely to give companies feedback directly. After a good experience, 33% of consumers shared feedback directly with a company, a 5.1 percentage-points drop from 2021. The percentage of consumers who shared direct feedback following a poor experience dropped even more, dipping 7.2 percentage points.
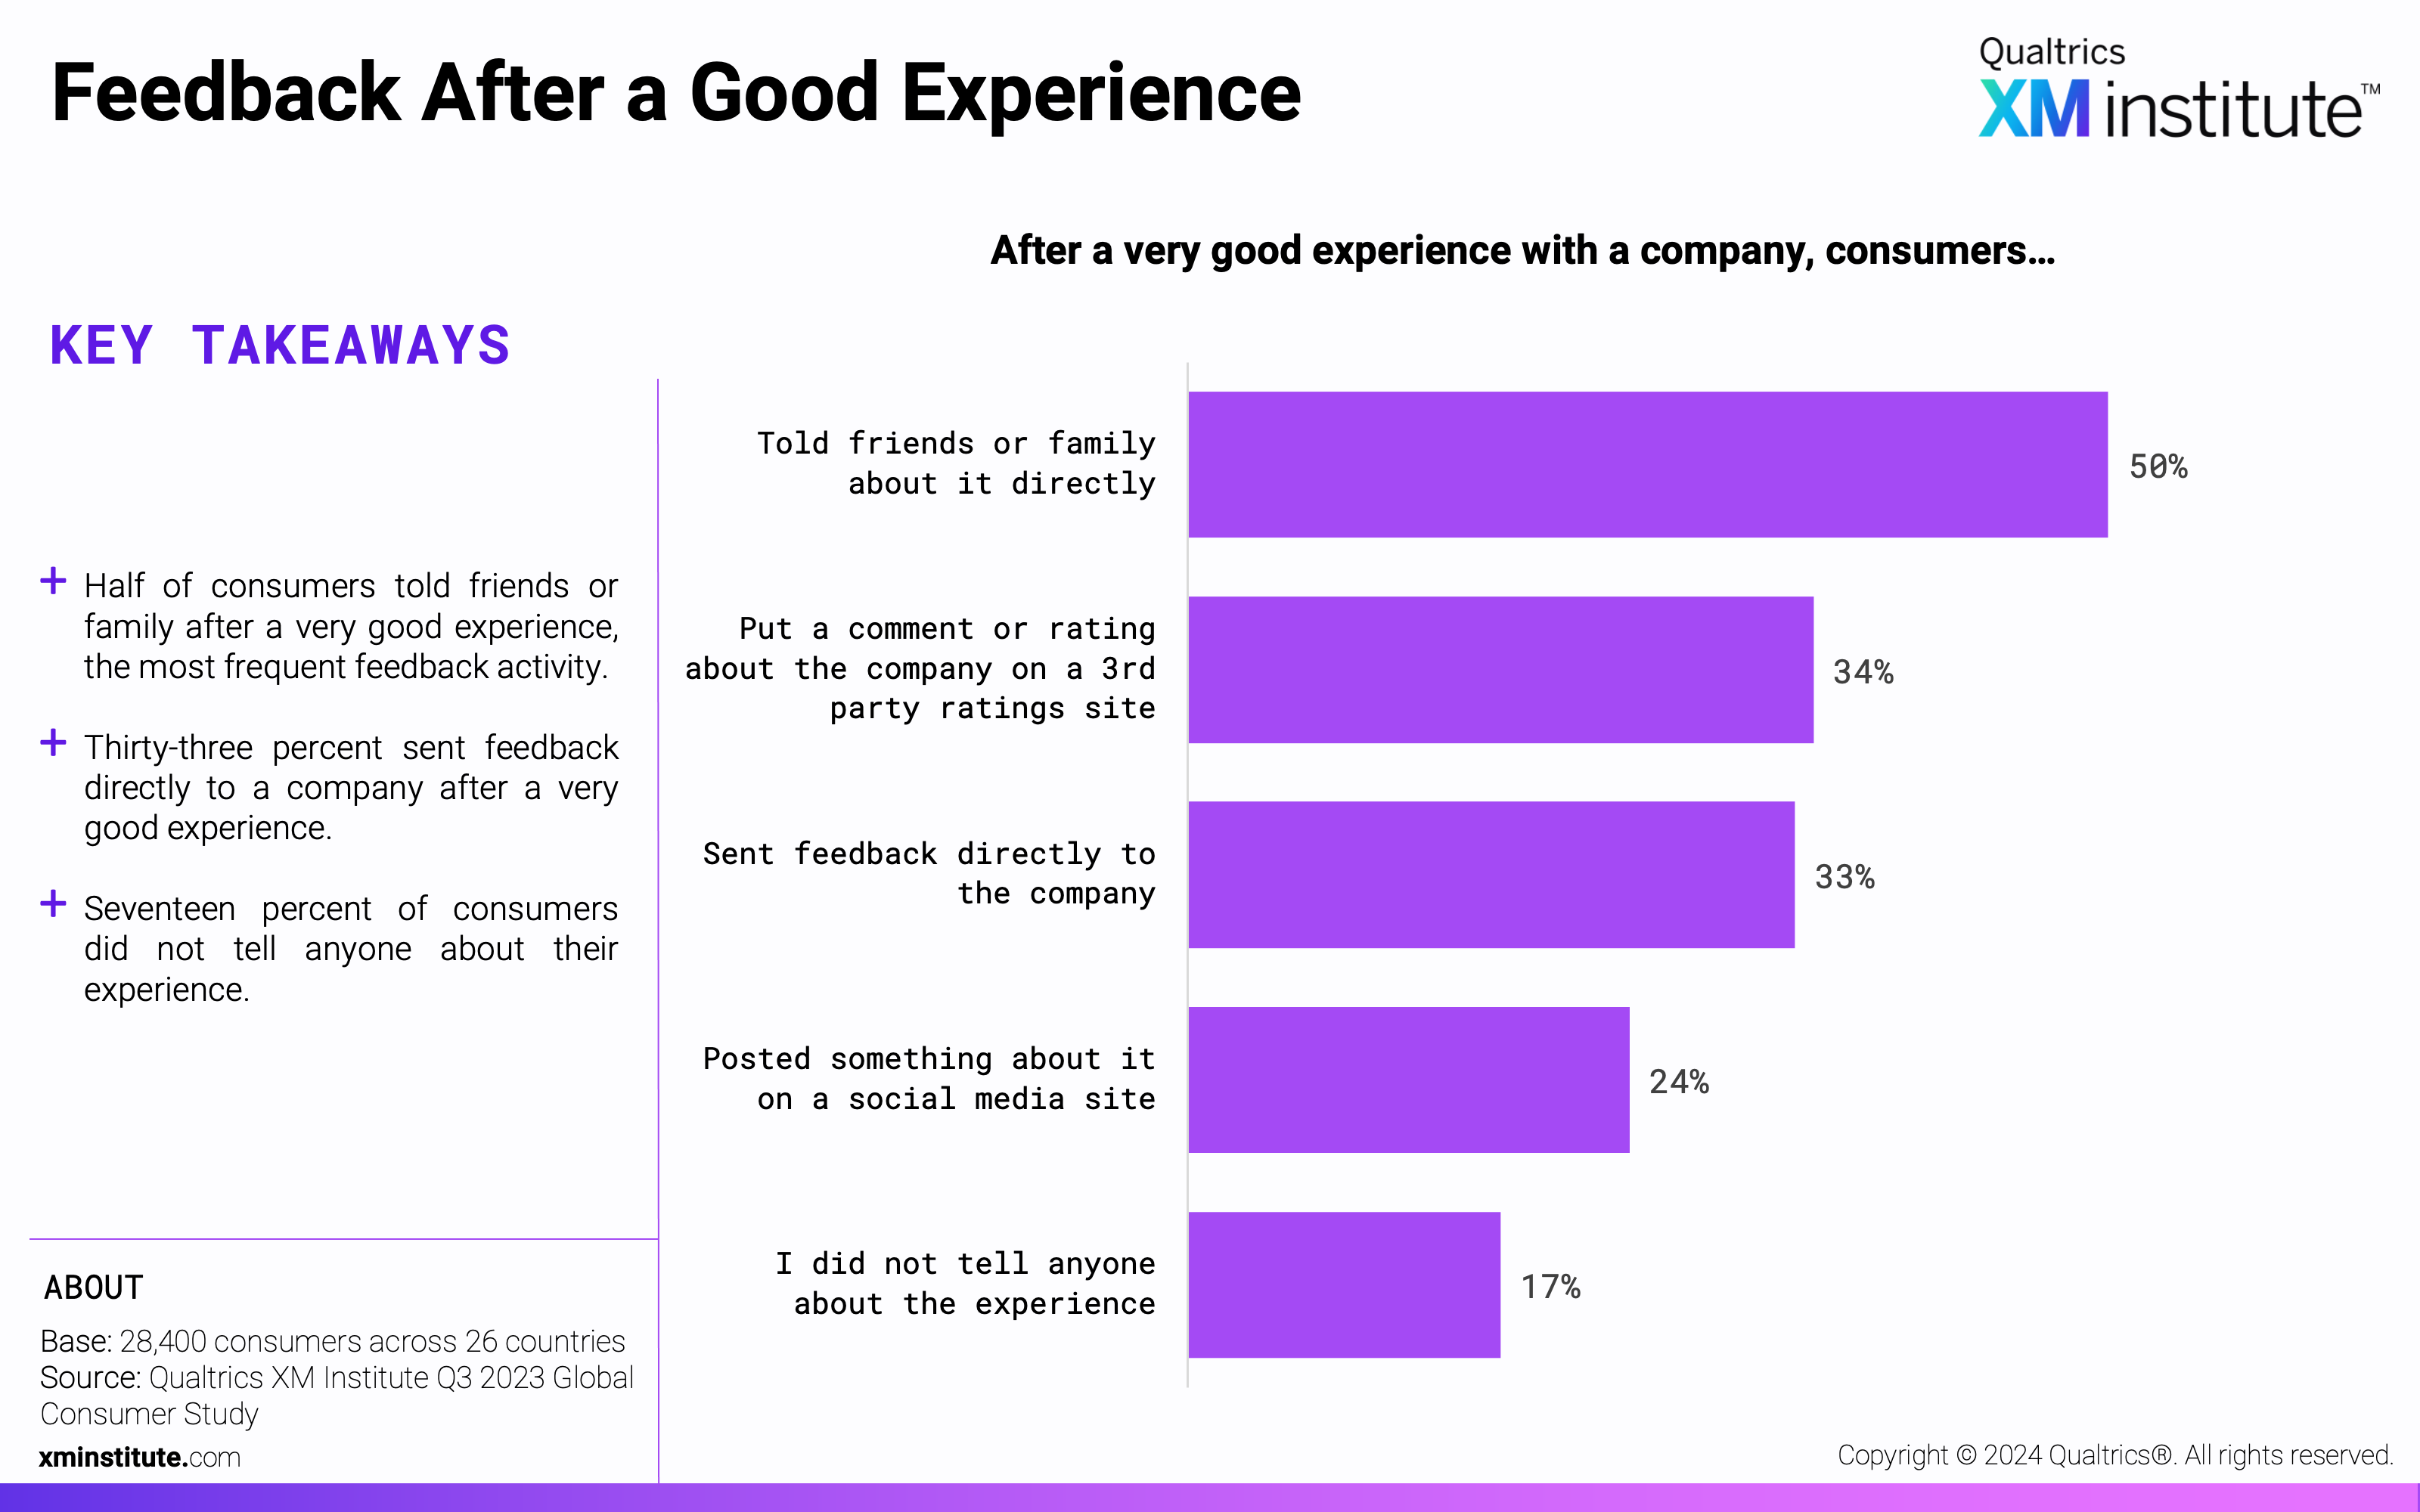
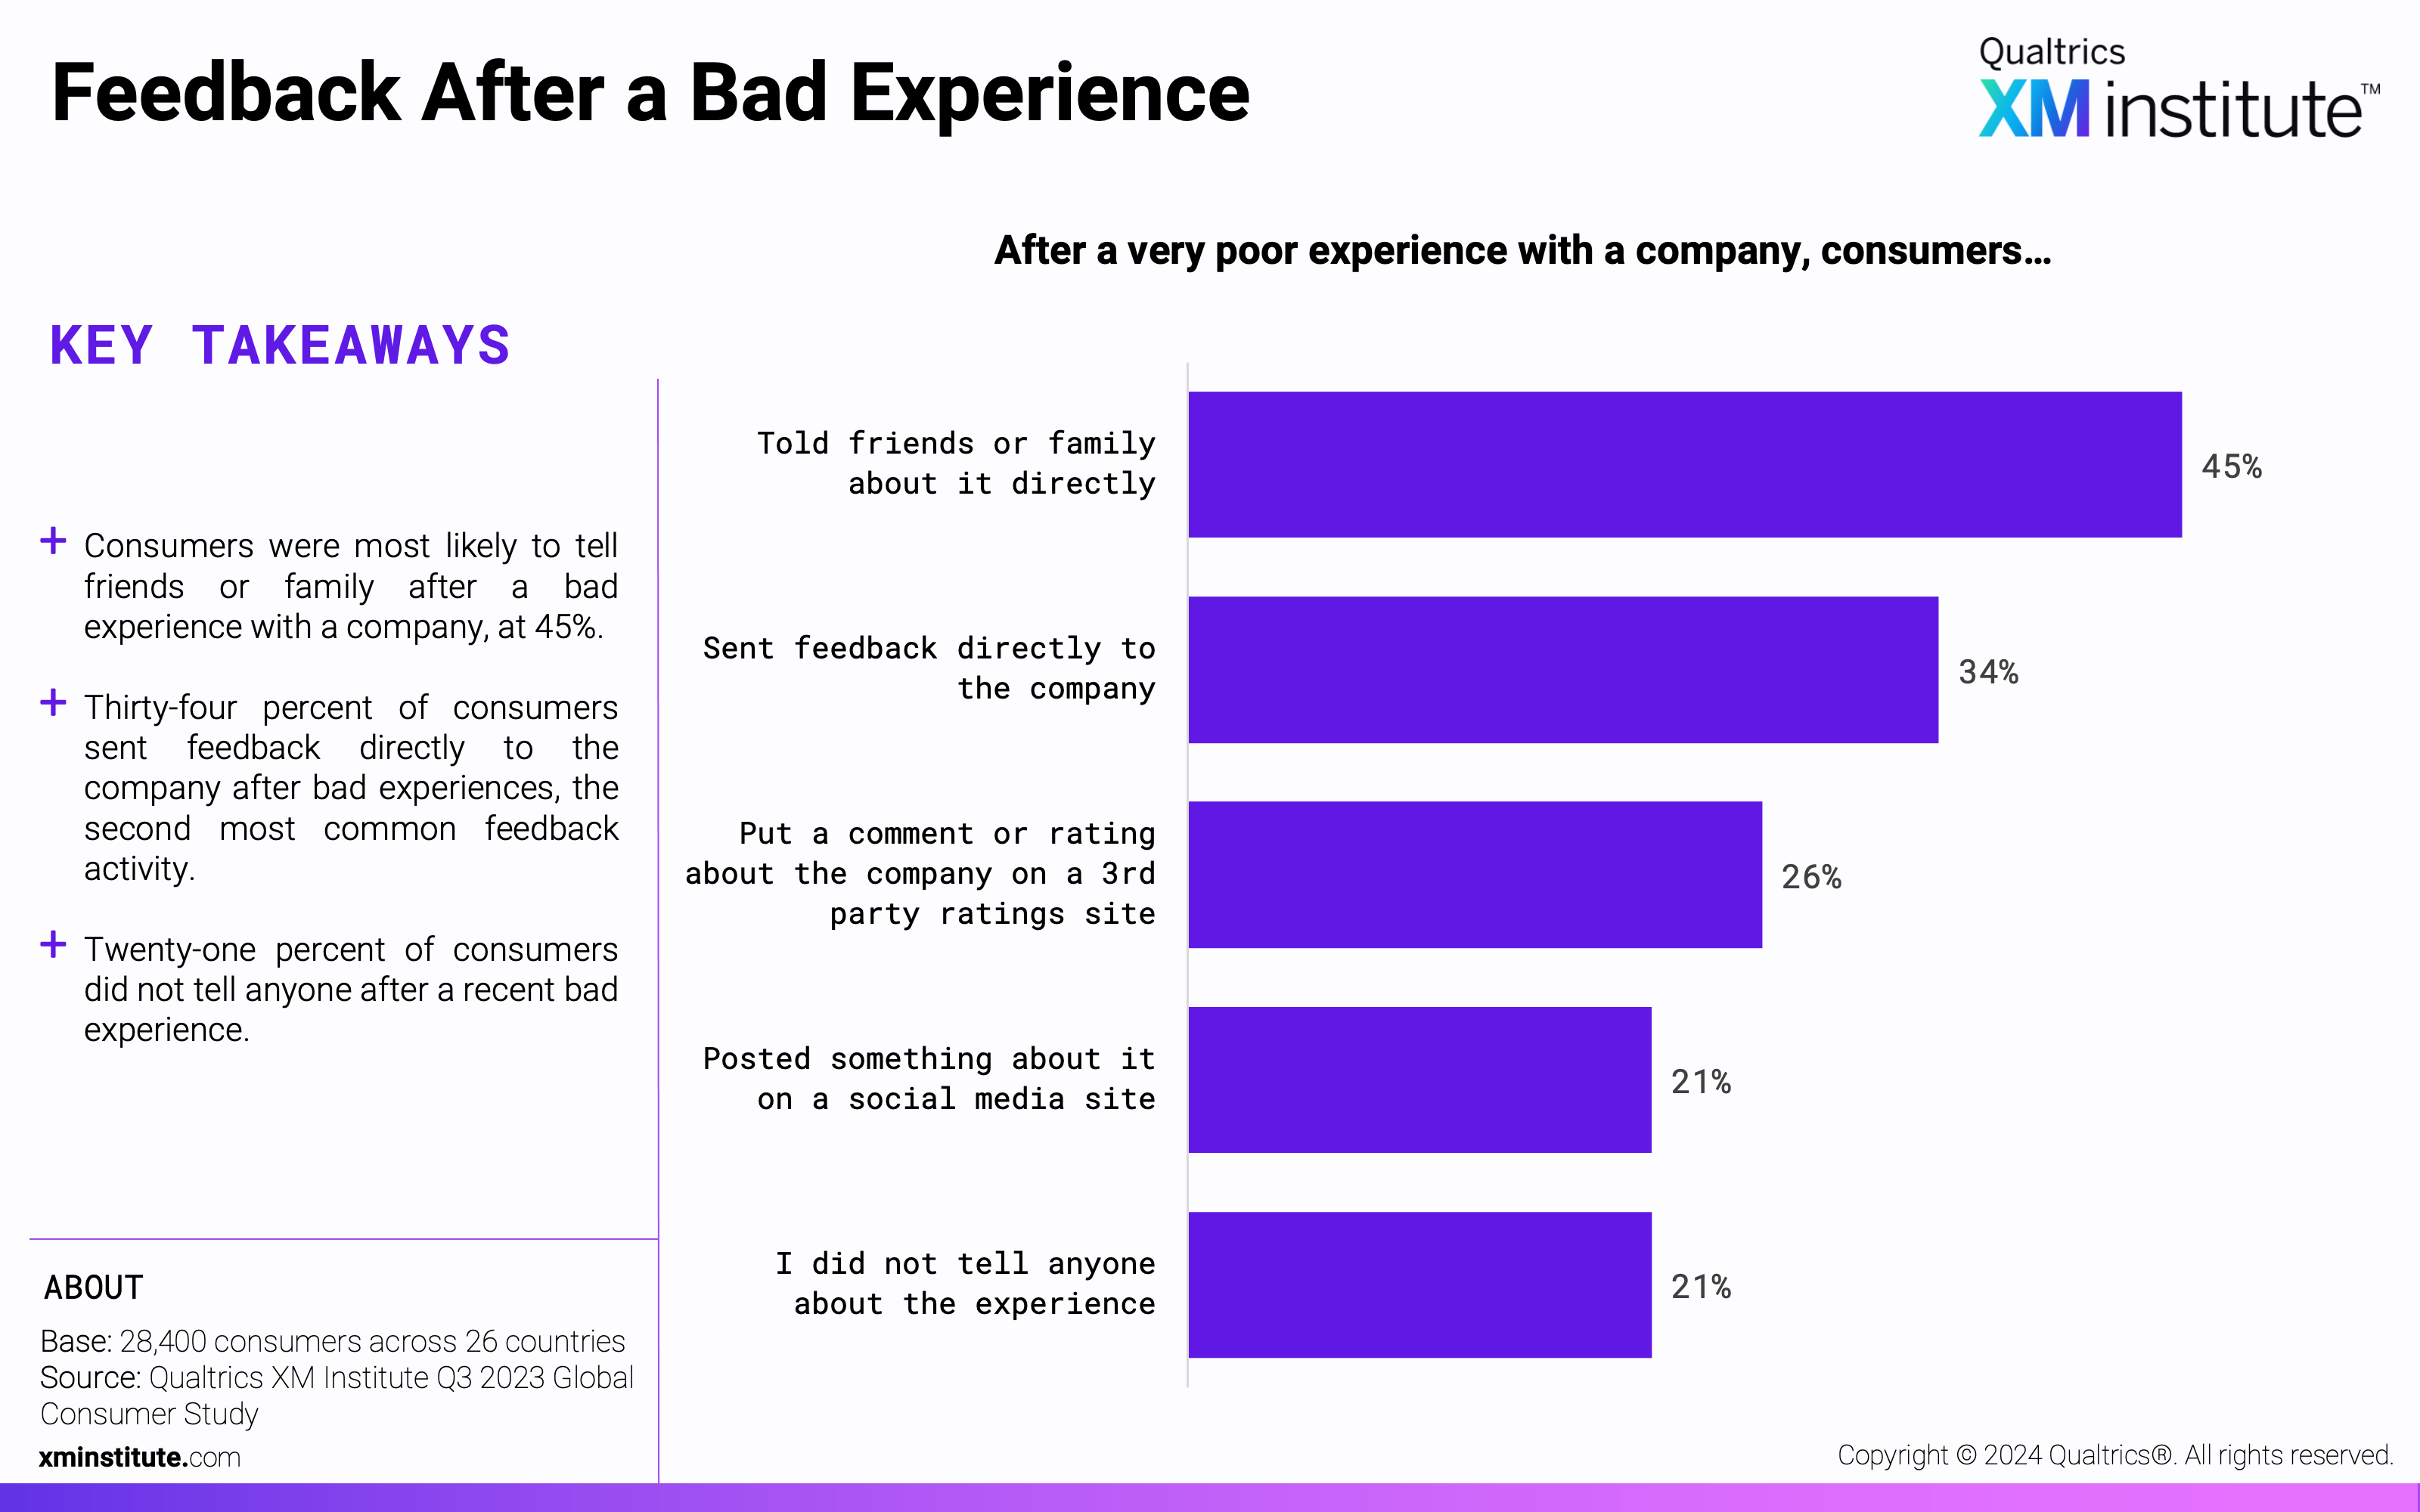
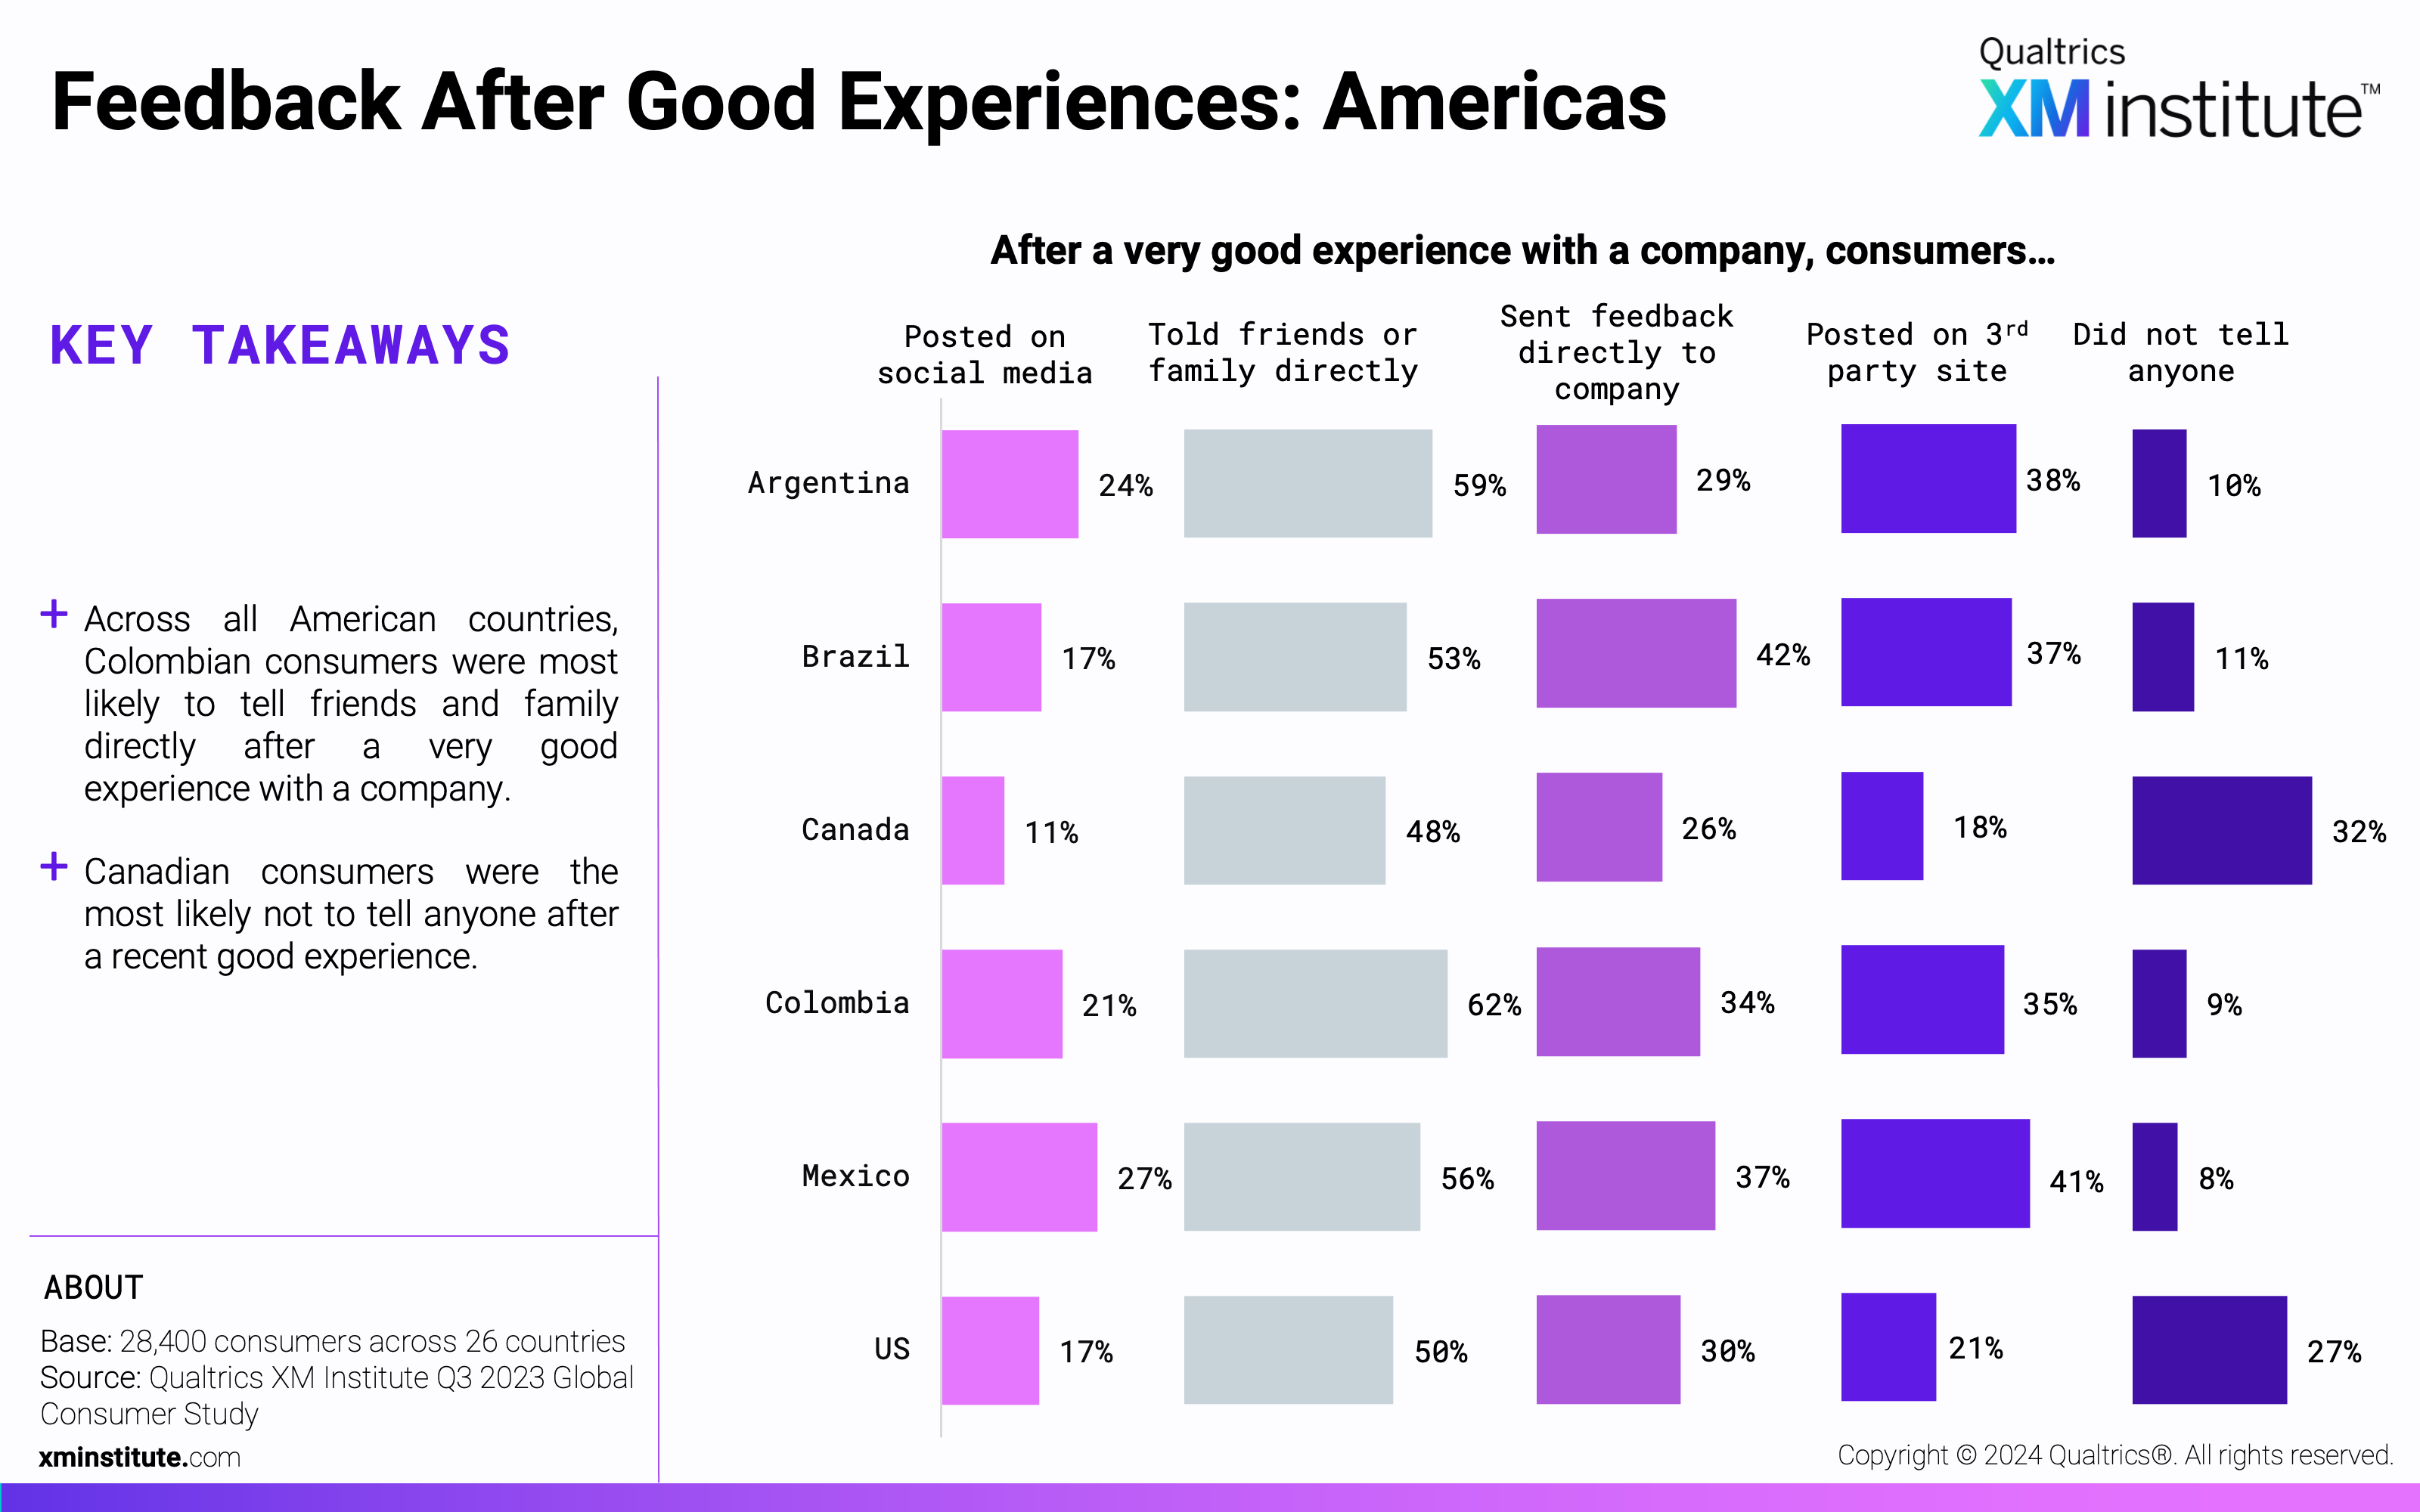
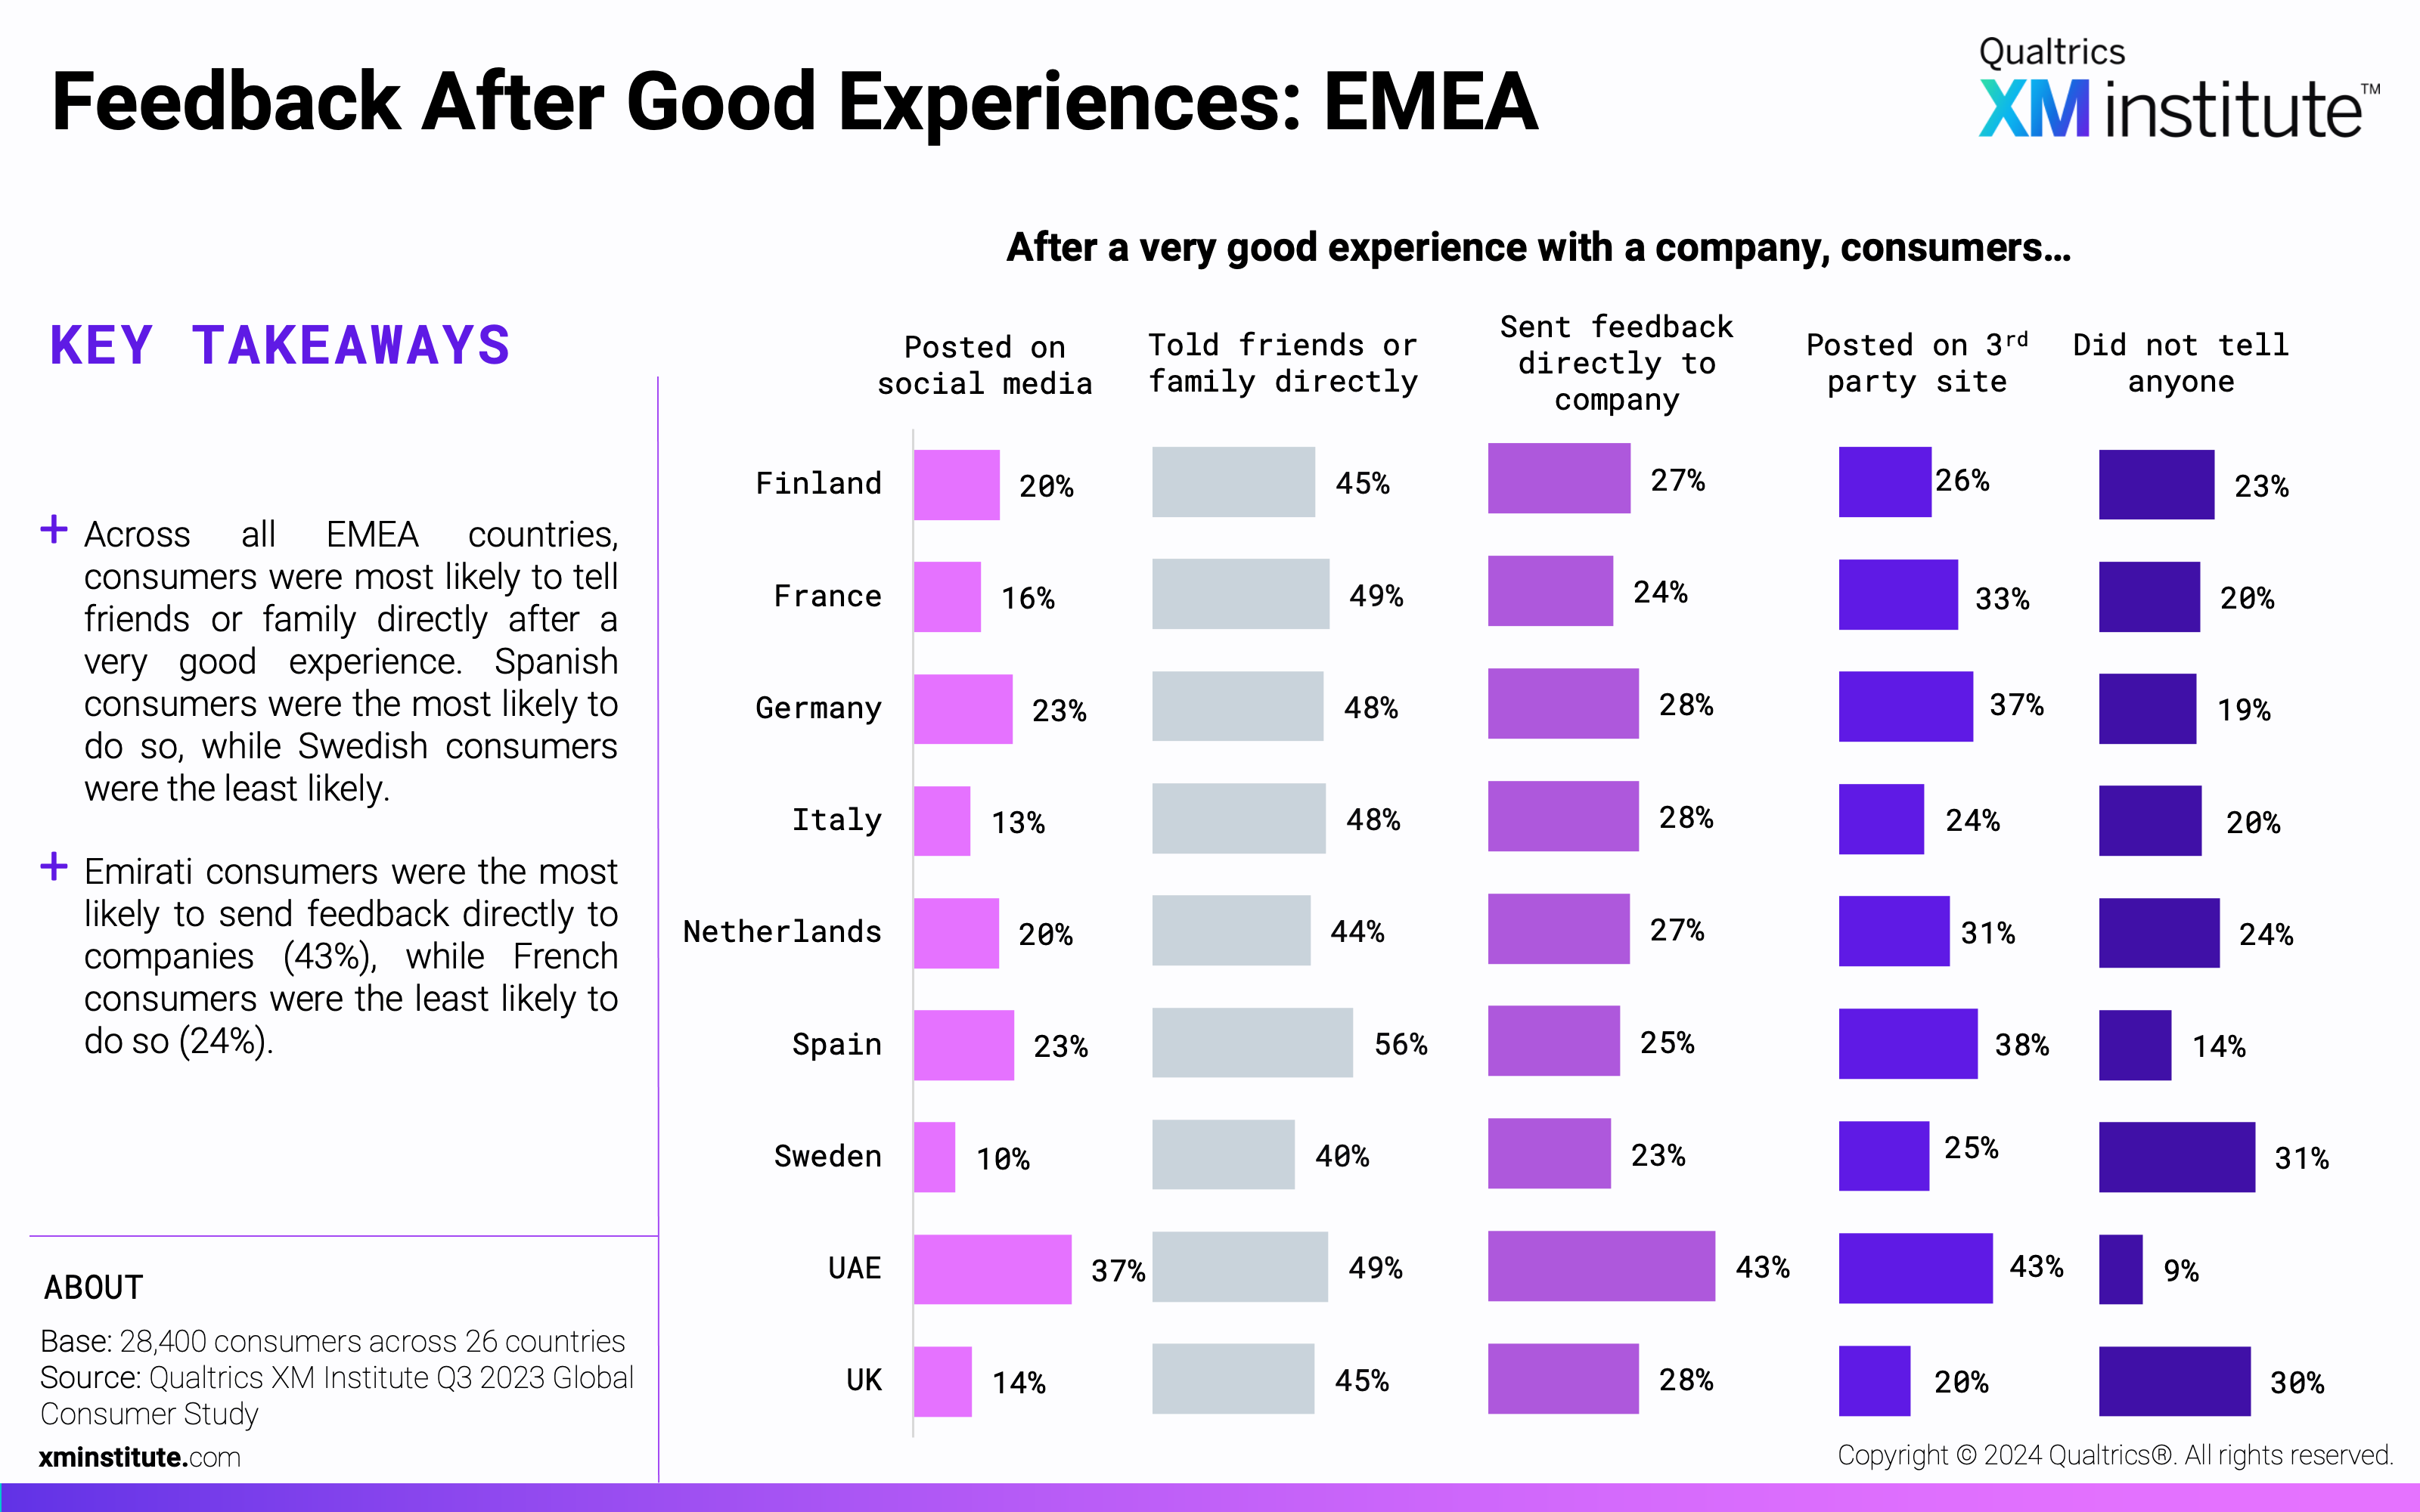
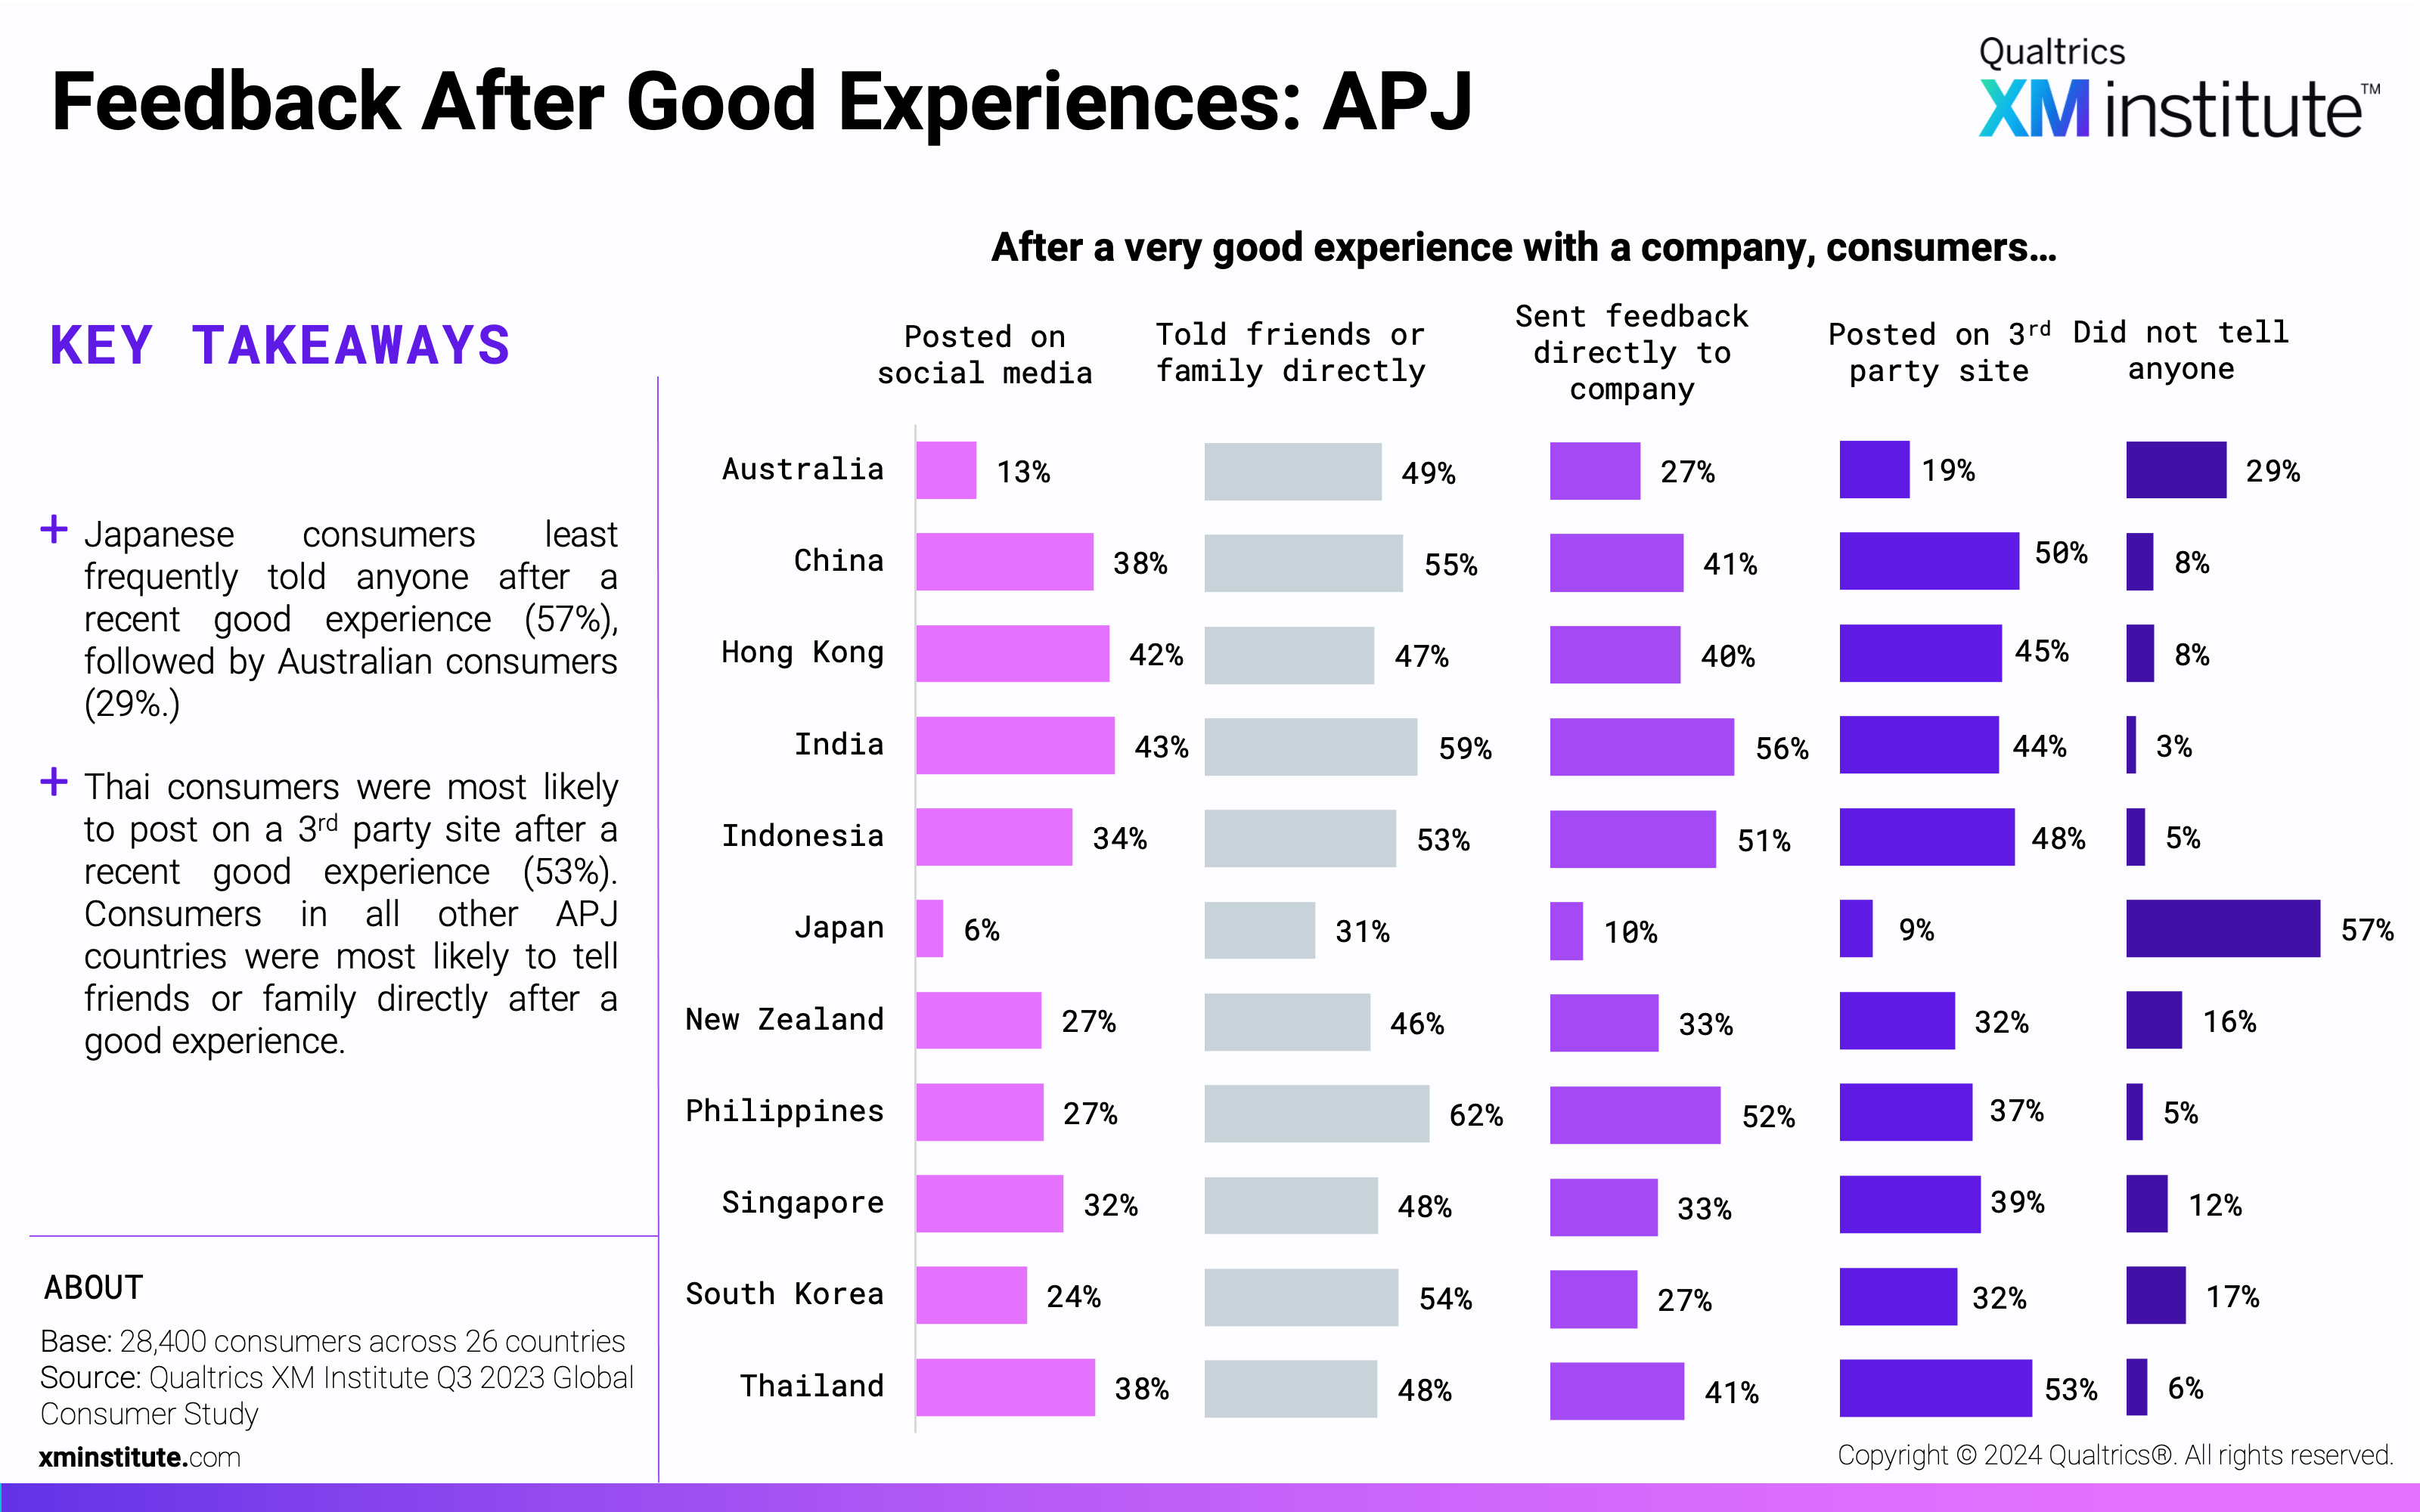
- People most frequently share feedback with friends and family. Consumers were most likely to tell friends and family about both a very good (45%) and a very bad (50%) experience, while they are least likely not to tell anyone about the interaction after a good experience (17%).
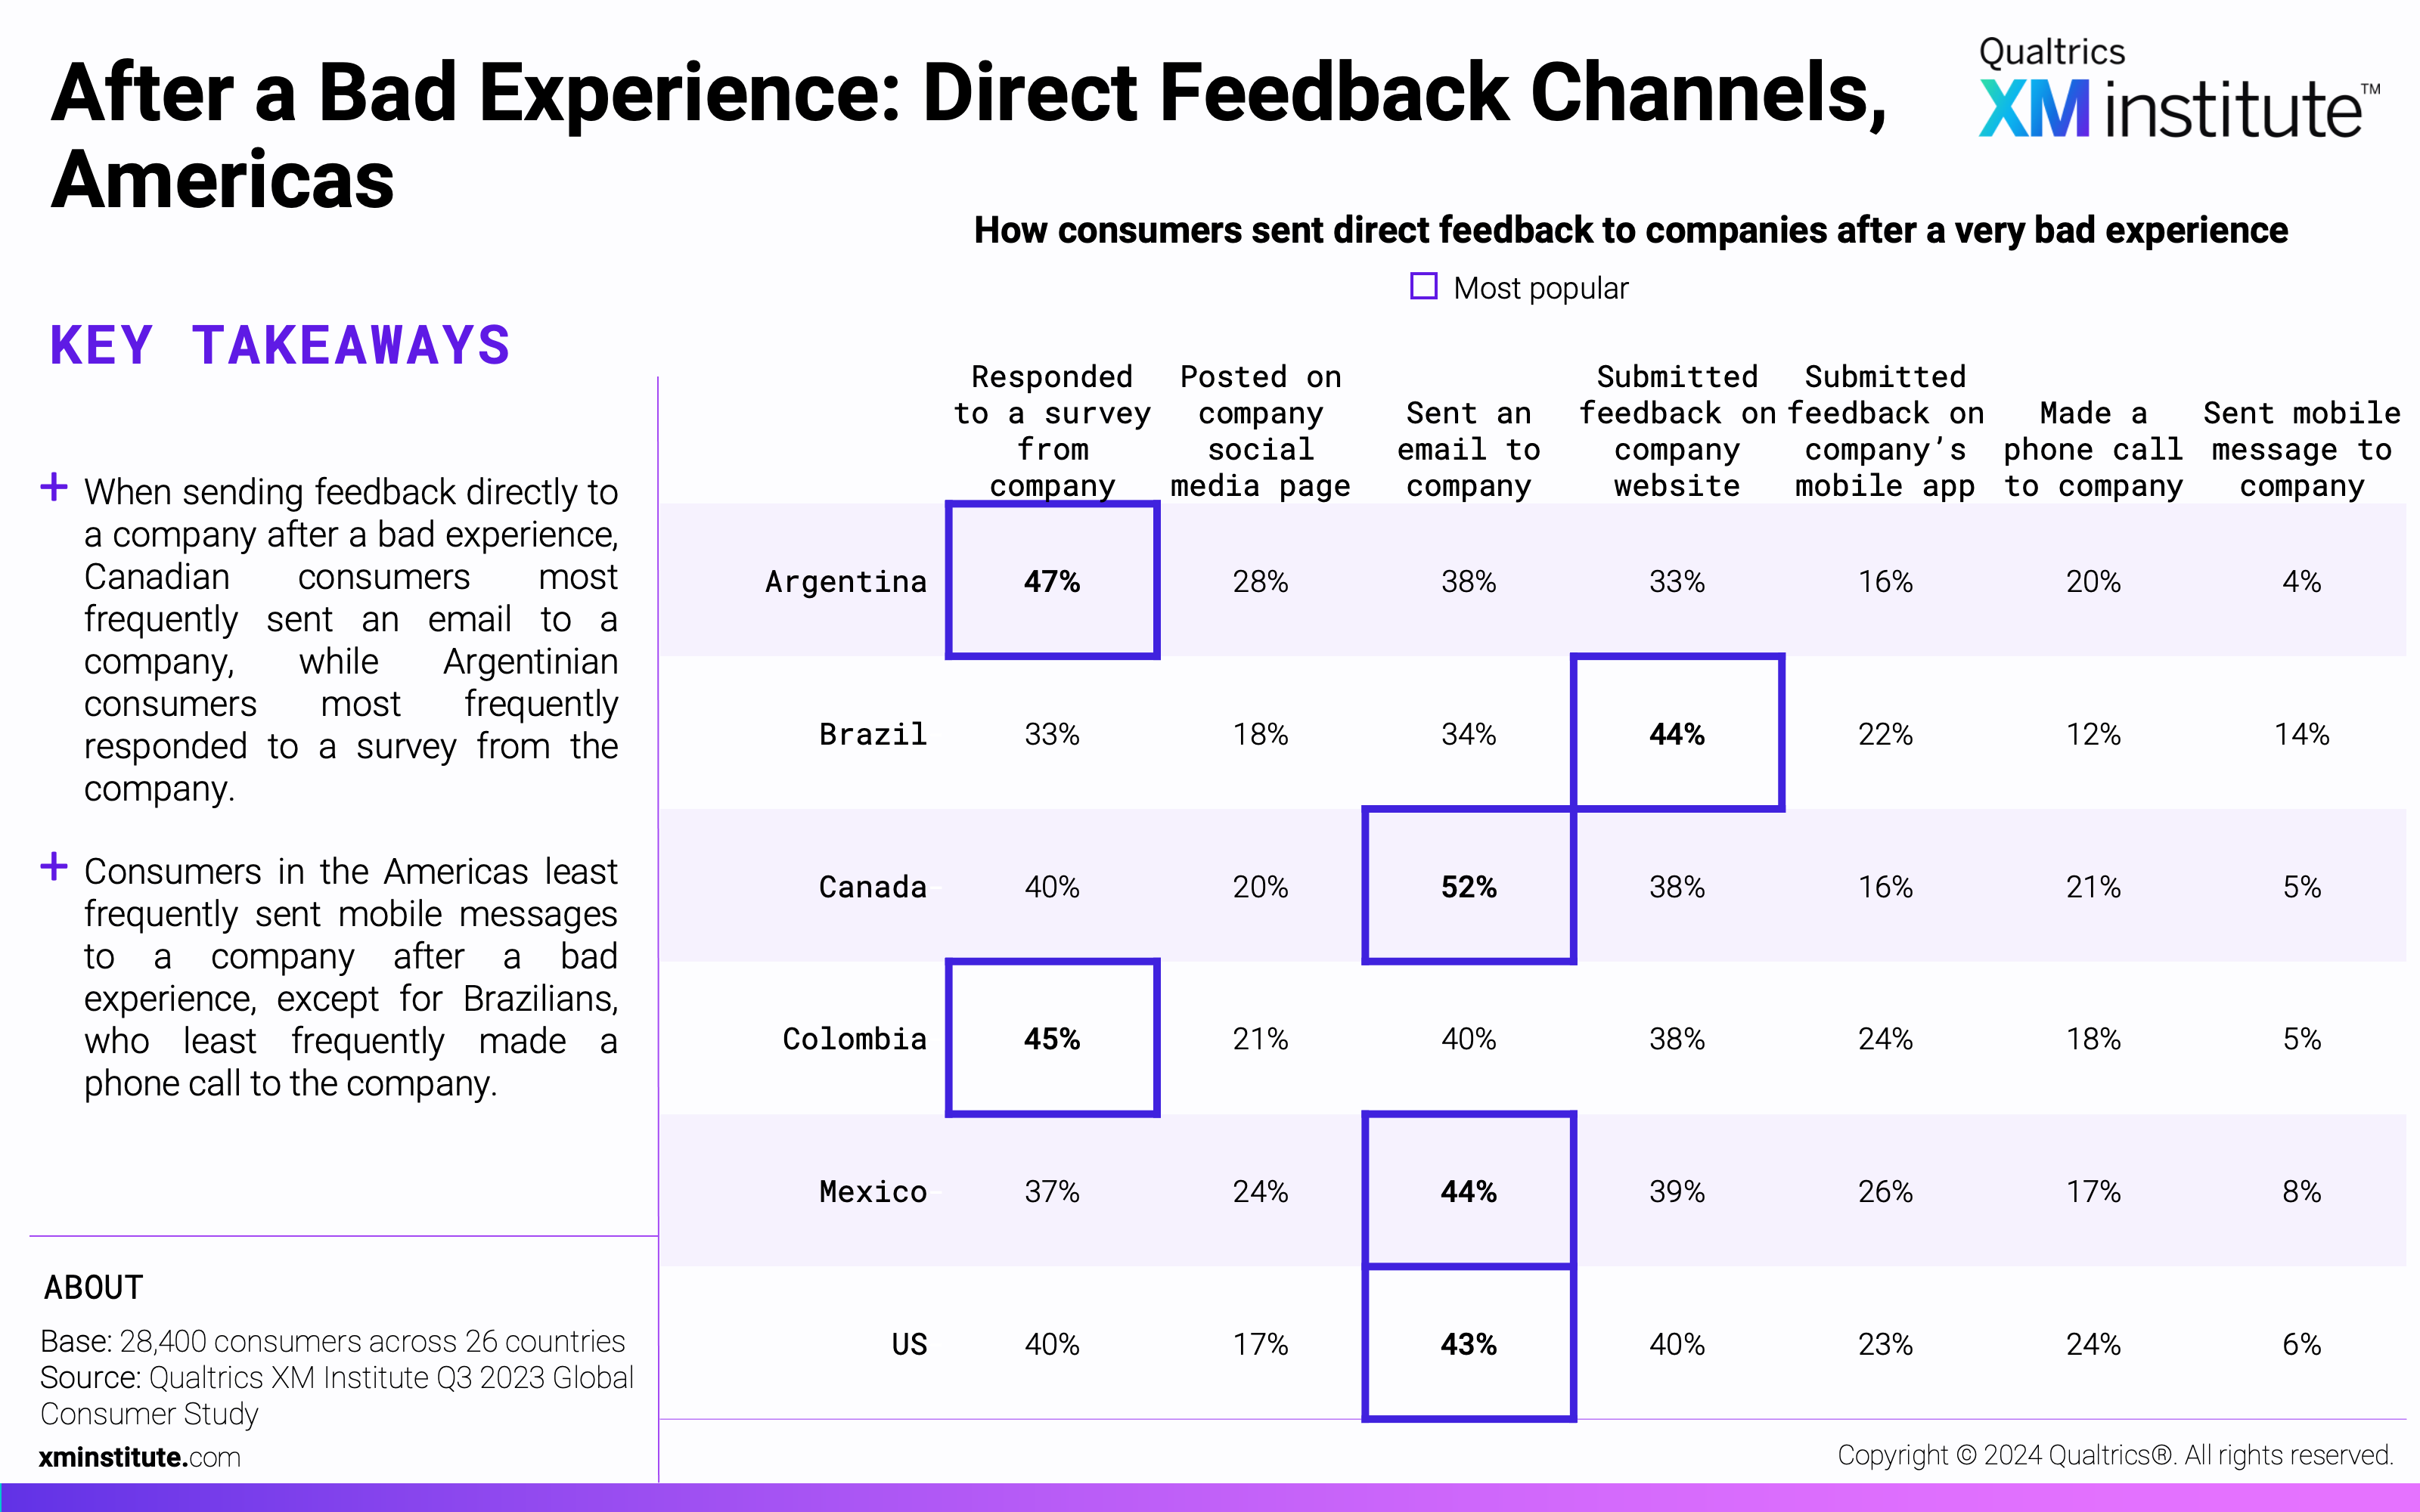
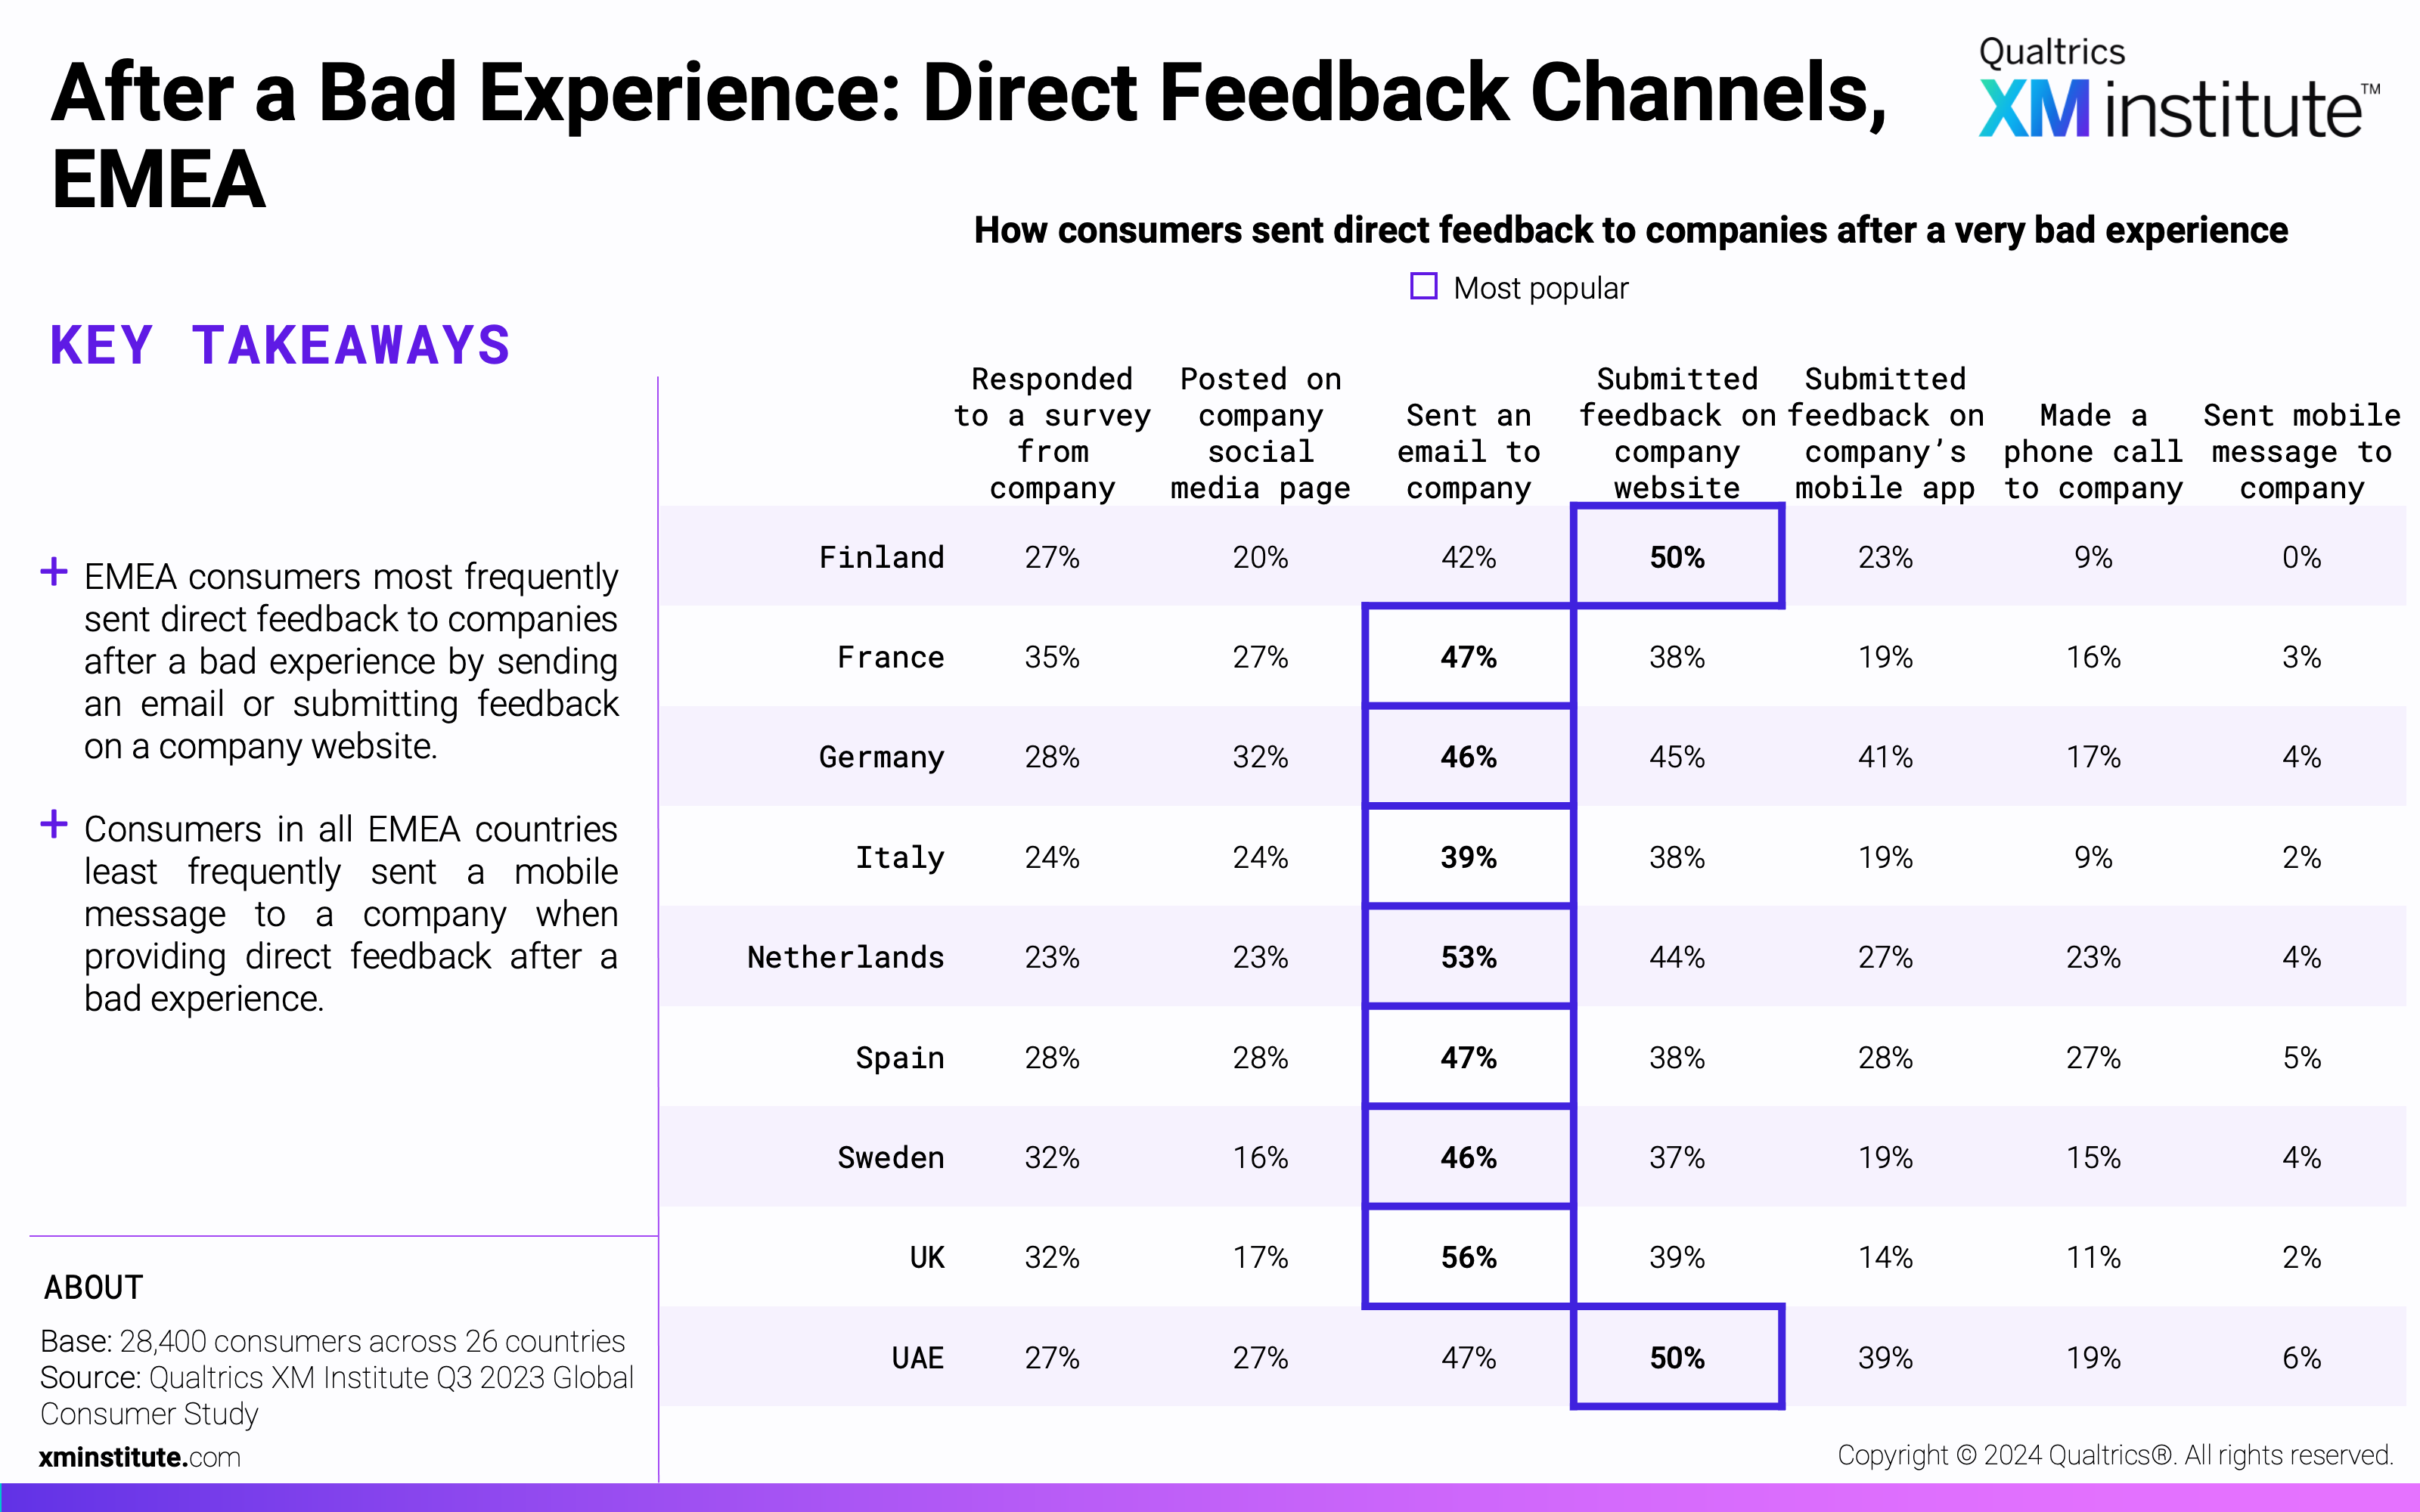
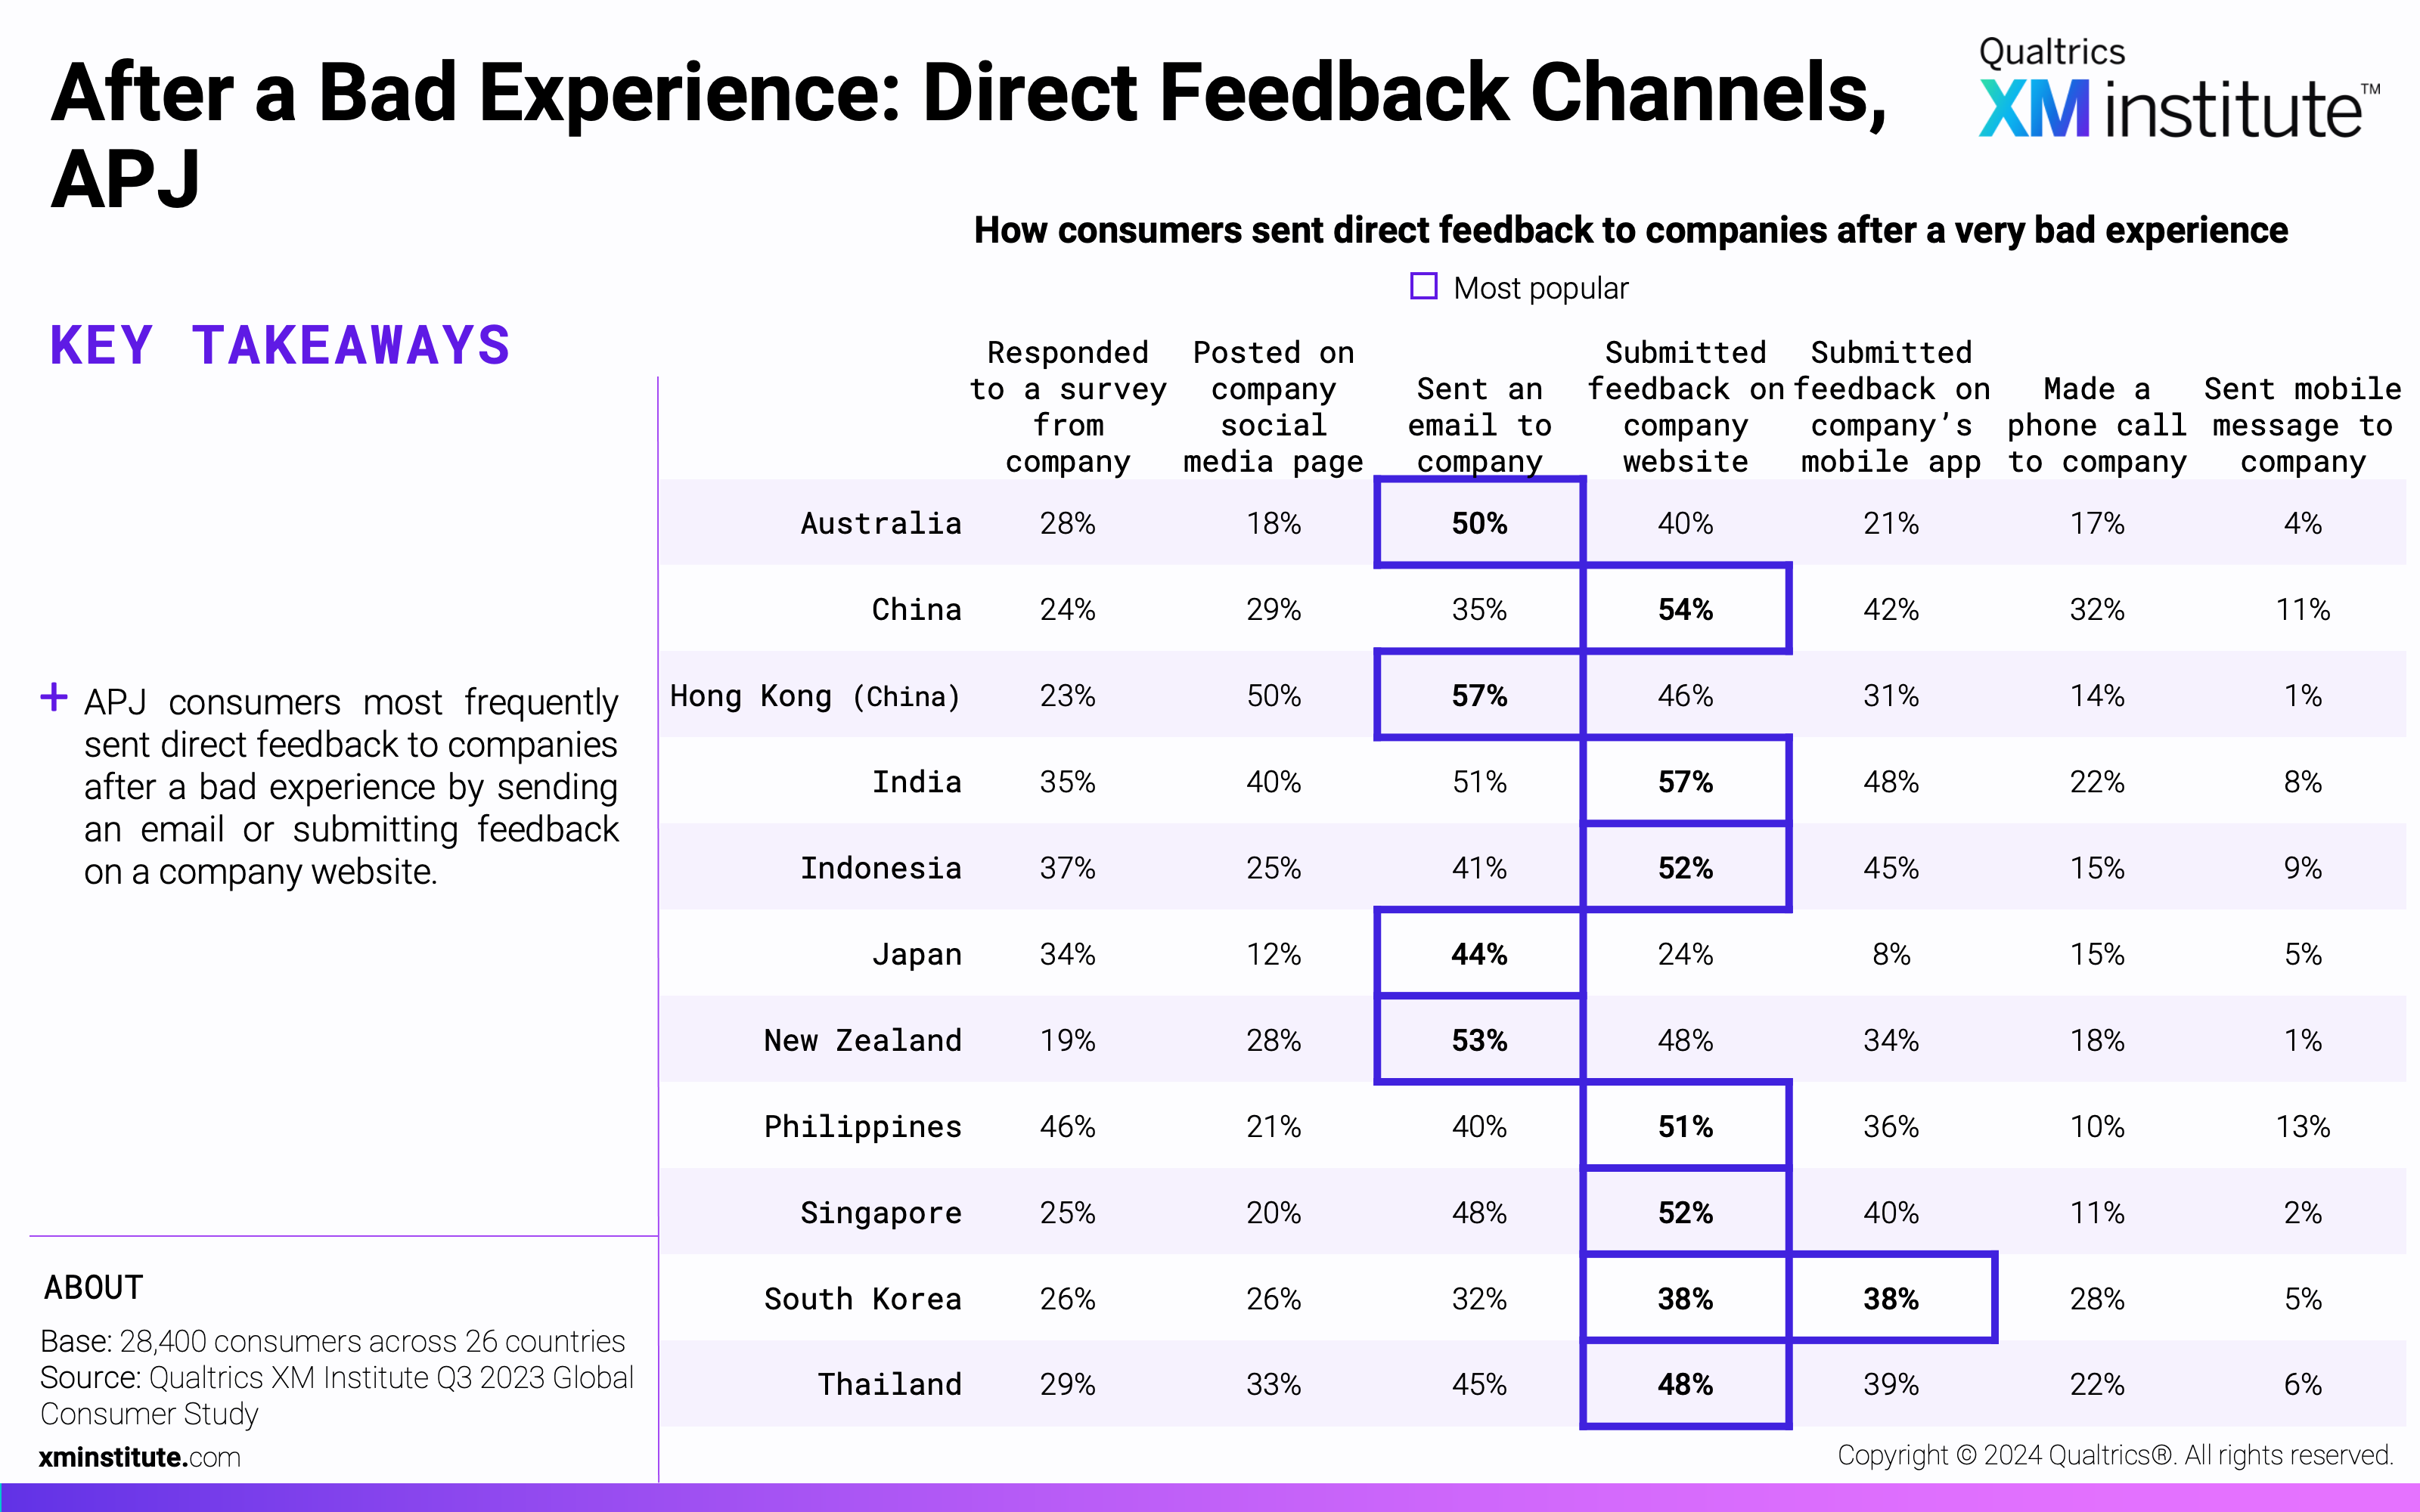
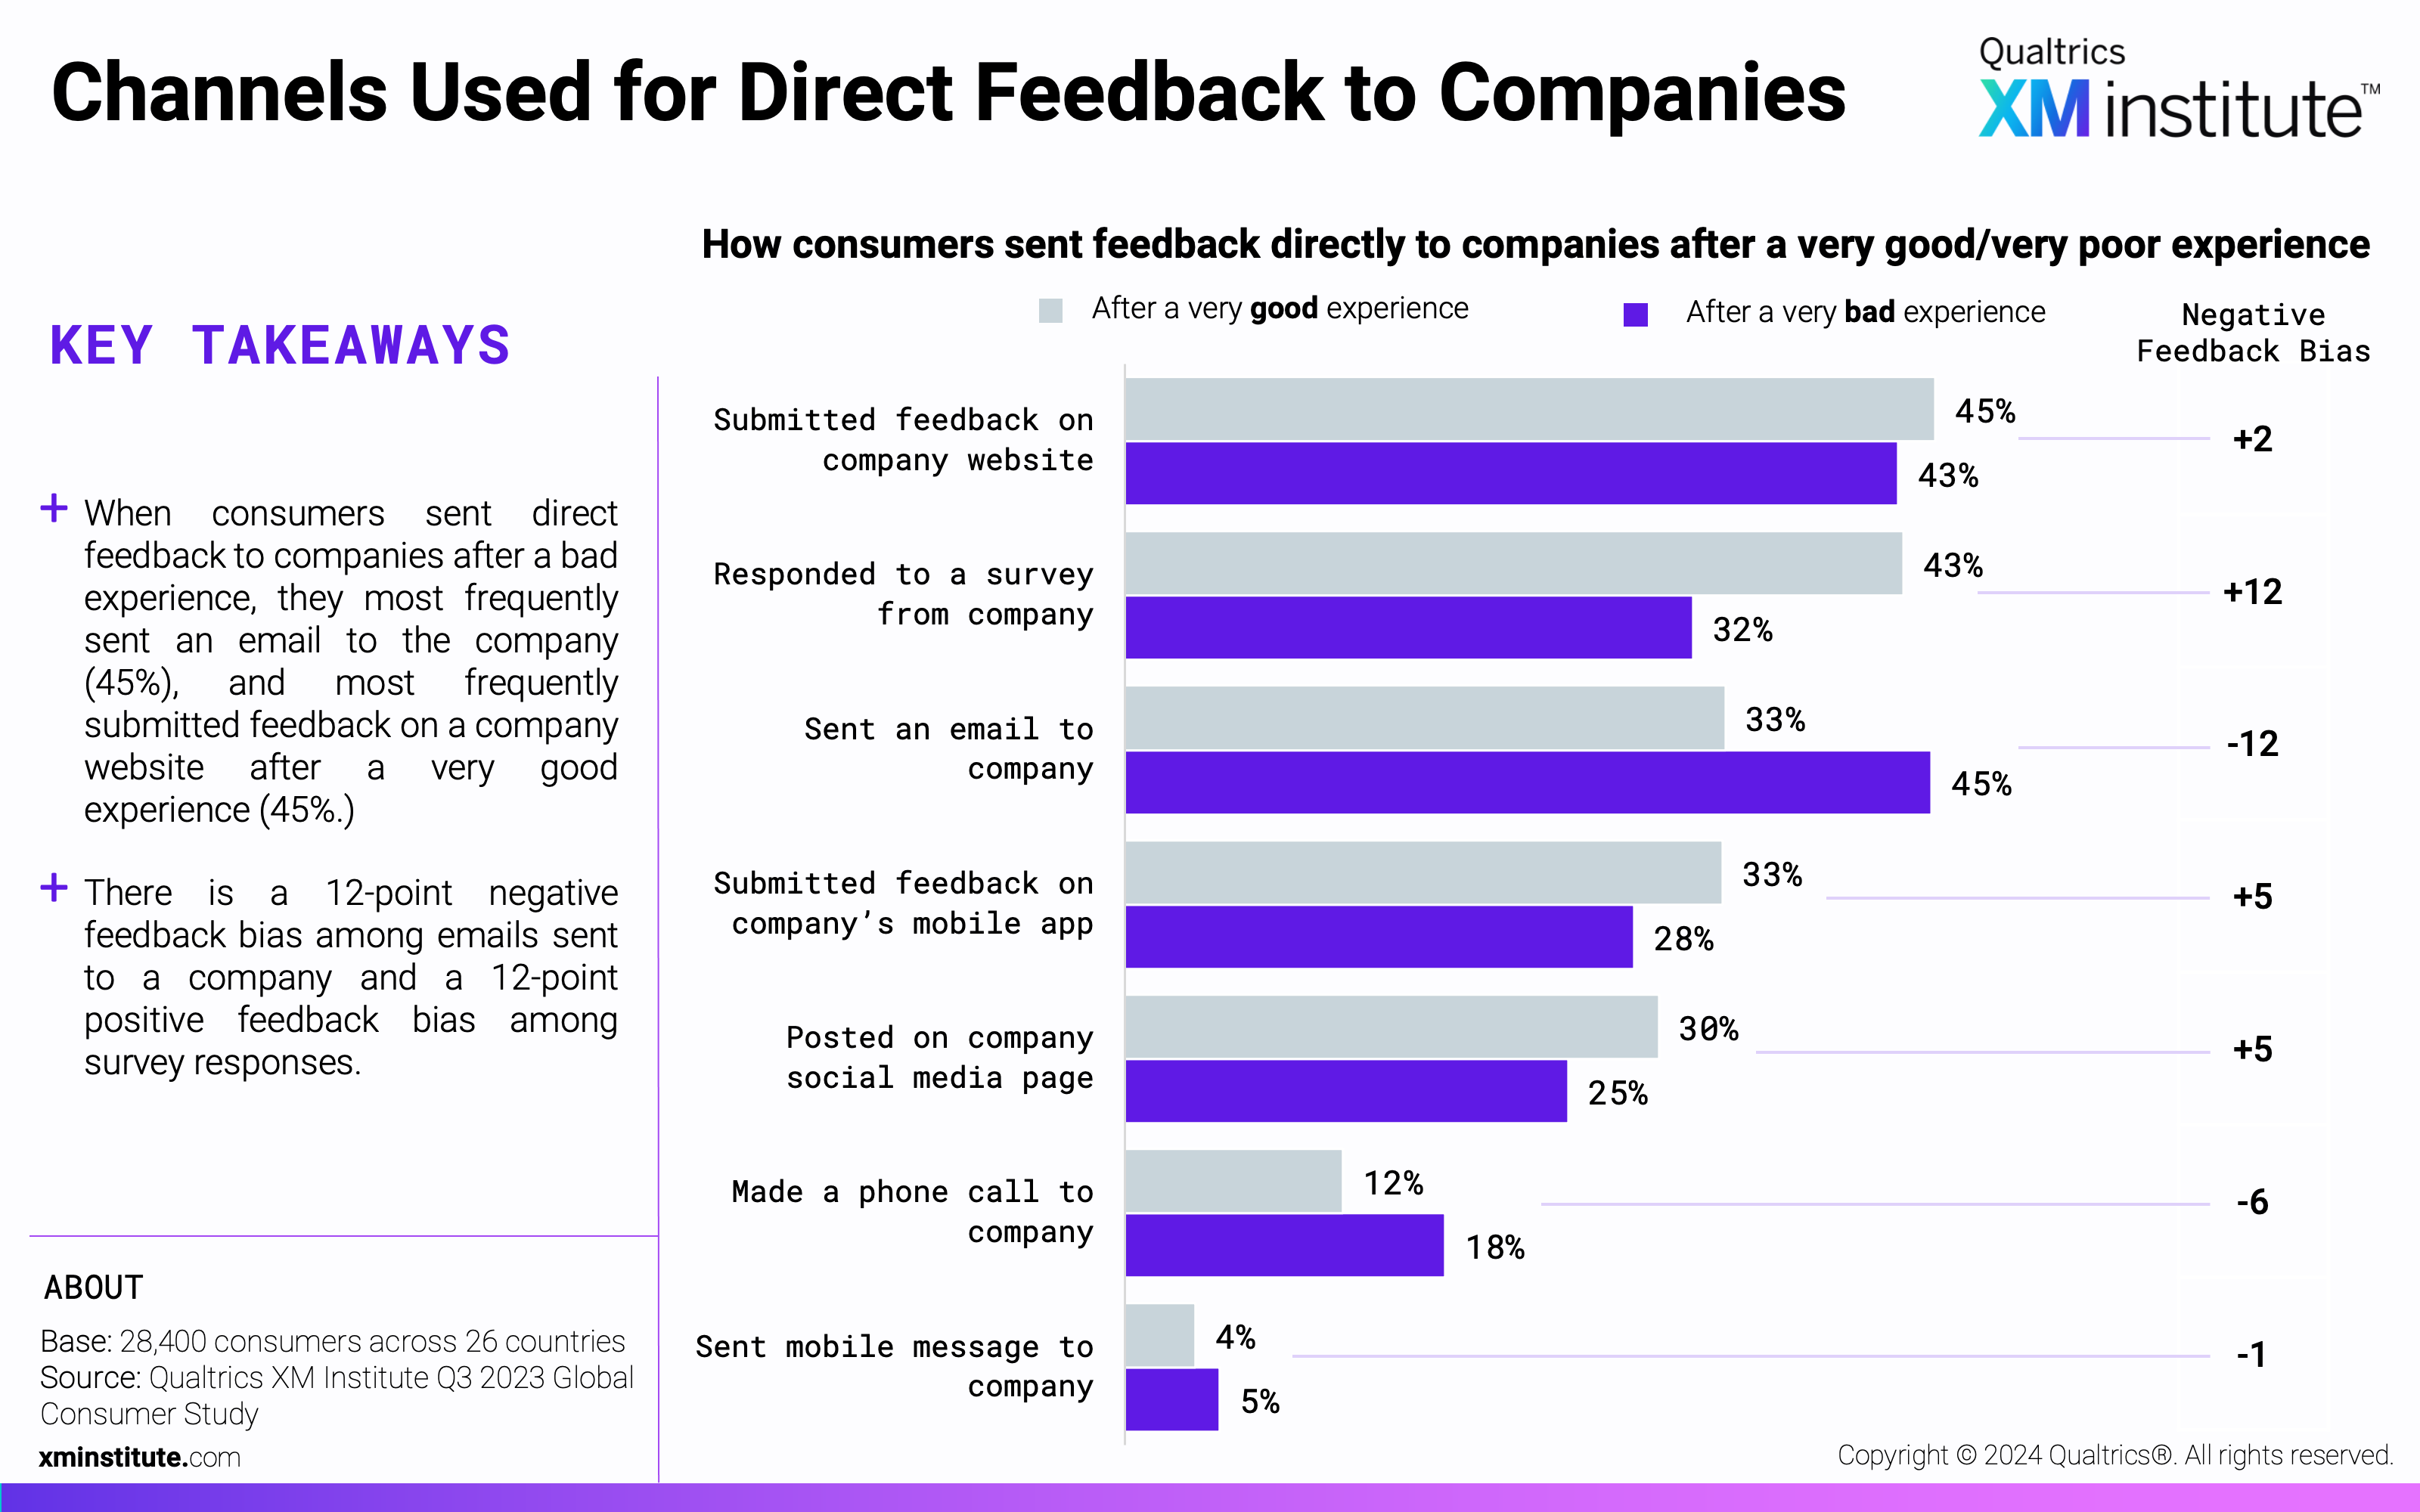
- Consumers share negative feedback through websites and email. Of the consumers who shared feedback directly with a company after a bad experience, they were most likely to do so by sending an email to the company (45%) followed by submitting feedback on the company’s website (43%).
- Website surveys skew positive, while emails skew negative. Consumers are 12 percentage points more likely to submit a survey on the company’s website after having a very good experience than they are after a very bad one. Conversely, if they have a bad experience, they are 12 percentage points more likely to send the company an email than after a good experience.
Figures
Here are the figures in this Data Snapshot:
- Feedback After a Good Experience
- Feedback After a Bad Experience
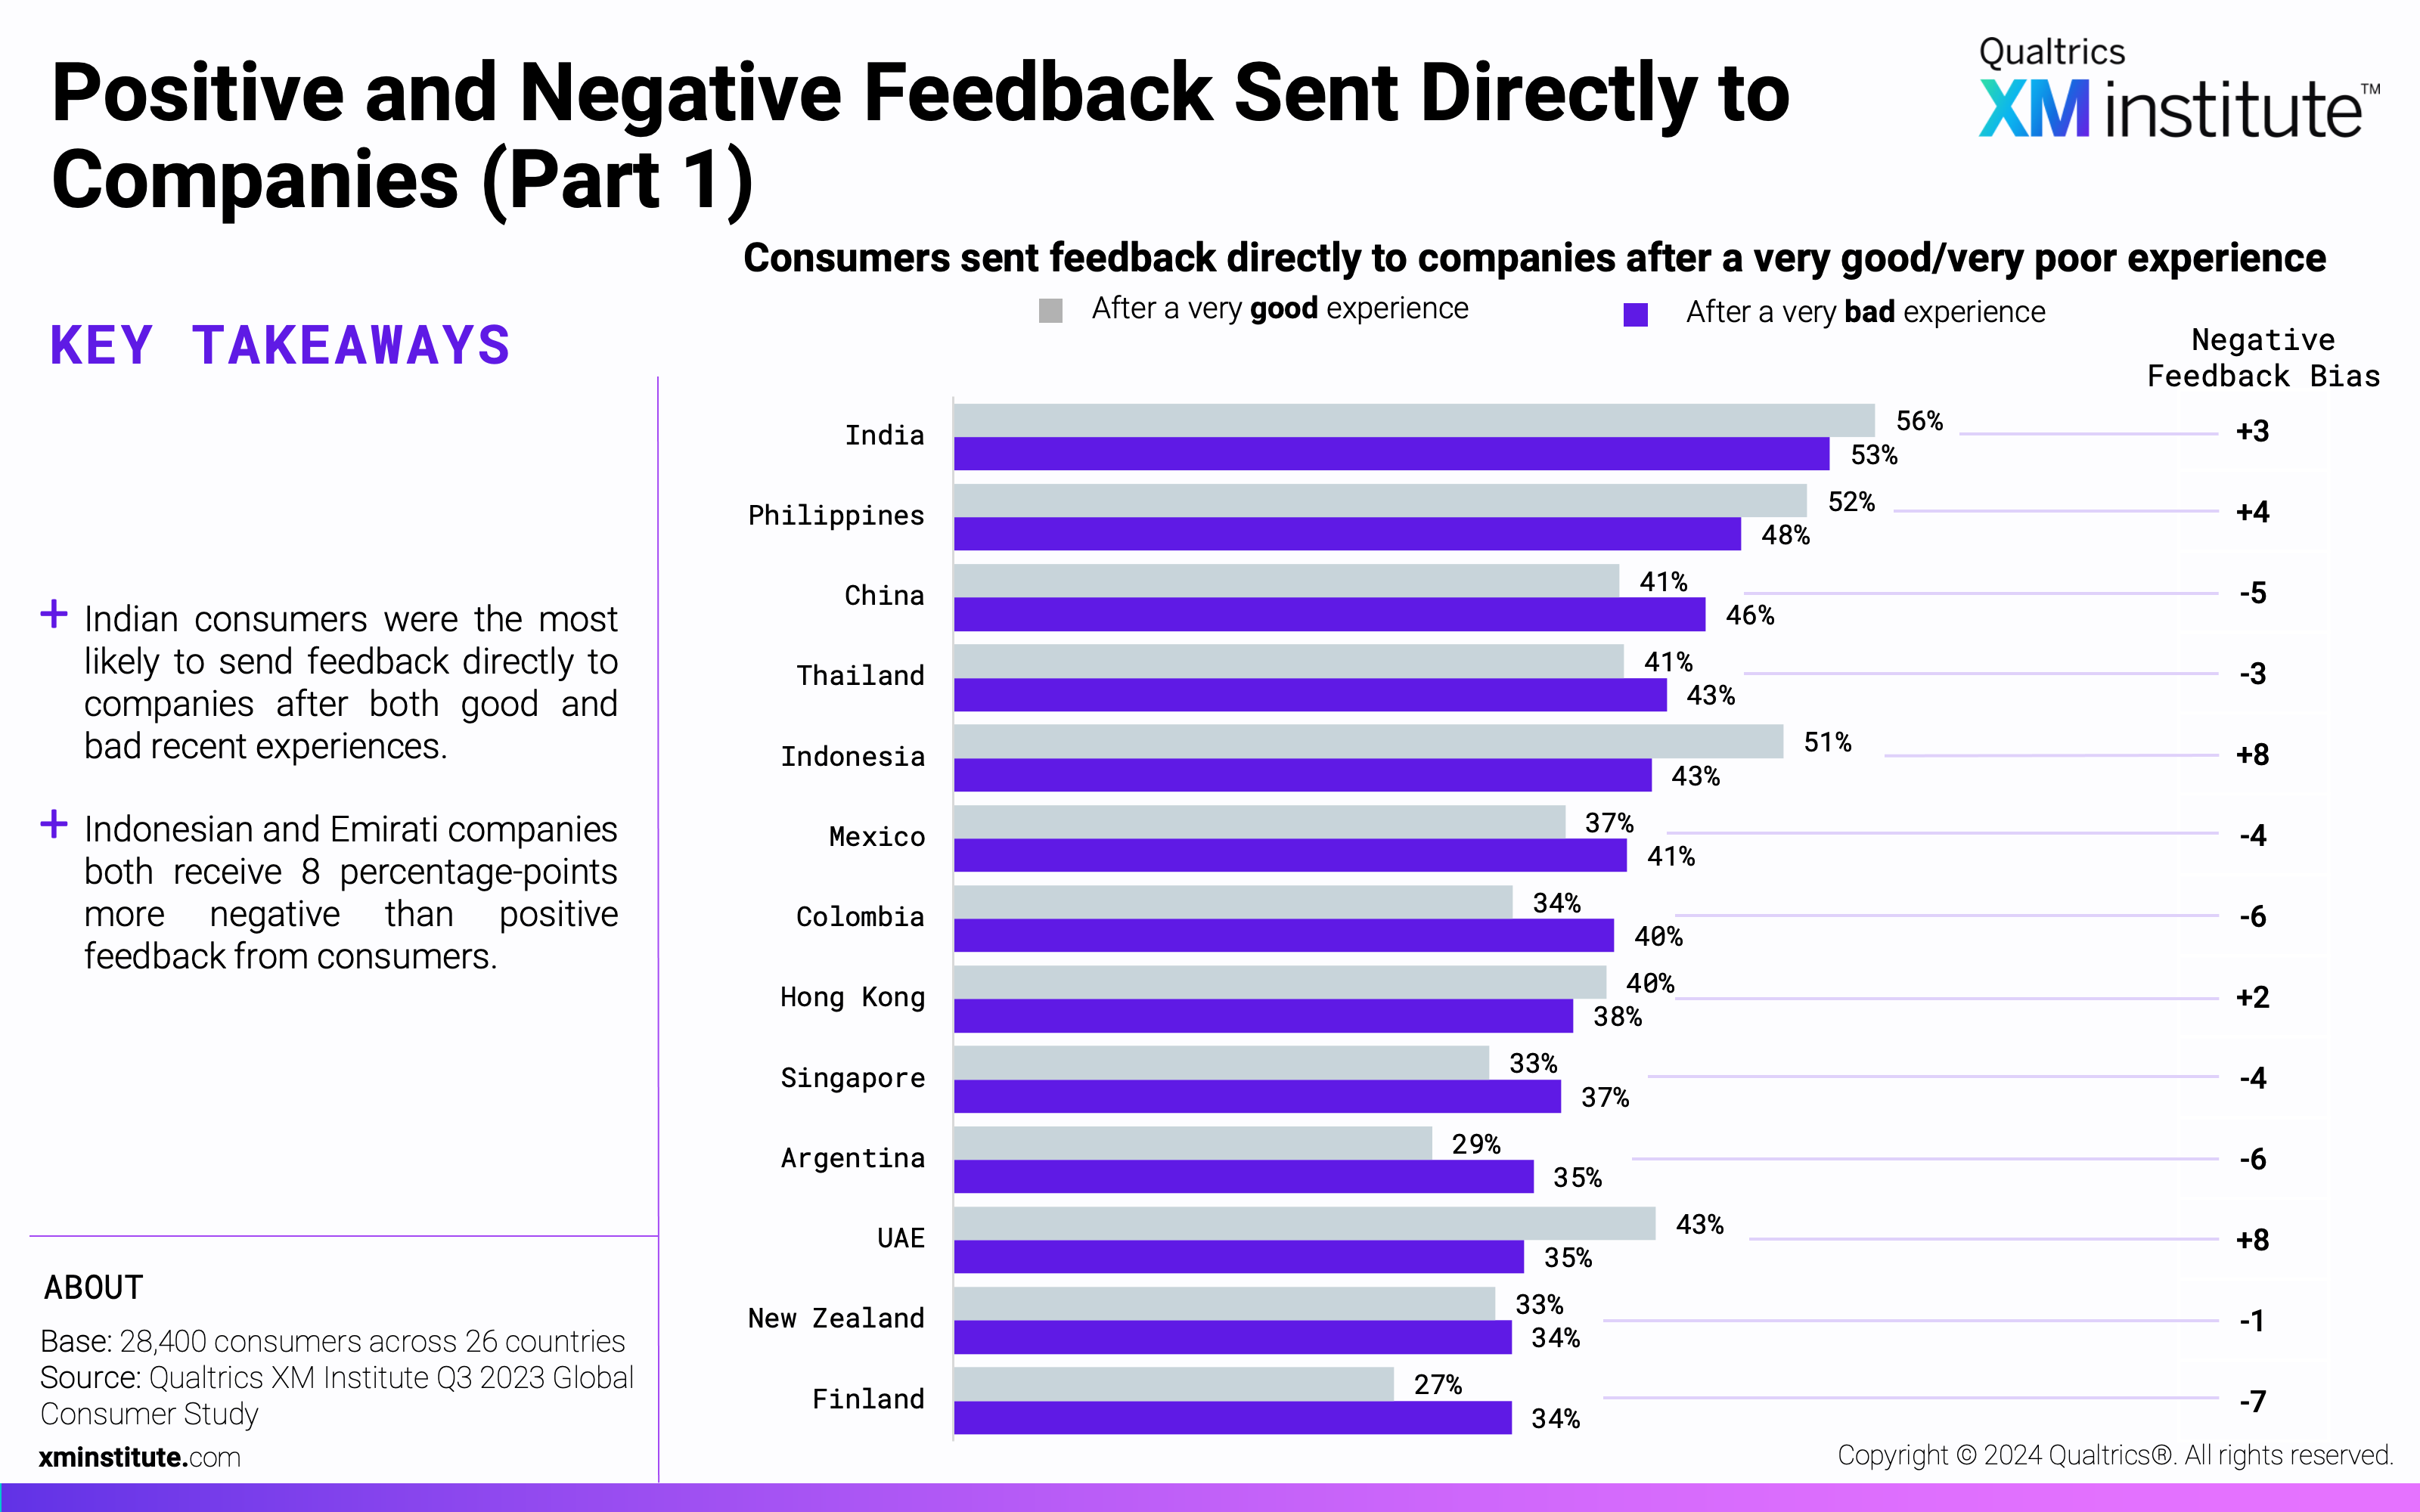
- Positive and Negative Feedback Sent Directly to Companies (Part 1)
- Positive and Negative Feedback Sent Directly to Companies (Part 2)
- Feedback After Good Experiences: Americas
- Feedback After Good Experiences: EMEA
- Feedback After Good Experiences: APJ
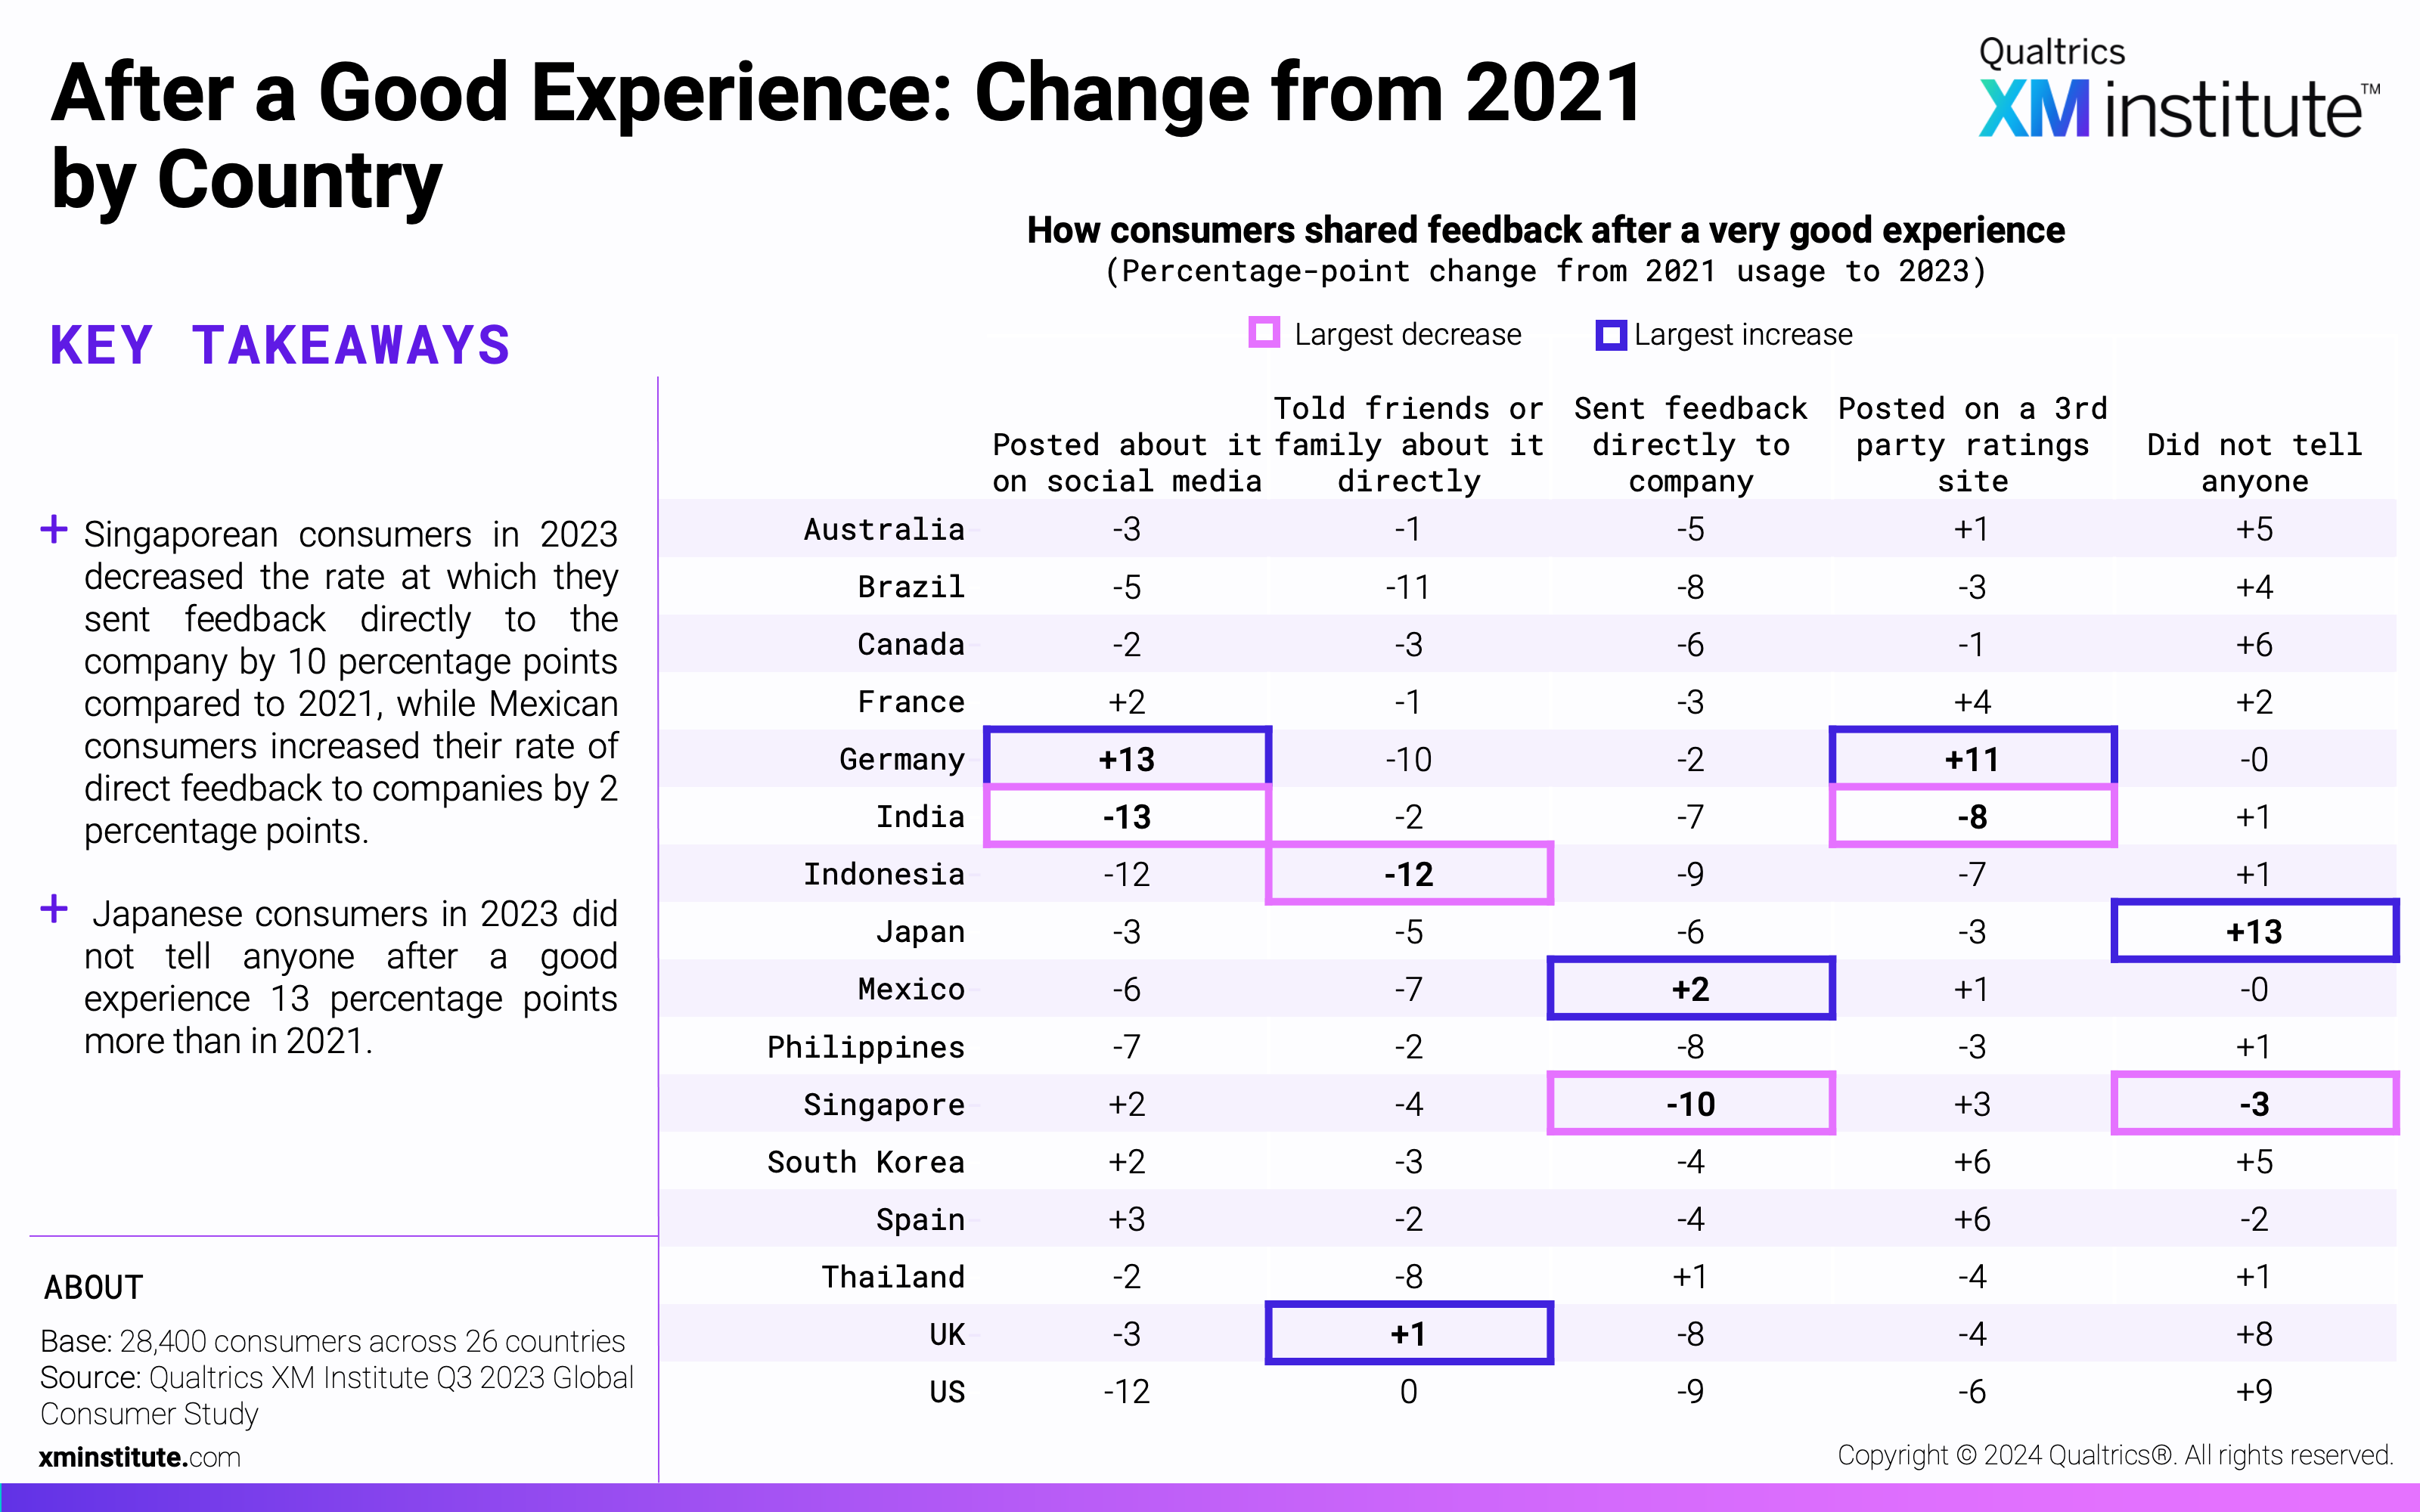
- After a Good Experience: Change from 2021
- After a Good Experience: Change from 2021 by Country
- After a Good Experience: Direct Feedback Channels, Americas
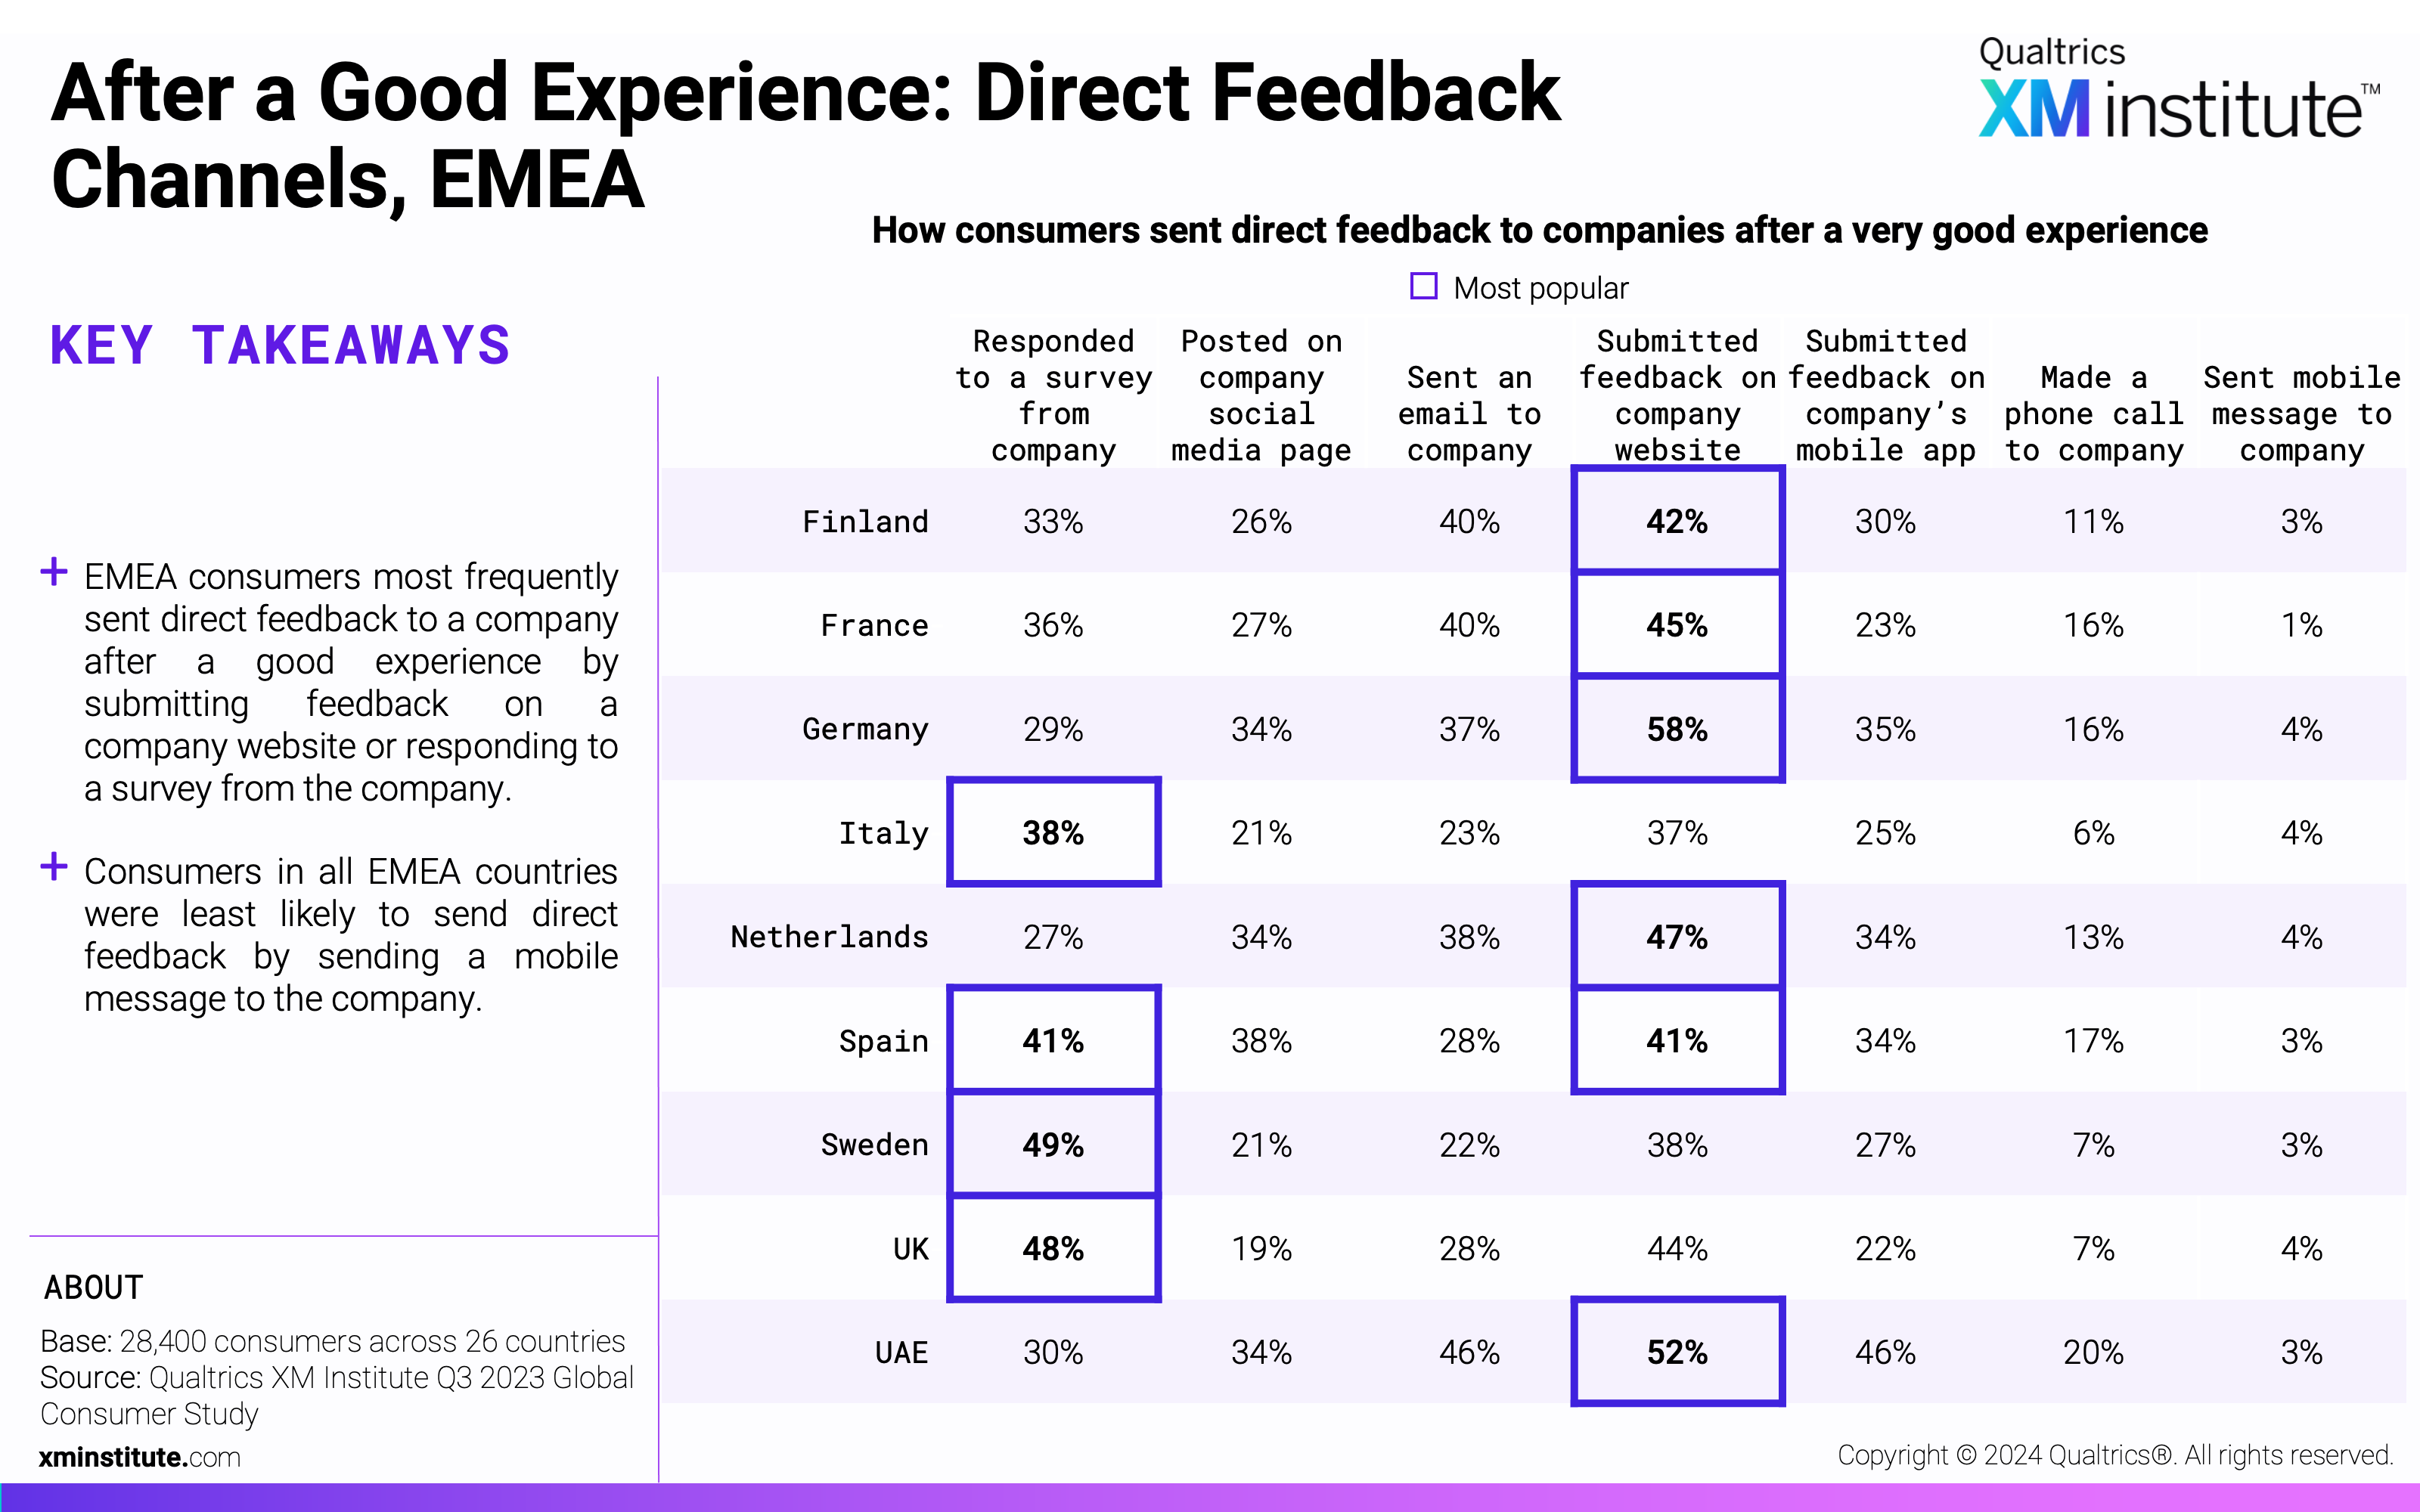
- After a Good Experience: Direct Feedback Channels, EMEA
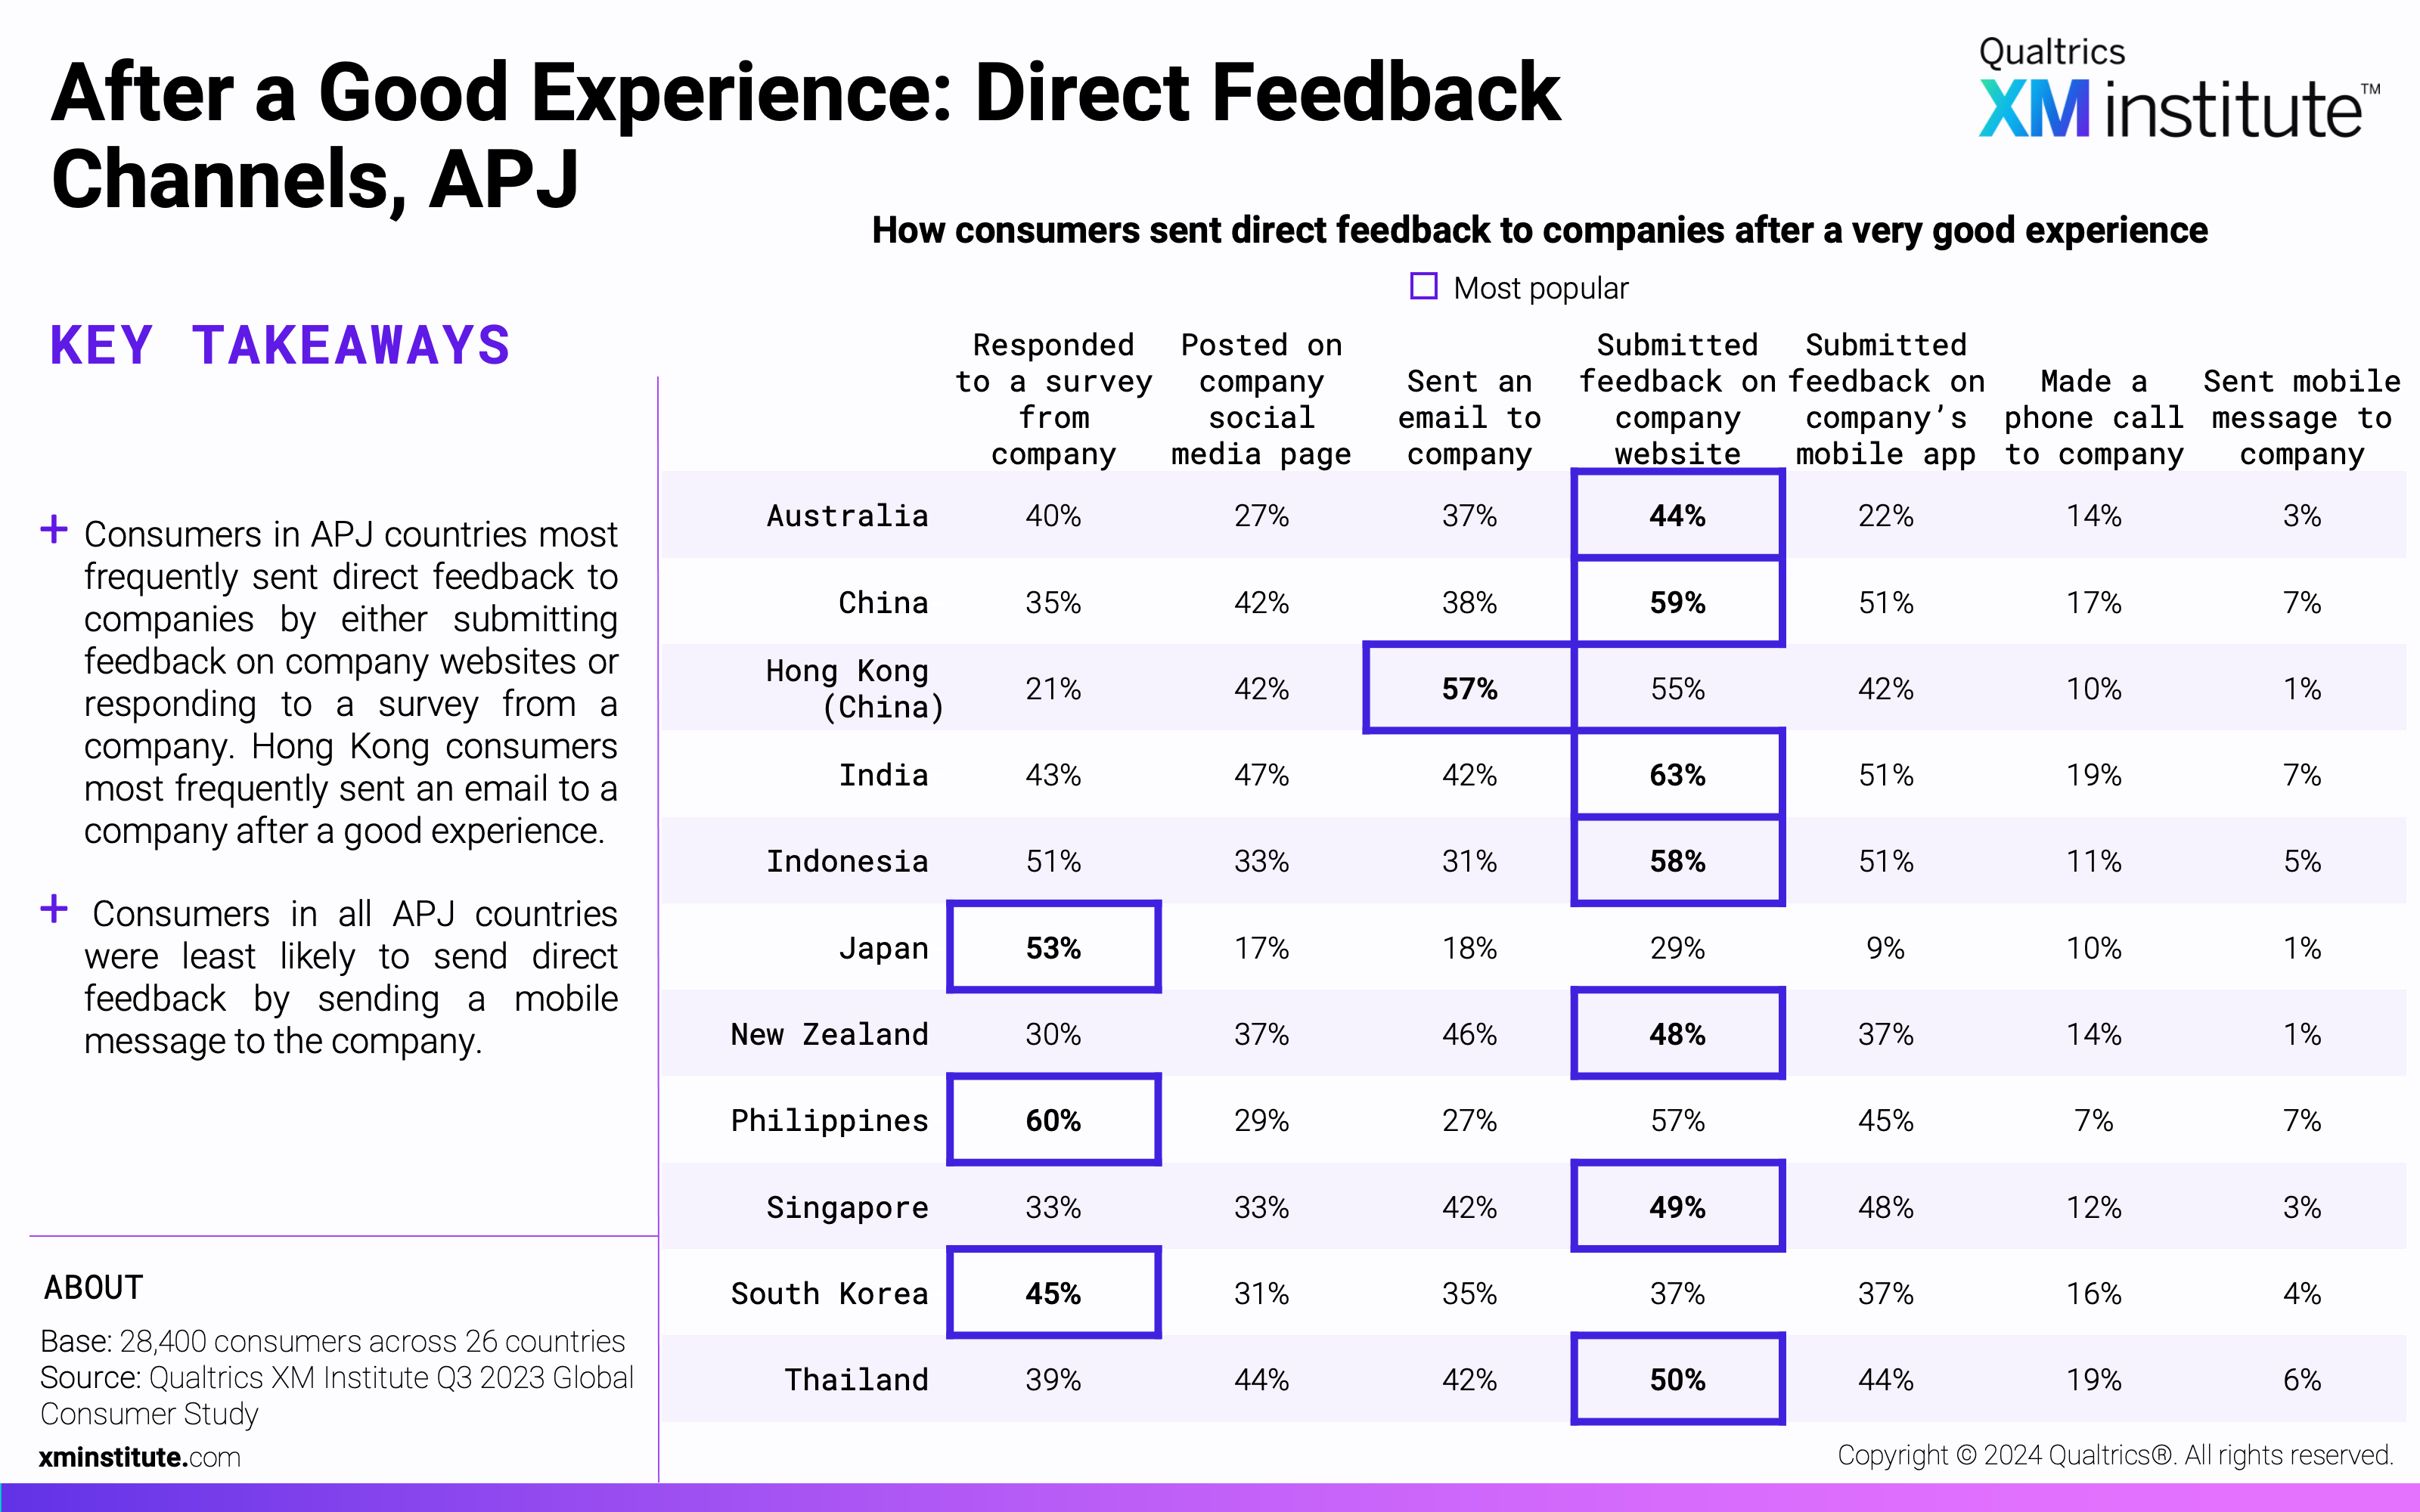
- After a Good Experience: Direct Feedback Channels, APJ
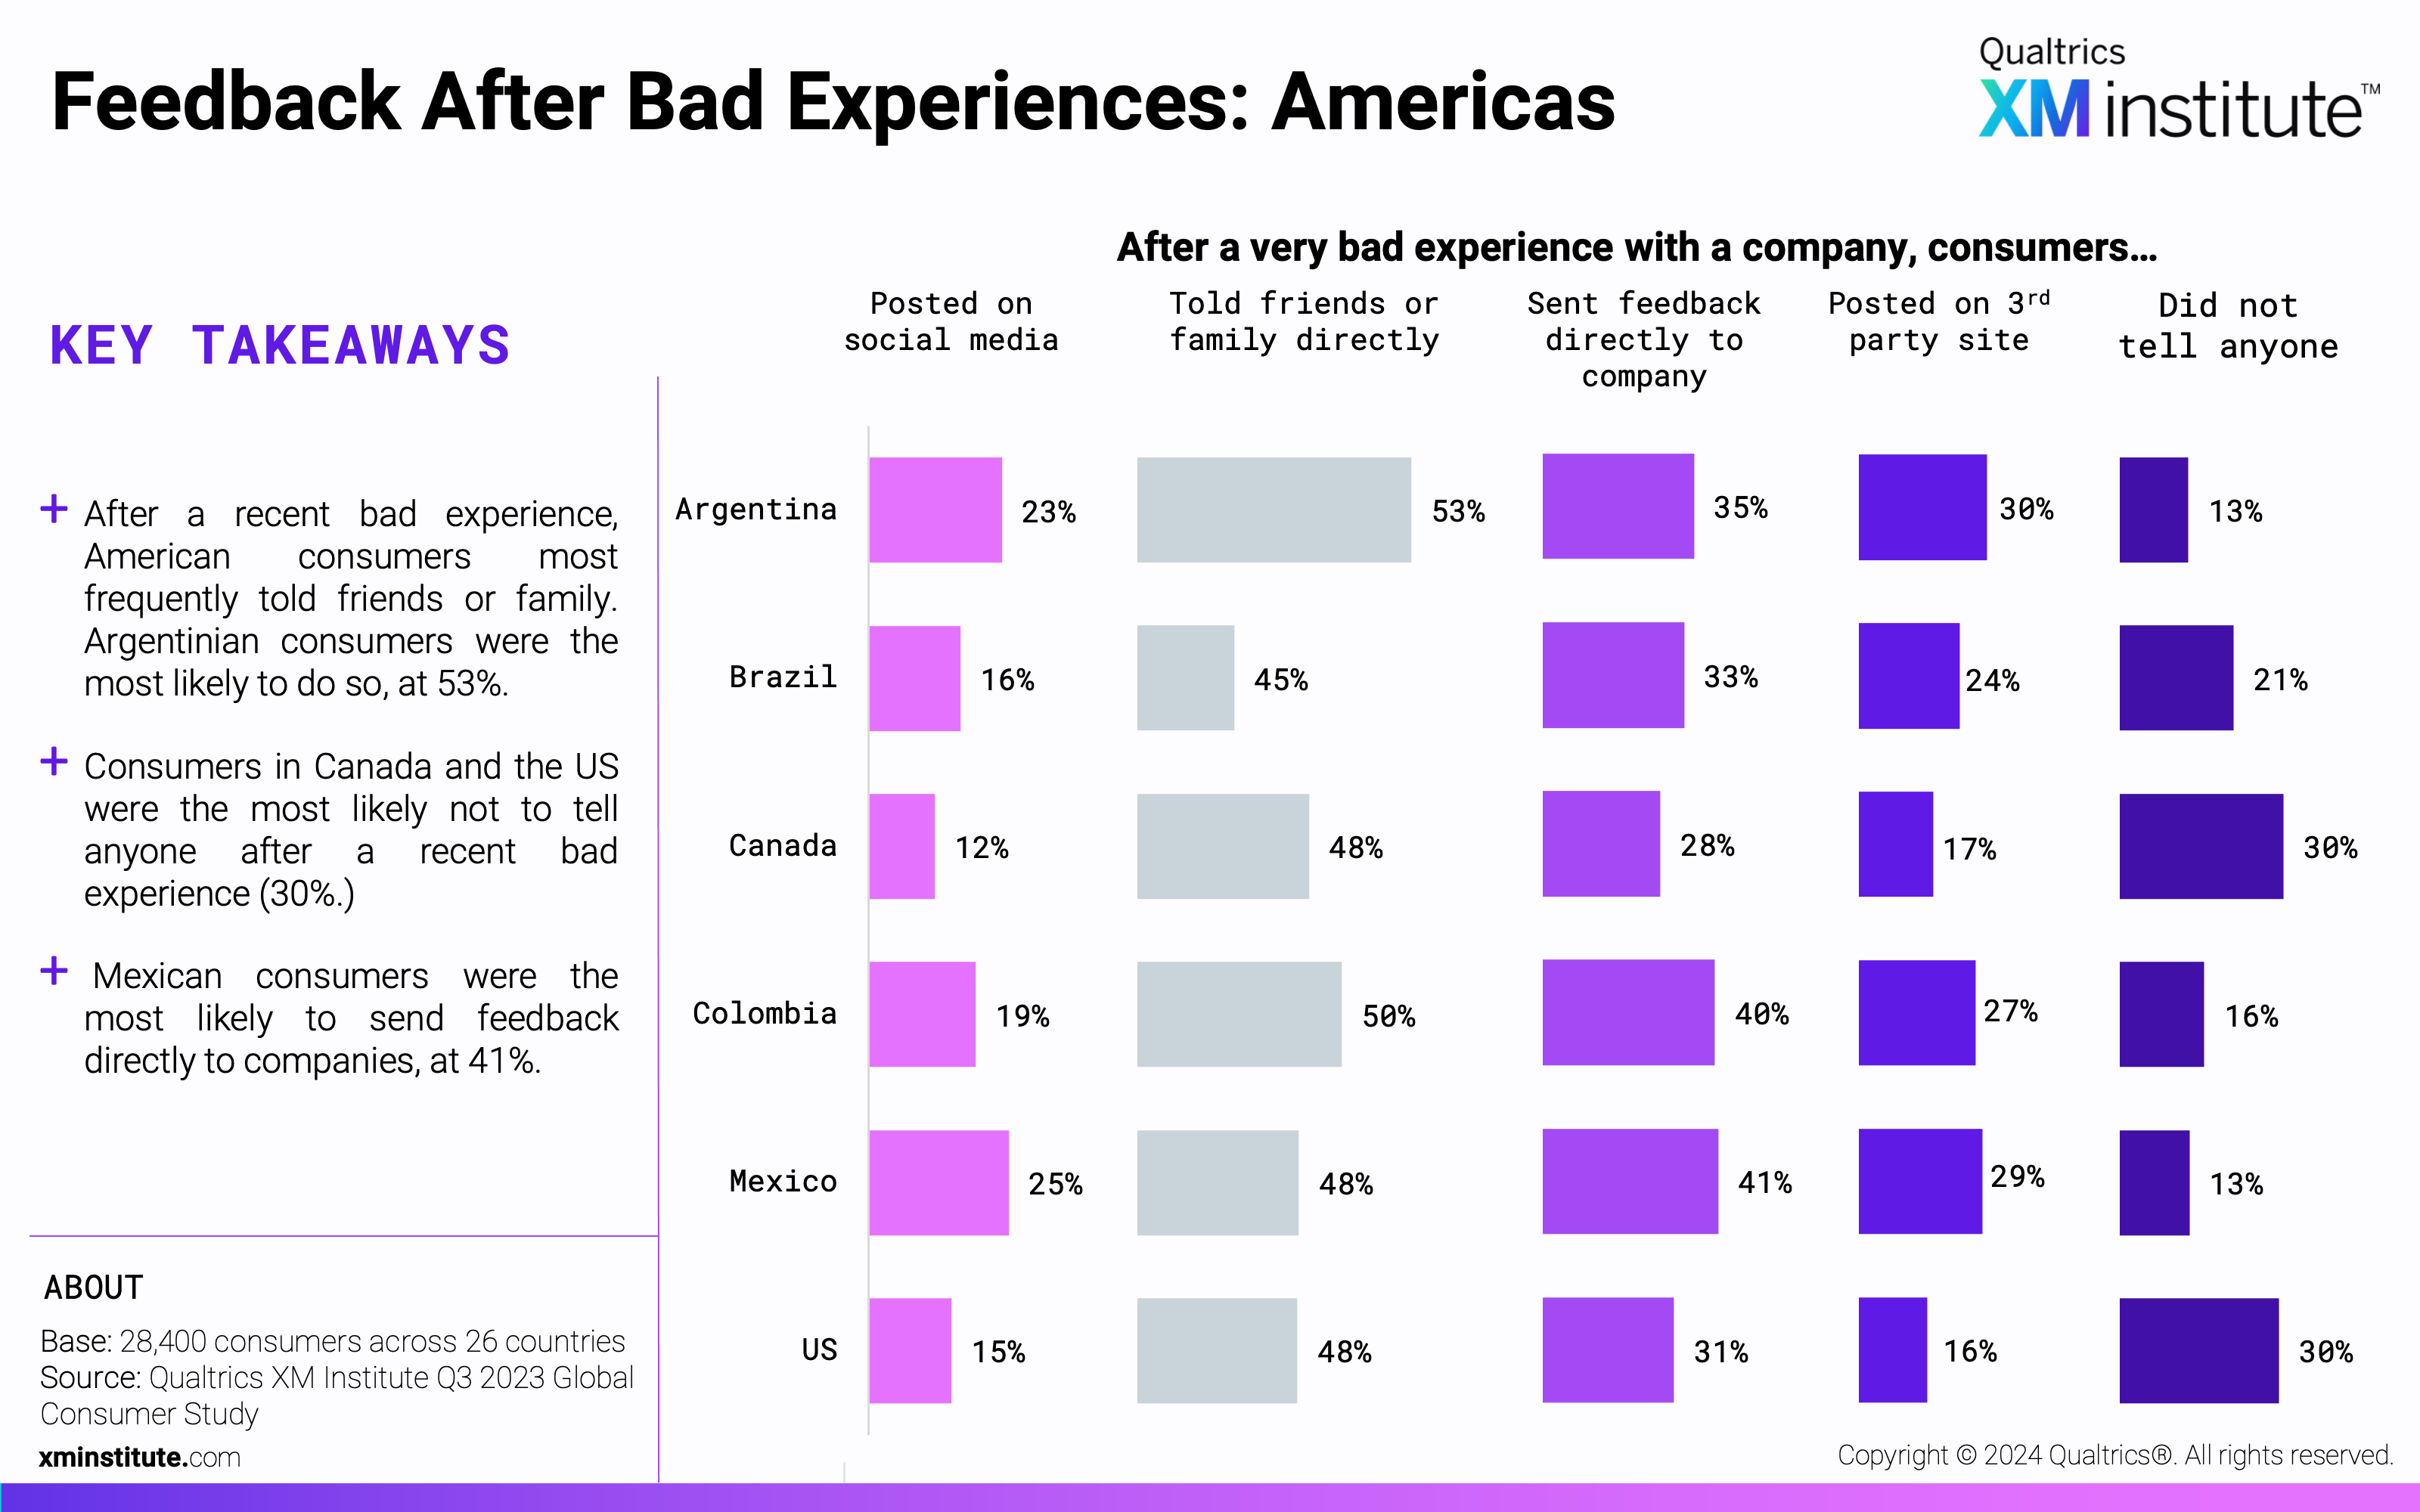
- Feedback After Bad Experiences: Americas
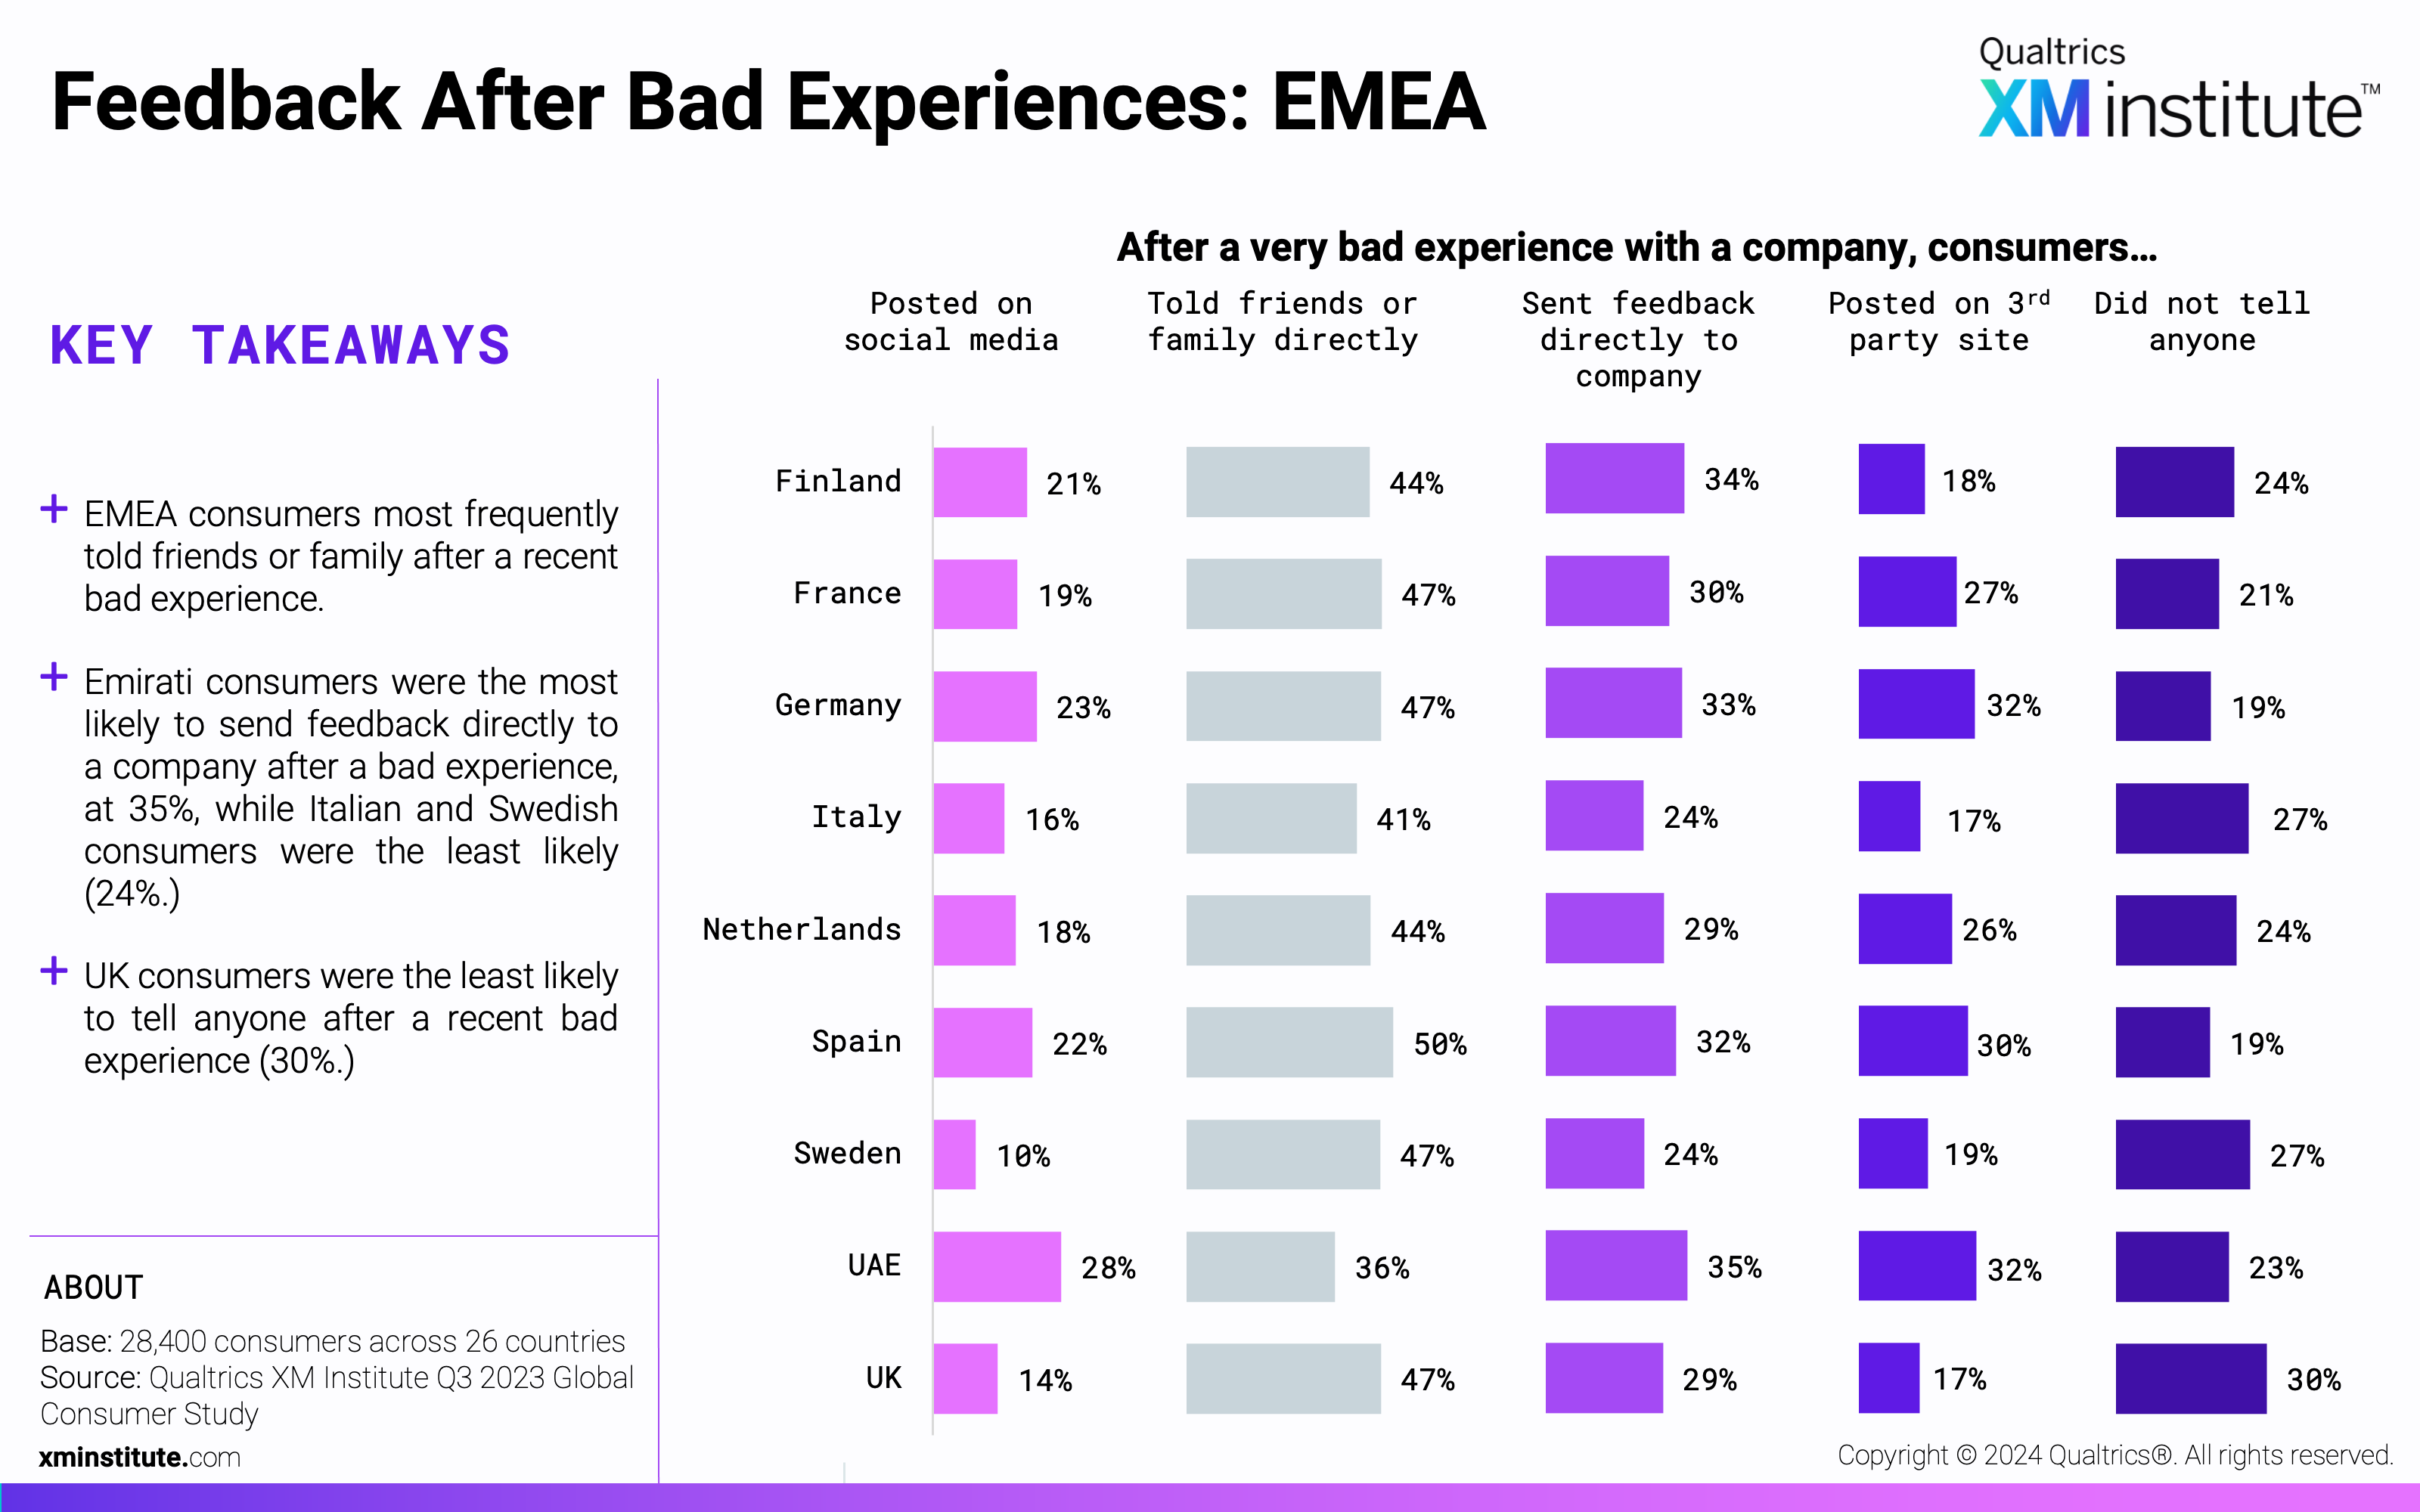
- Feedback After Bad Experiences: EMEA
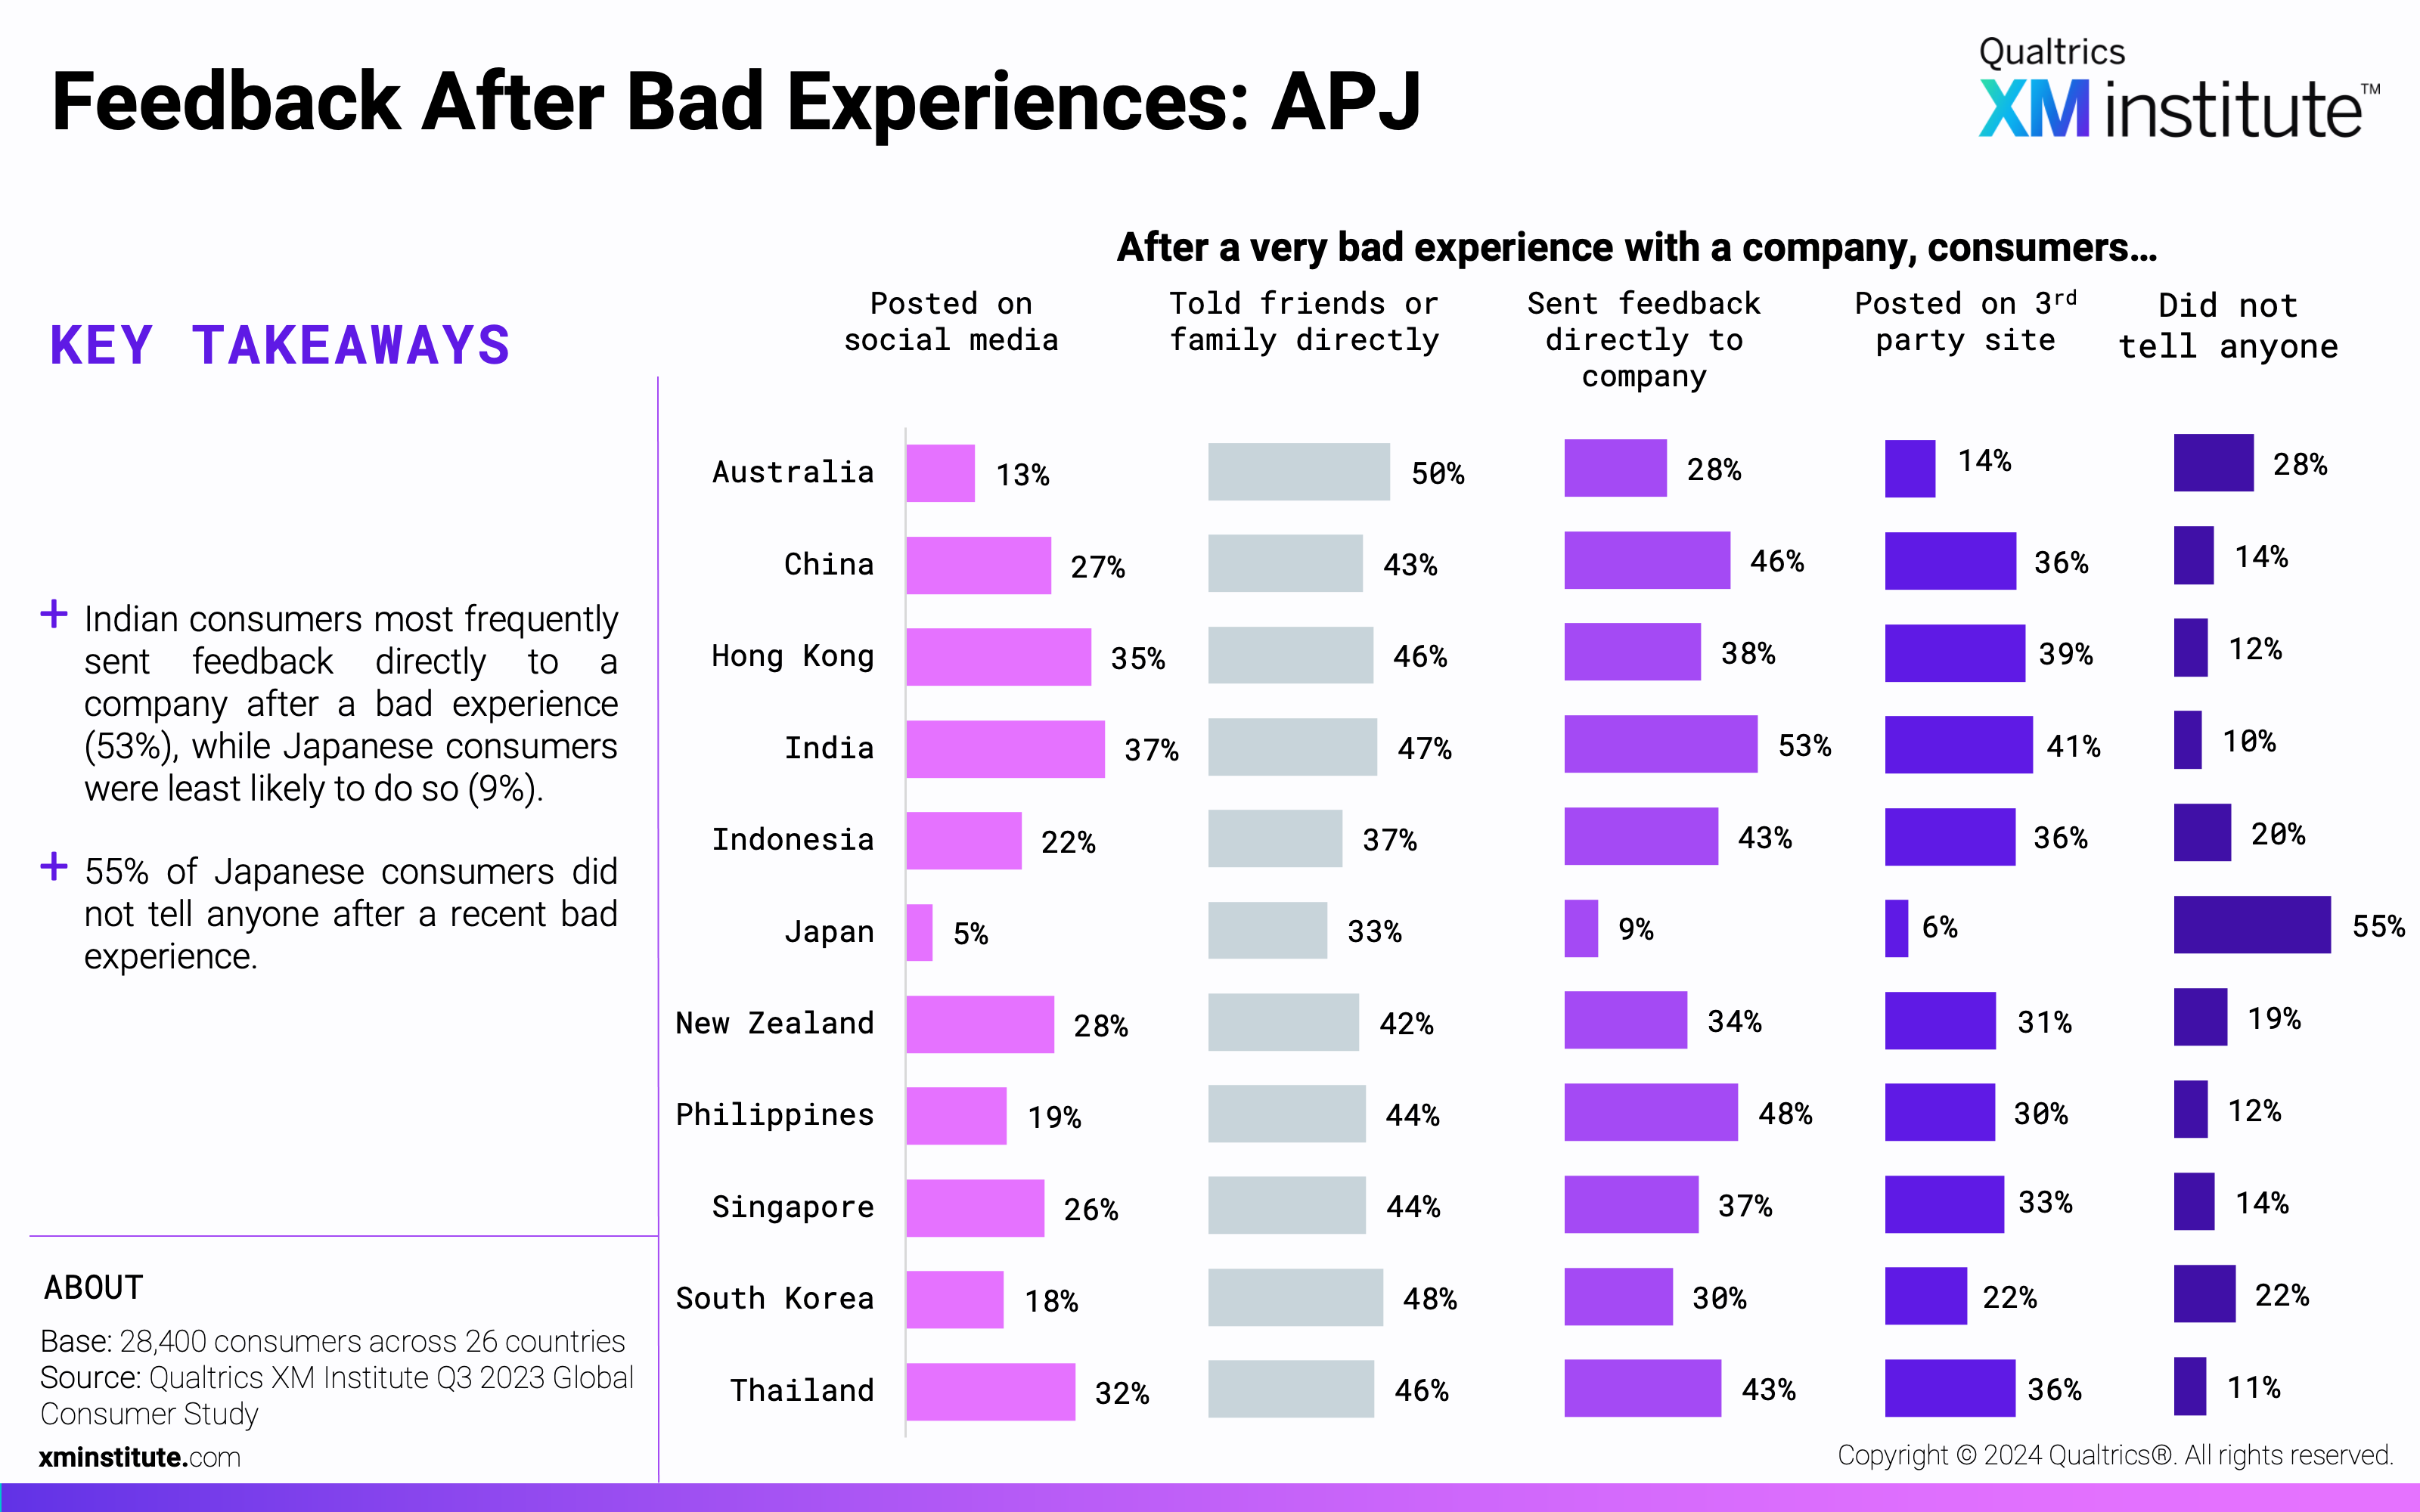
- Feedback After Bad Experiences: APJ
- After a Bad Experience: Change from 2021
- After a Bad Experience: Change from 2021
- After a Bad Experience: Direct Feedback Channels, Americas
- After a Bad Experience: Direct Feedback Channels, EMEA
- After a Bad Experience, Direct Feedback Channels, APJ
- Channels Used for Direct Feedback to Companies
- Methodology