Key Findings

As part of Qualtrics XM Institute’s 2023 Global Consumer Study, more than 28,000 consumers told us which of six channels (chat with an automated system, self-service on mobile, self-service on computer, chat with a person on computer, talk with someone on the phone, or meet with someone in person) they would prefer to use to complete nine common interactions. From our analysis, we found that:

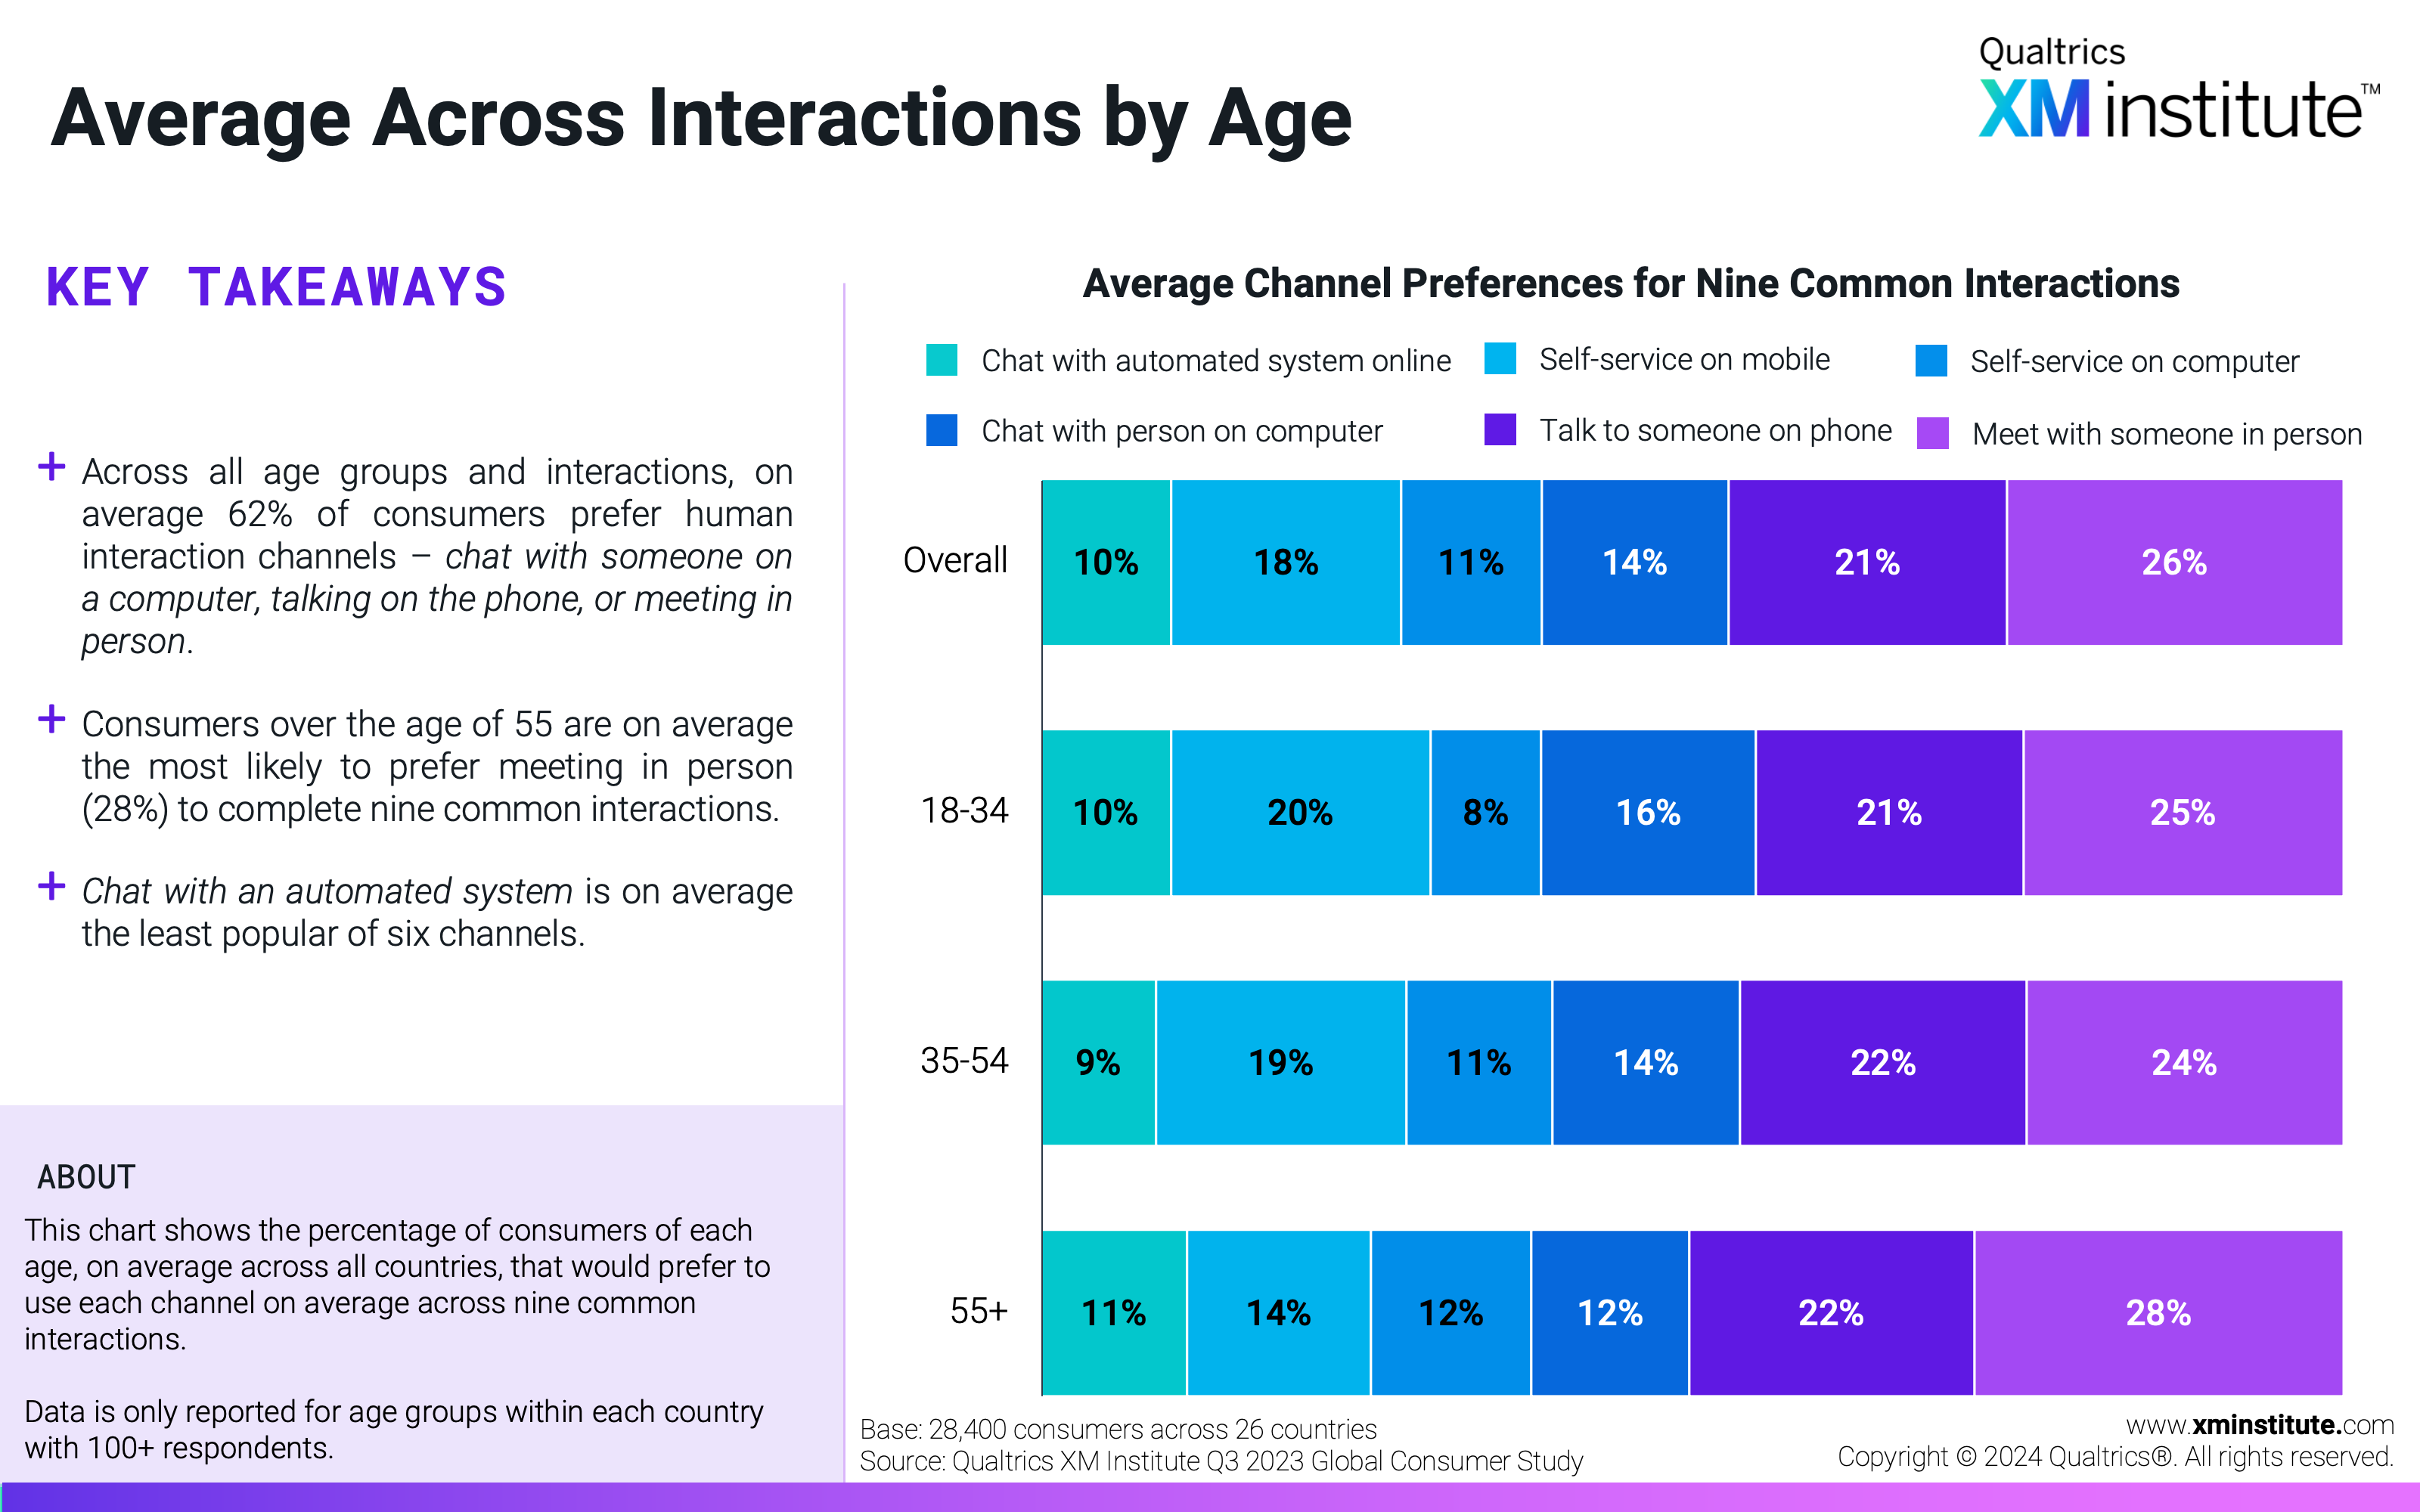
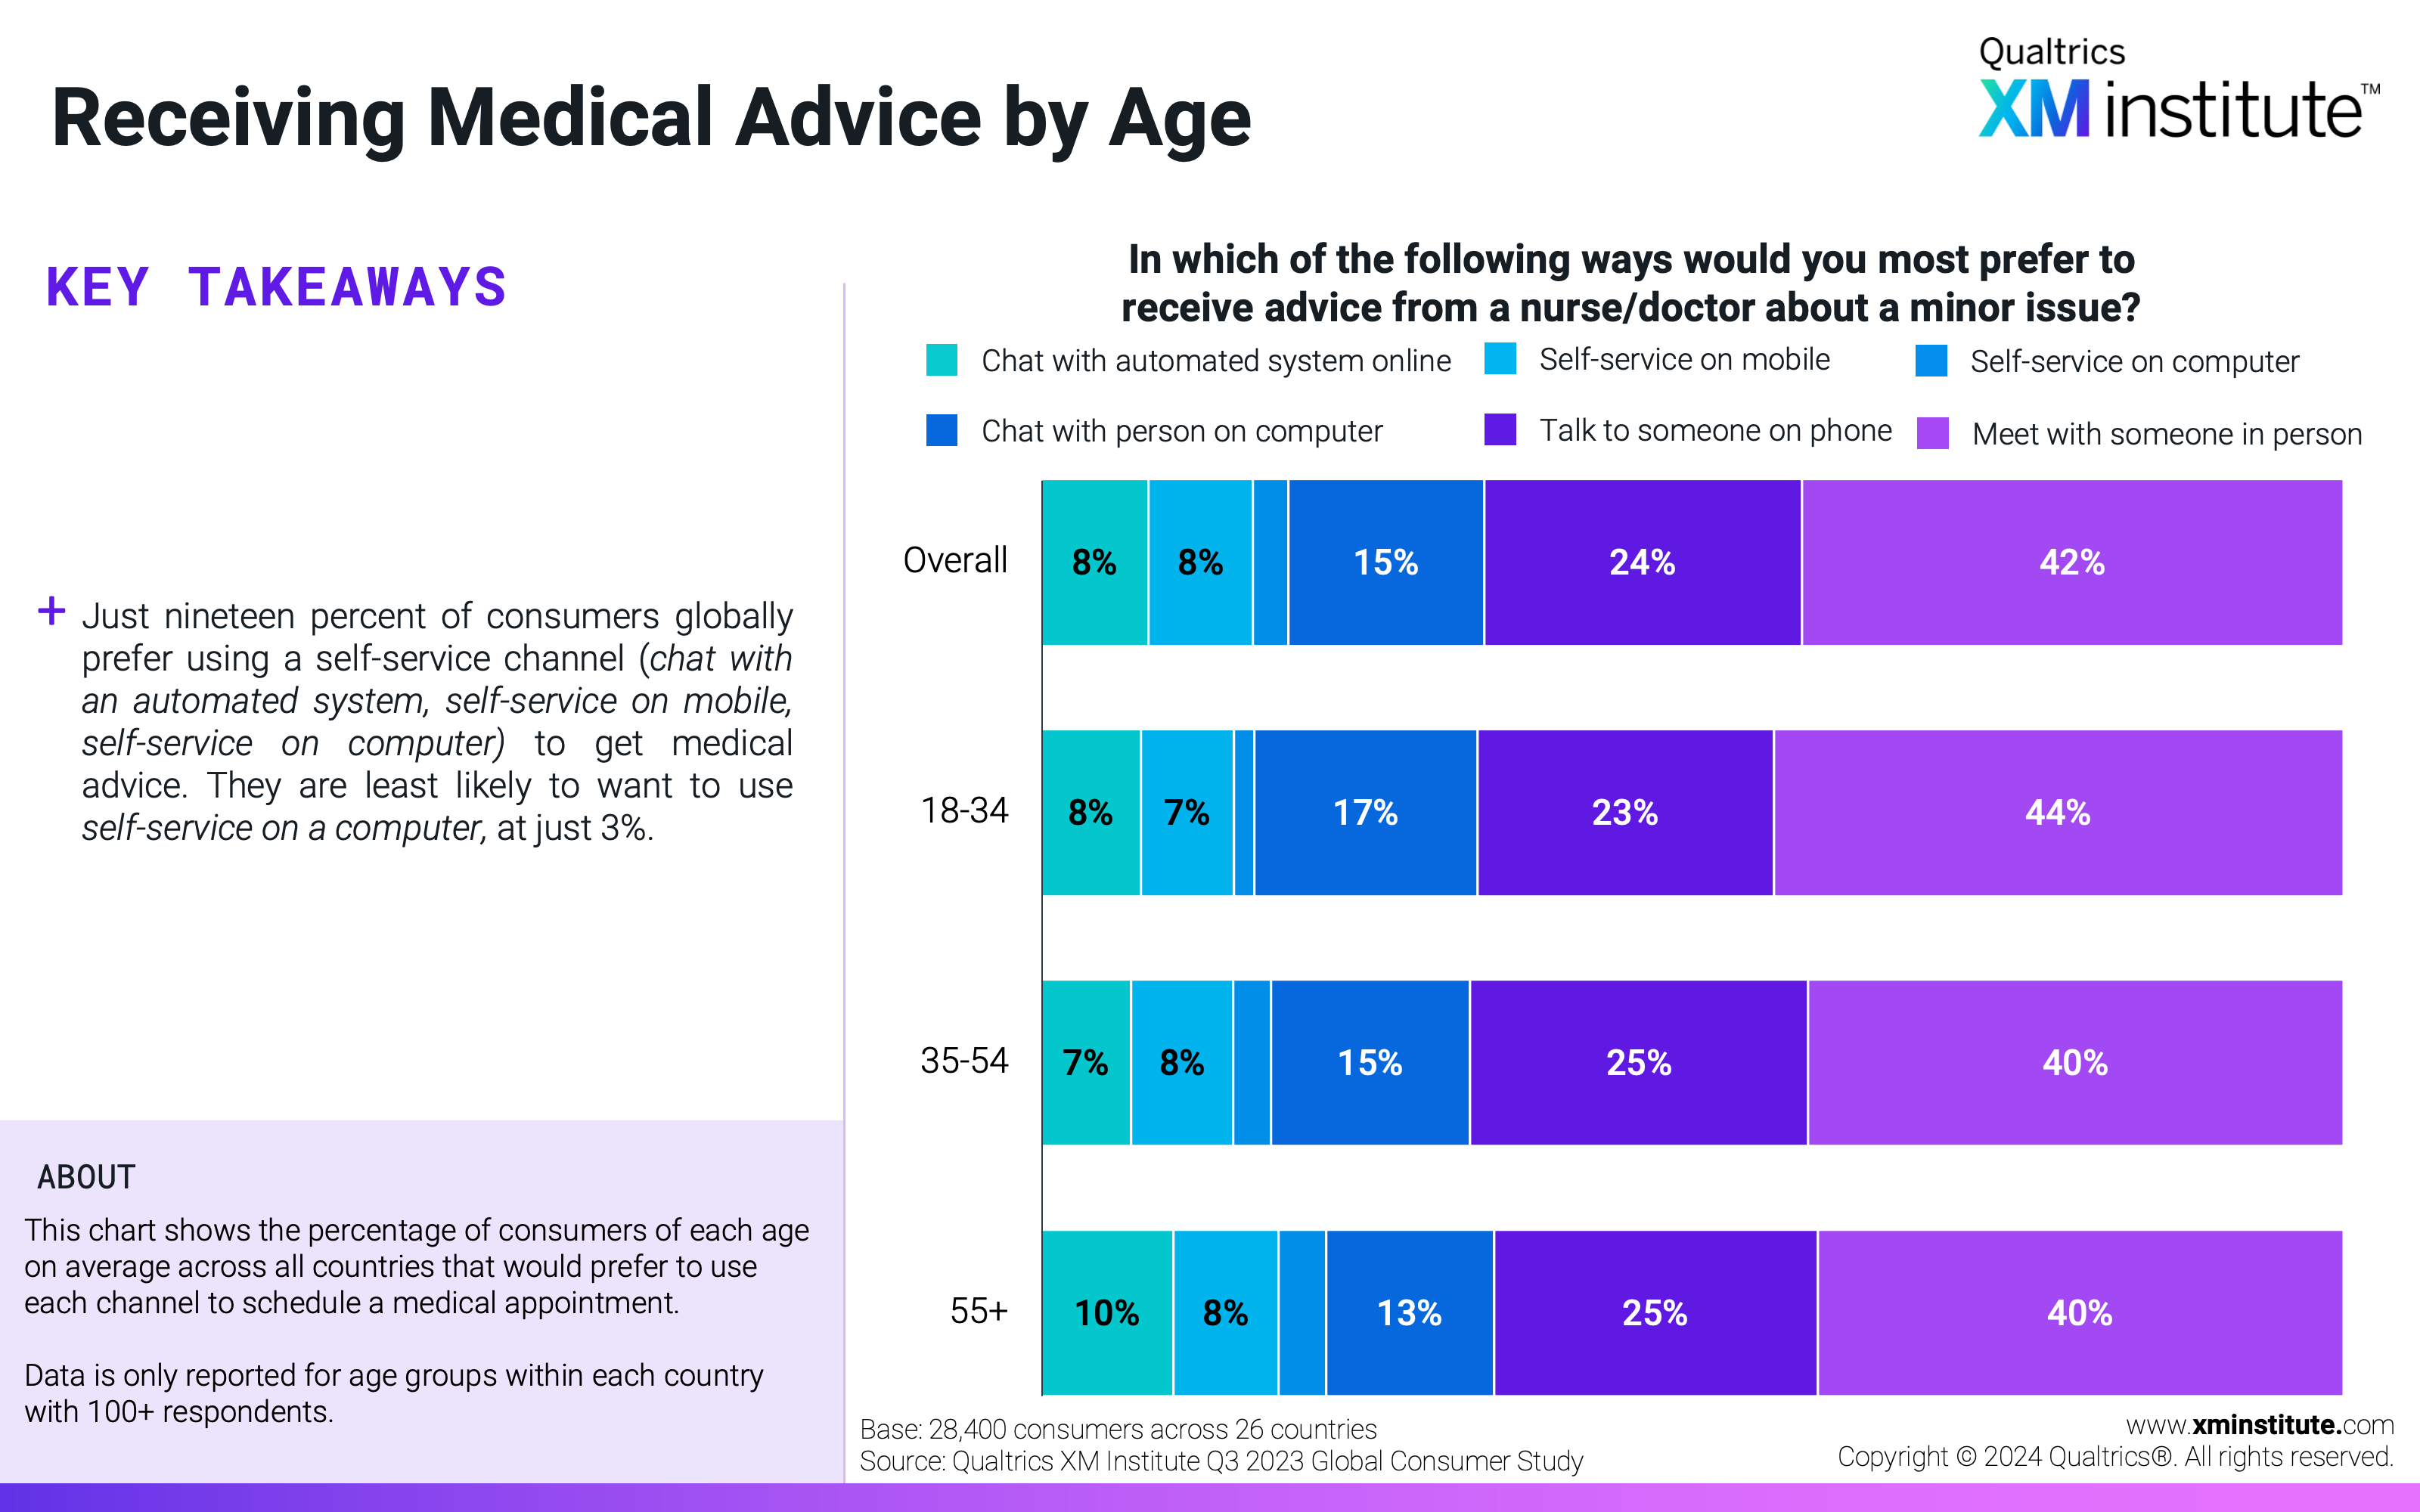
  • Consumers prefer human channels. On average, across all countries and activities, 62% of consumers prefer using one of three human-mediated channels (chat with a person on a computer, talk with someone on the phone, meet with someone in person). This preference is strongest for receiving advice from a nurse/doctor and weakest for booking a plane ticket.
  • Chat with an automated system is the least popular channel. Consumers are least likely to prefer using chat with an automated system. Only 10% on average would prefer to use this channel across nine common activities. This channel is most popular for getting the status on an order, with 13% preferring to use it to complete this activity.
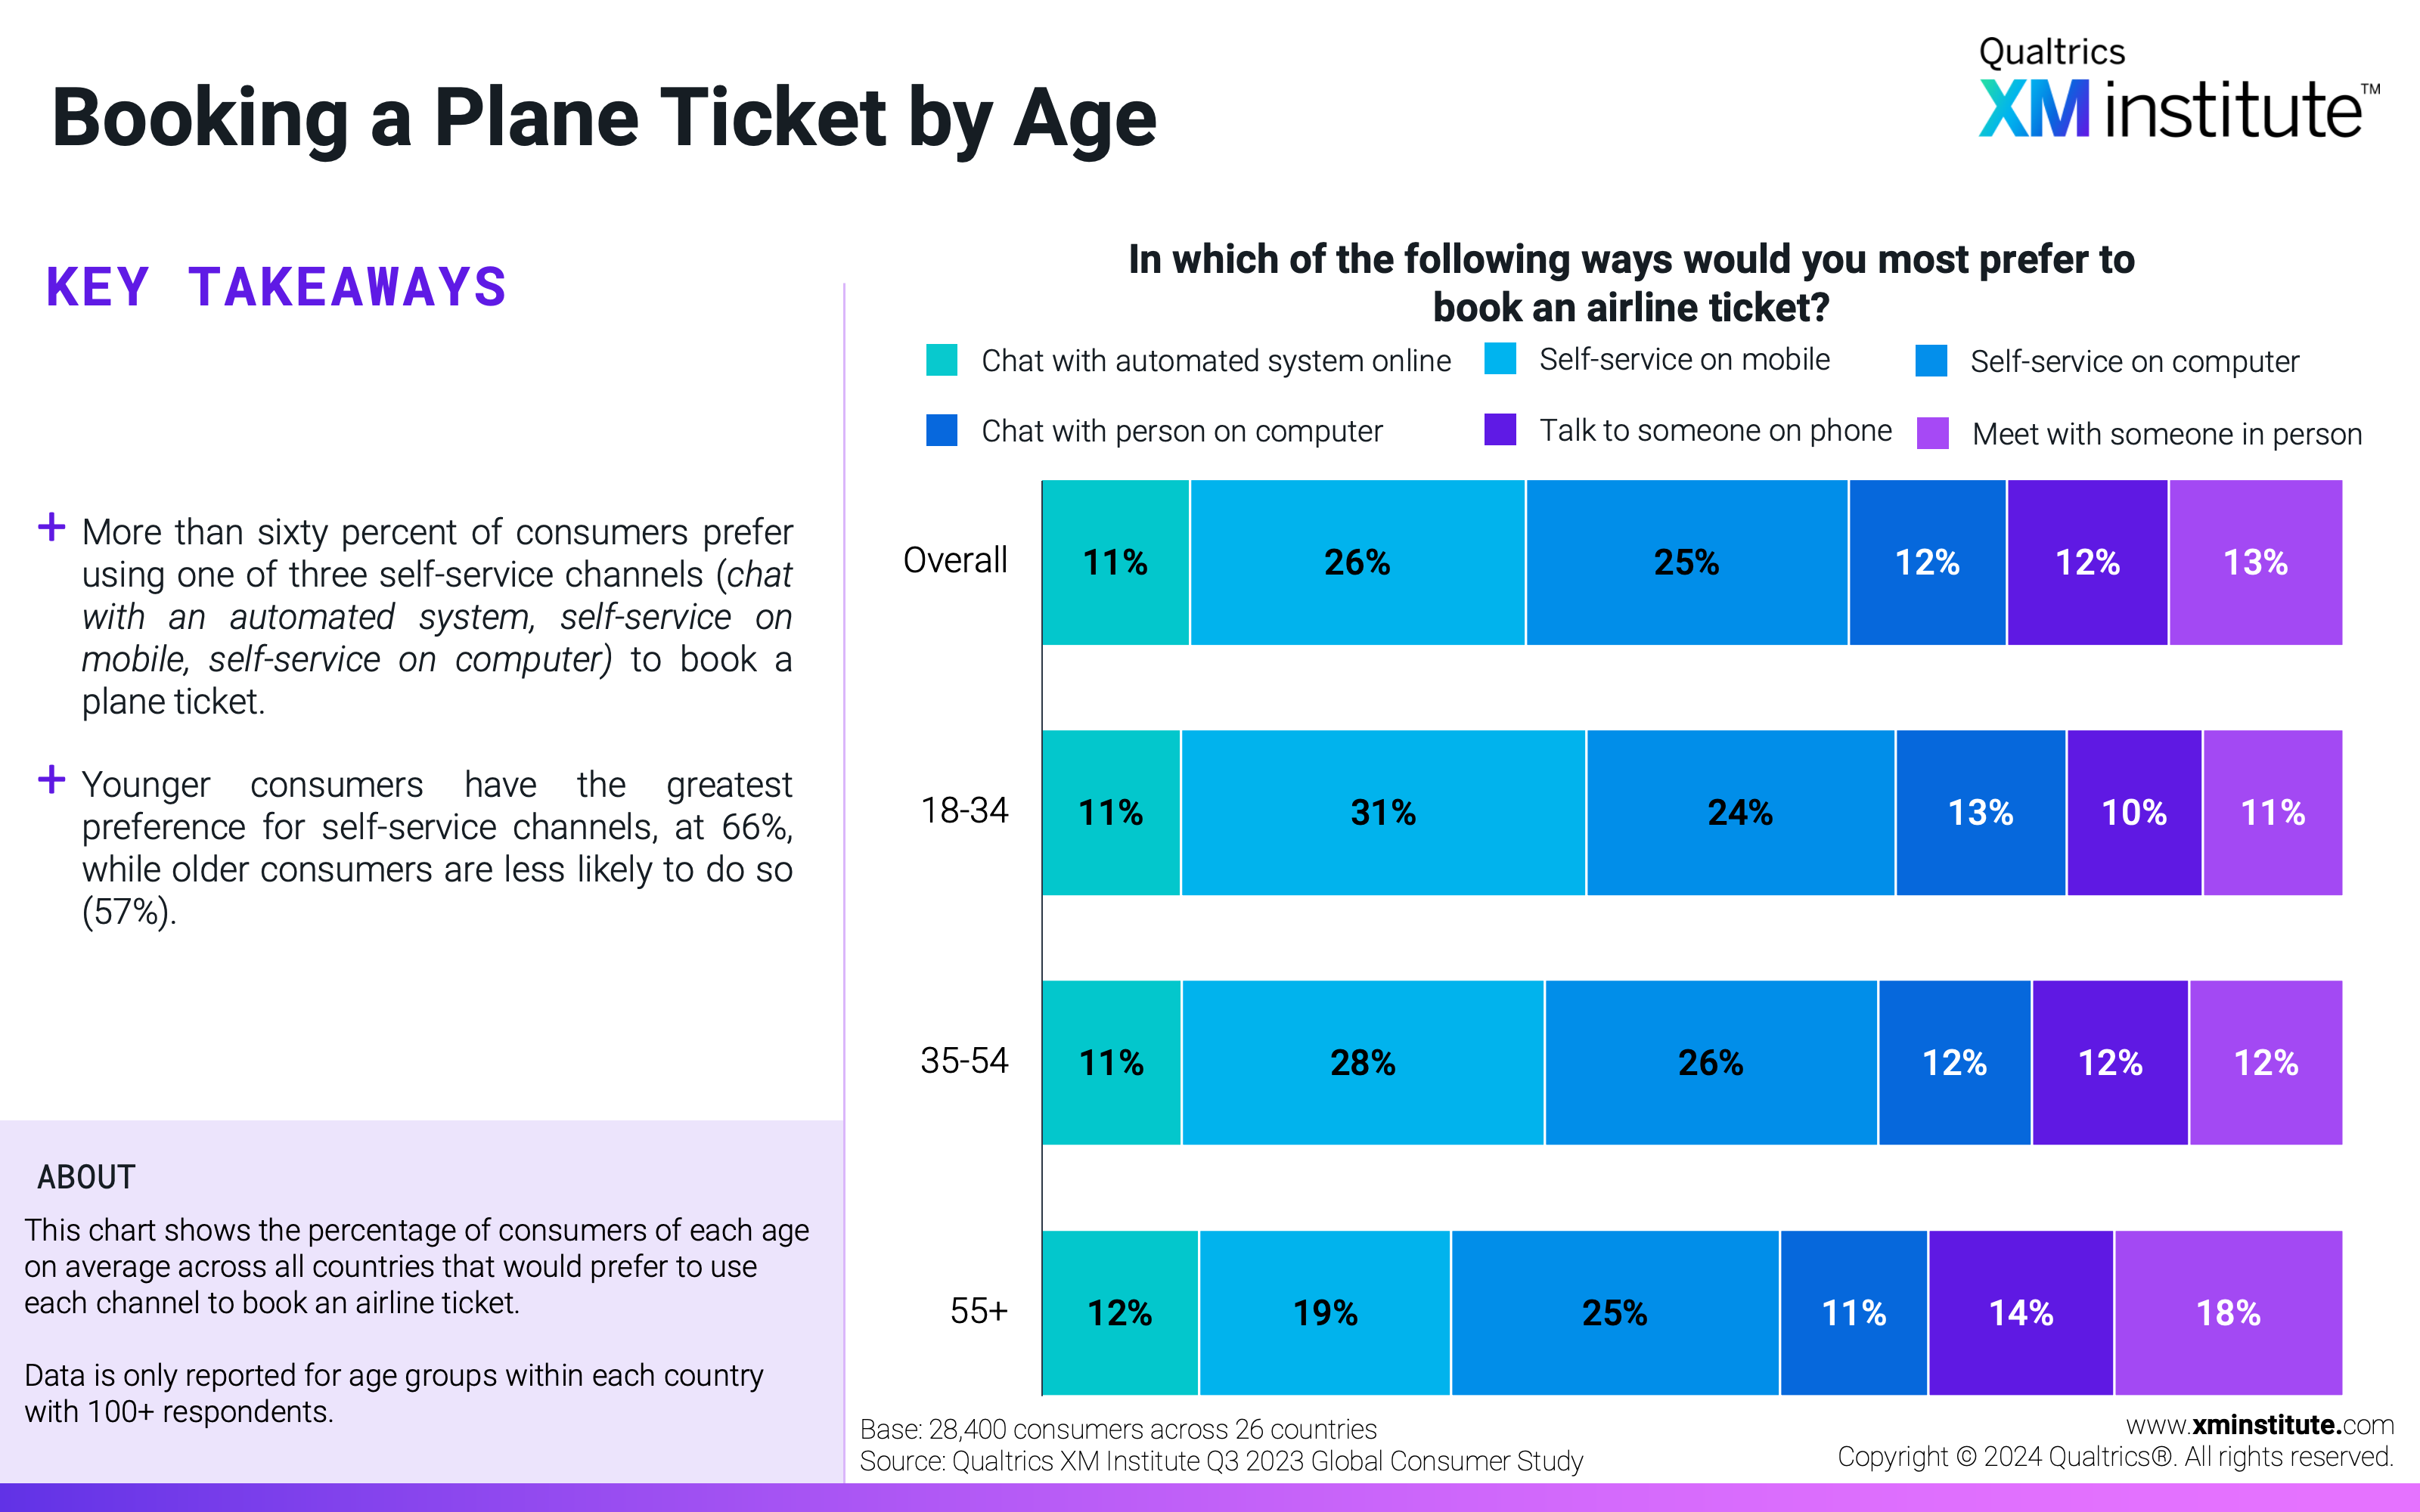
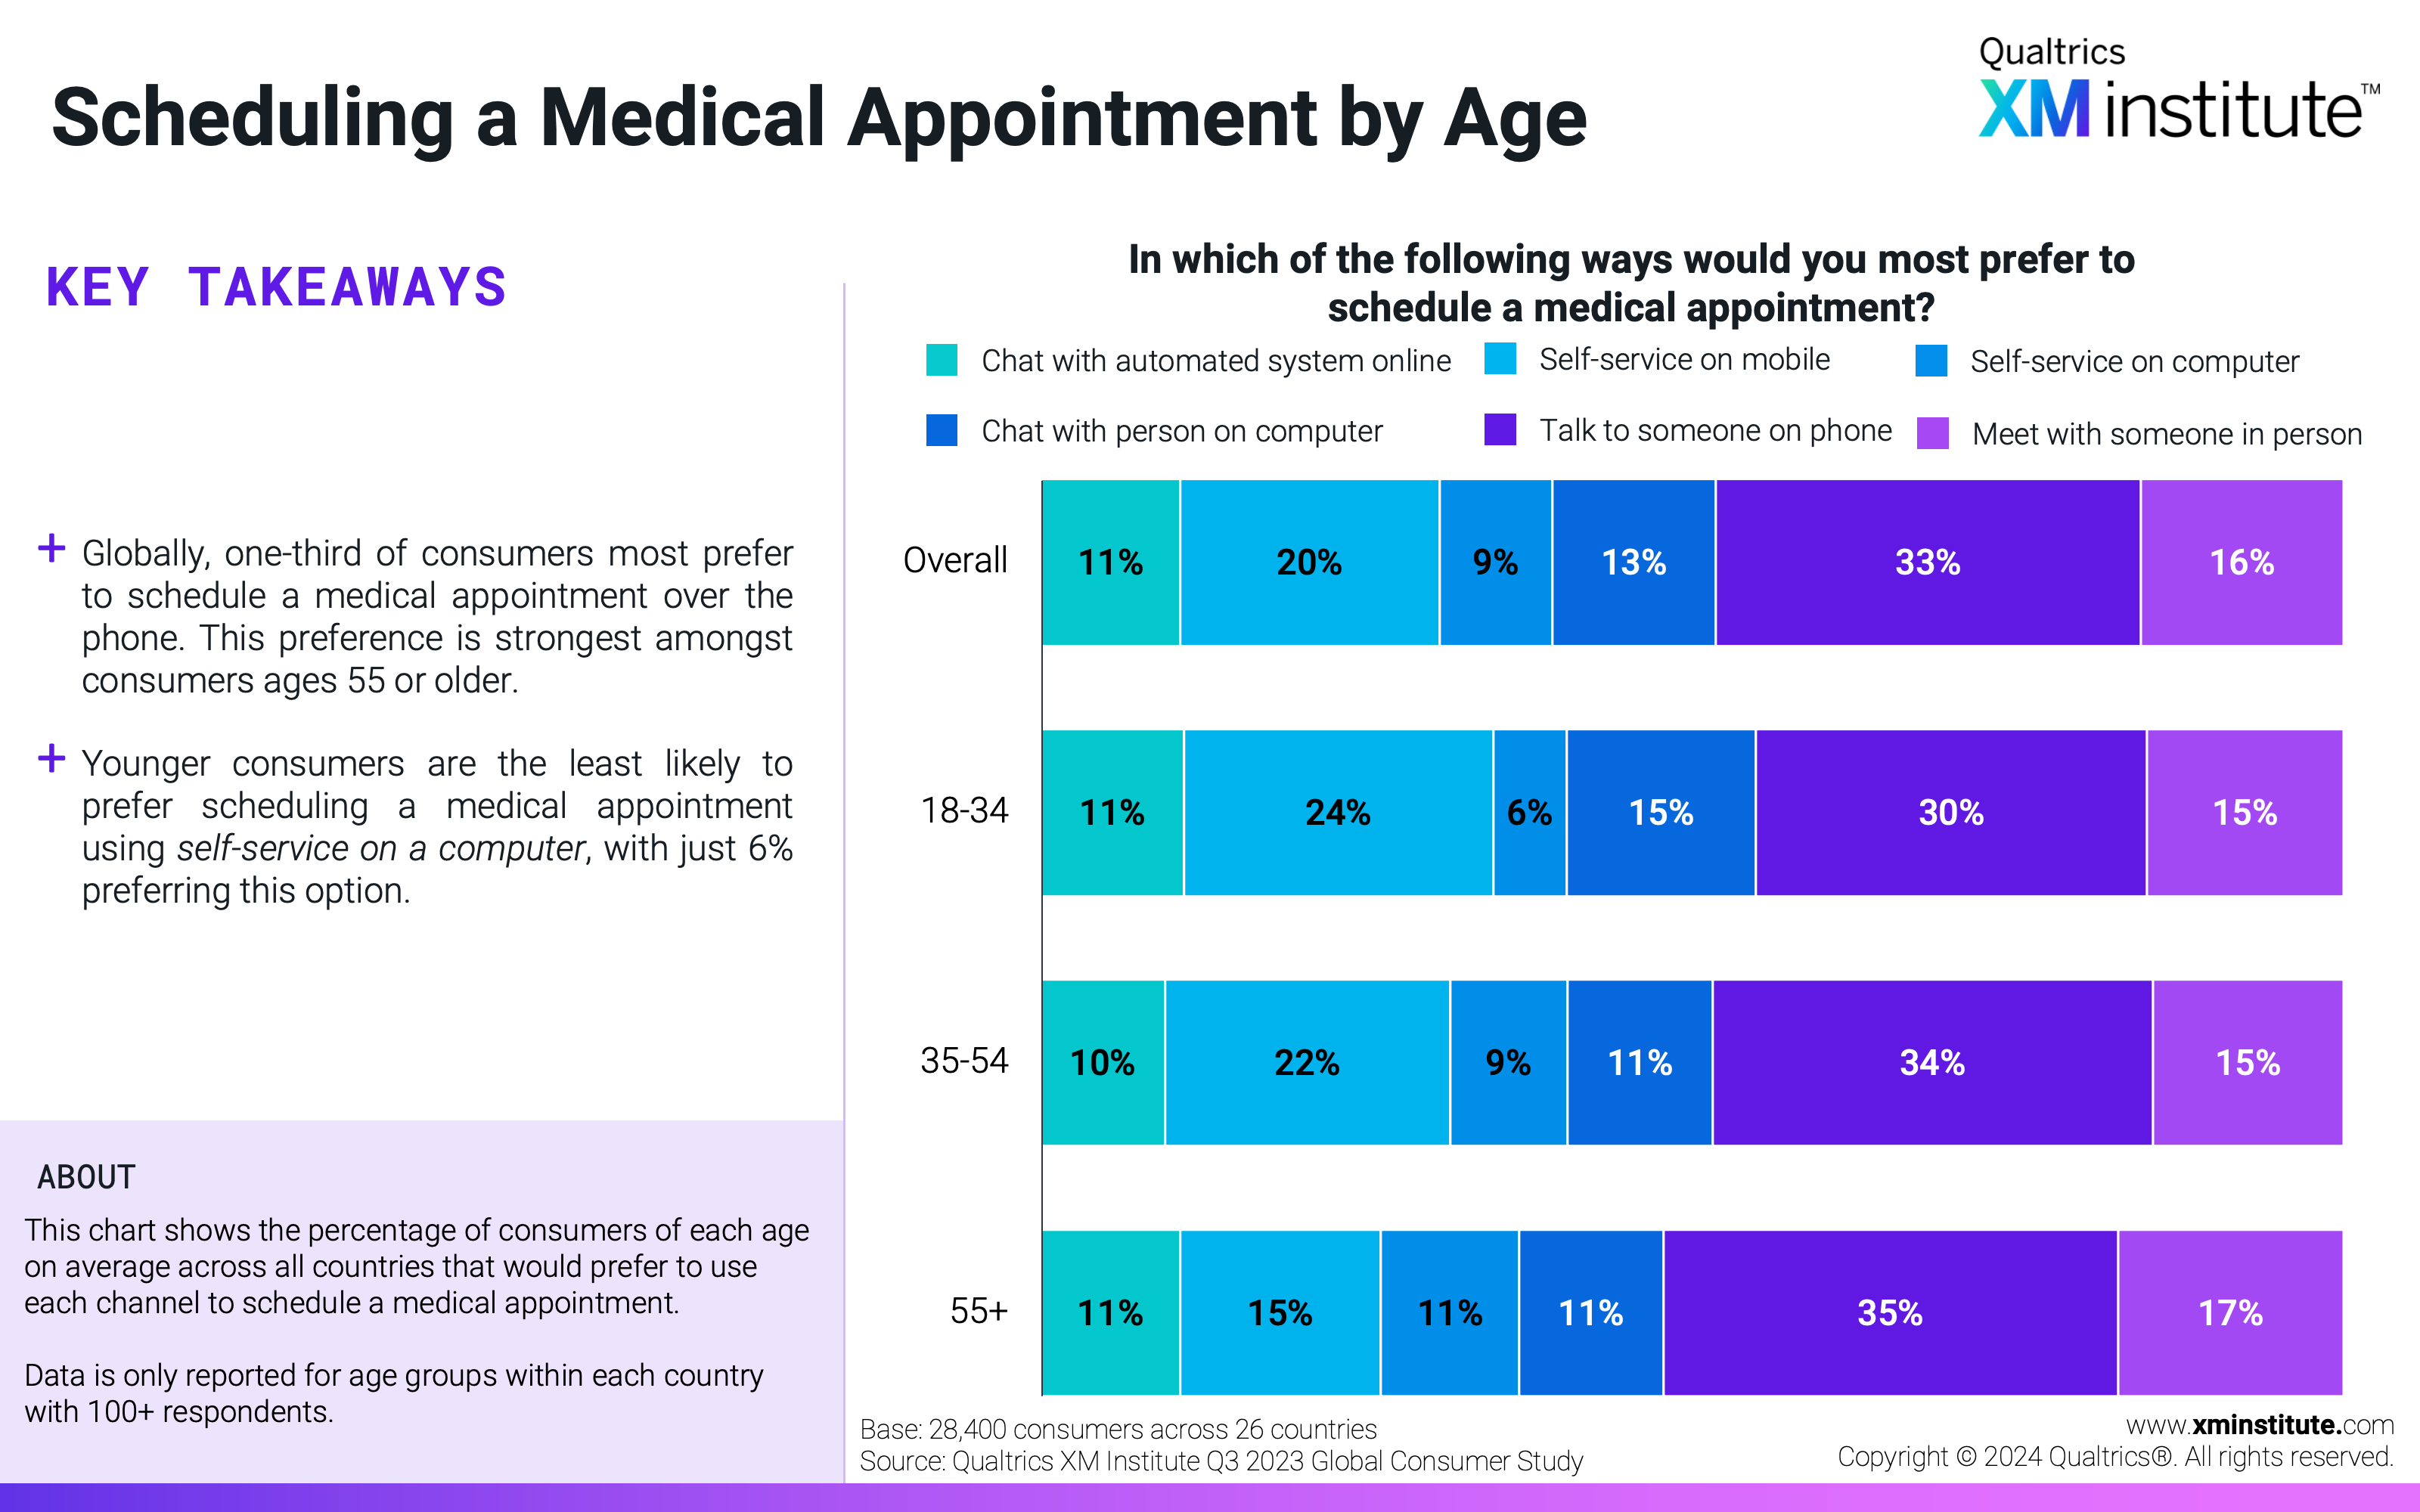
  • Younger consumers are the least likely to prefer self-service on a computer. Compared to consumers from the two older age groups, consumers between 18 and 34 are the least likely to choose to complete activities through self-service on their computers. Instead, they are the most likely to use self-service on mobile and chat with a person on a computer.
  • Filipino consumers are the most likely to prefer human-mediated channels. Filipino consumers prefer to use one of three human-assisted channels 74% of the time, the most of any country. South Korean and Finnish consumers are the least likely to prefer using human channels, with only 50% each country favoring them.

Figures

Here are the figures in this Data Snapshot:

  1. Average Across Interactions by Age This chart shows the percentage of consumers of each age, on average across all countries, that would prefer to use each channel on average across nine common interactions.
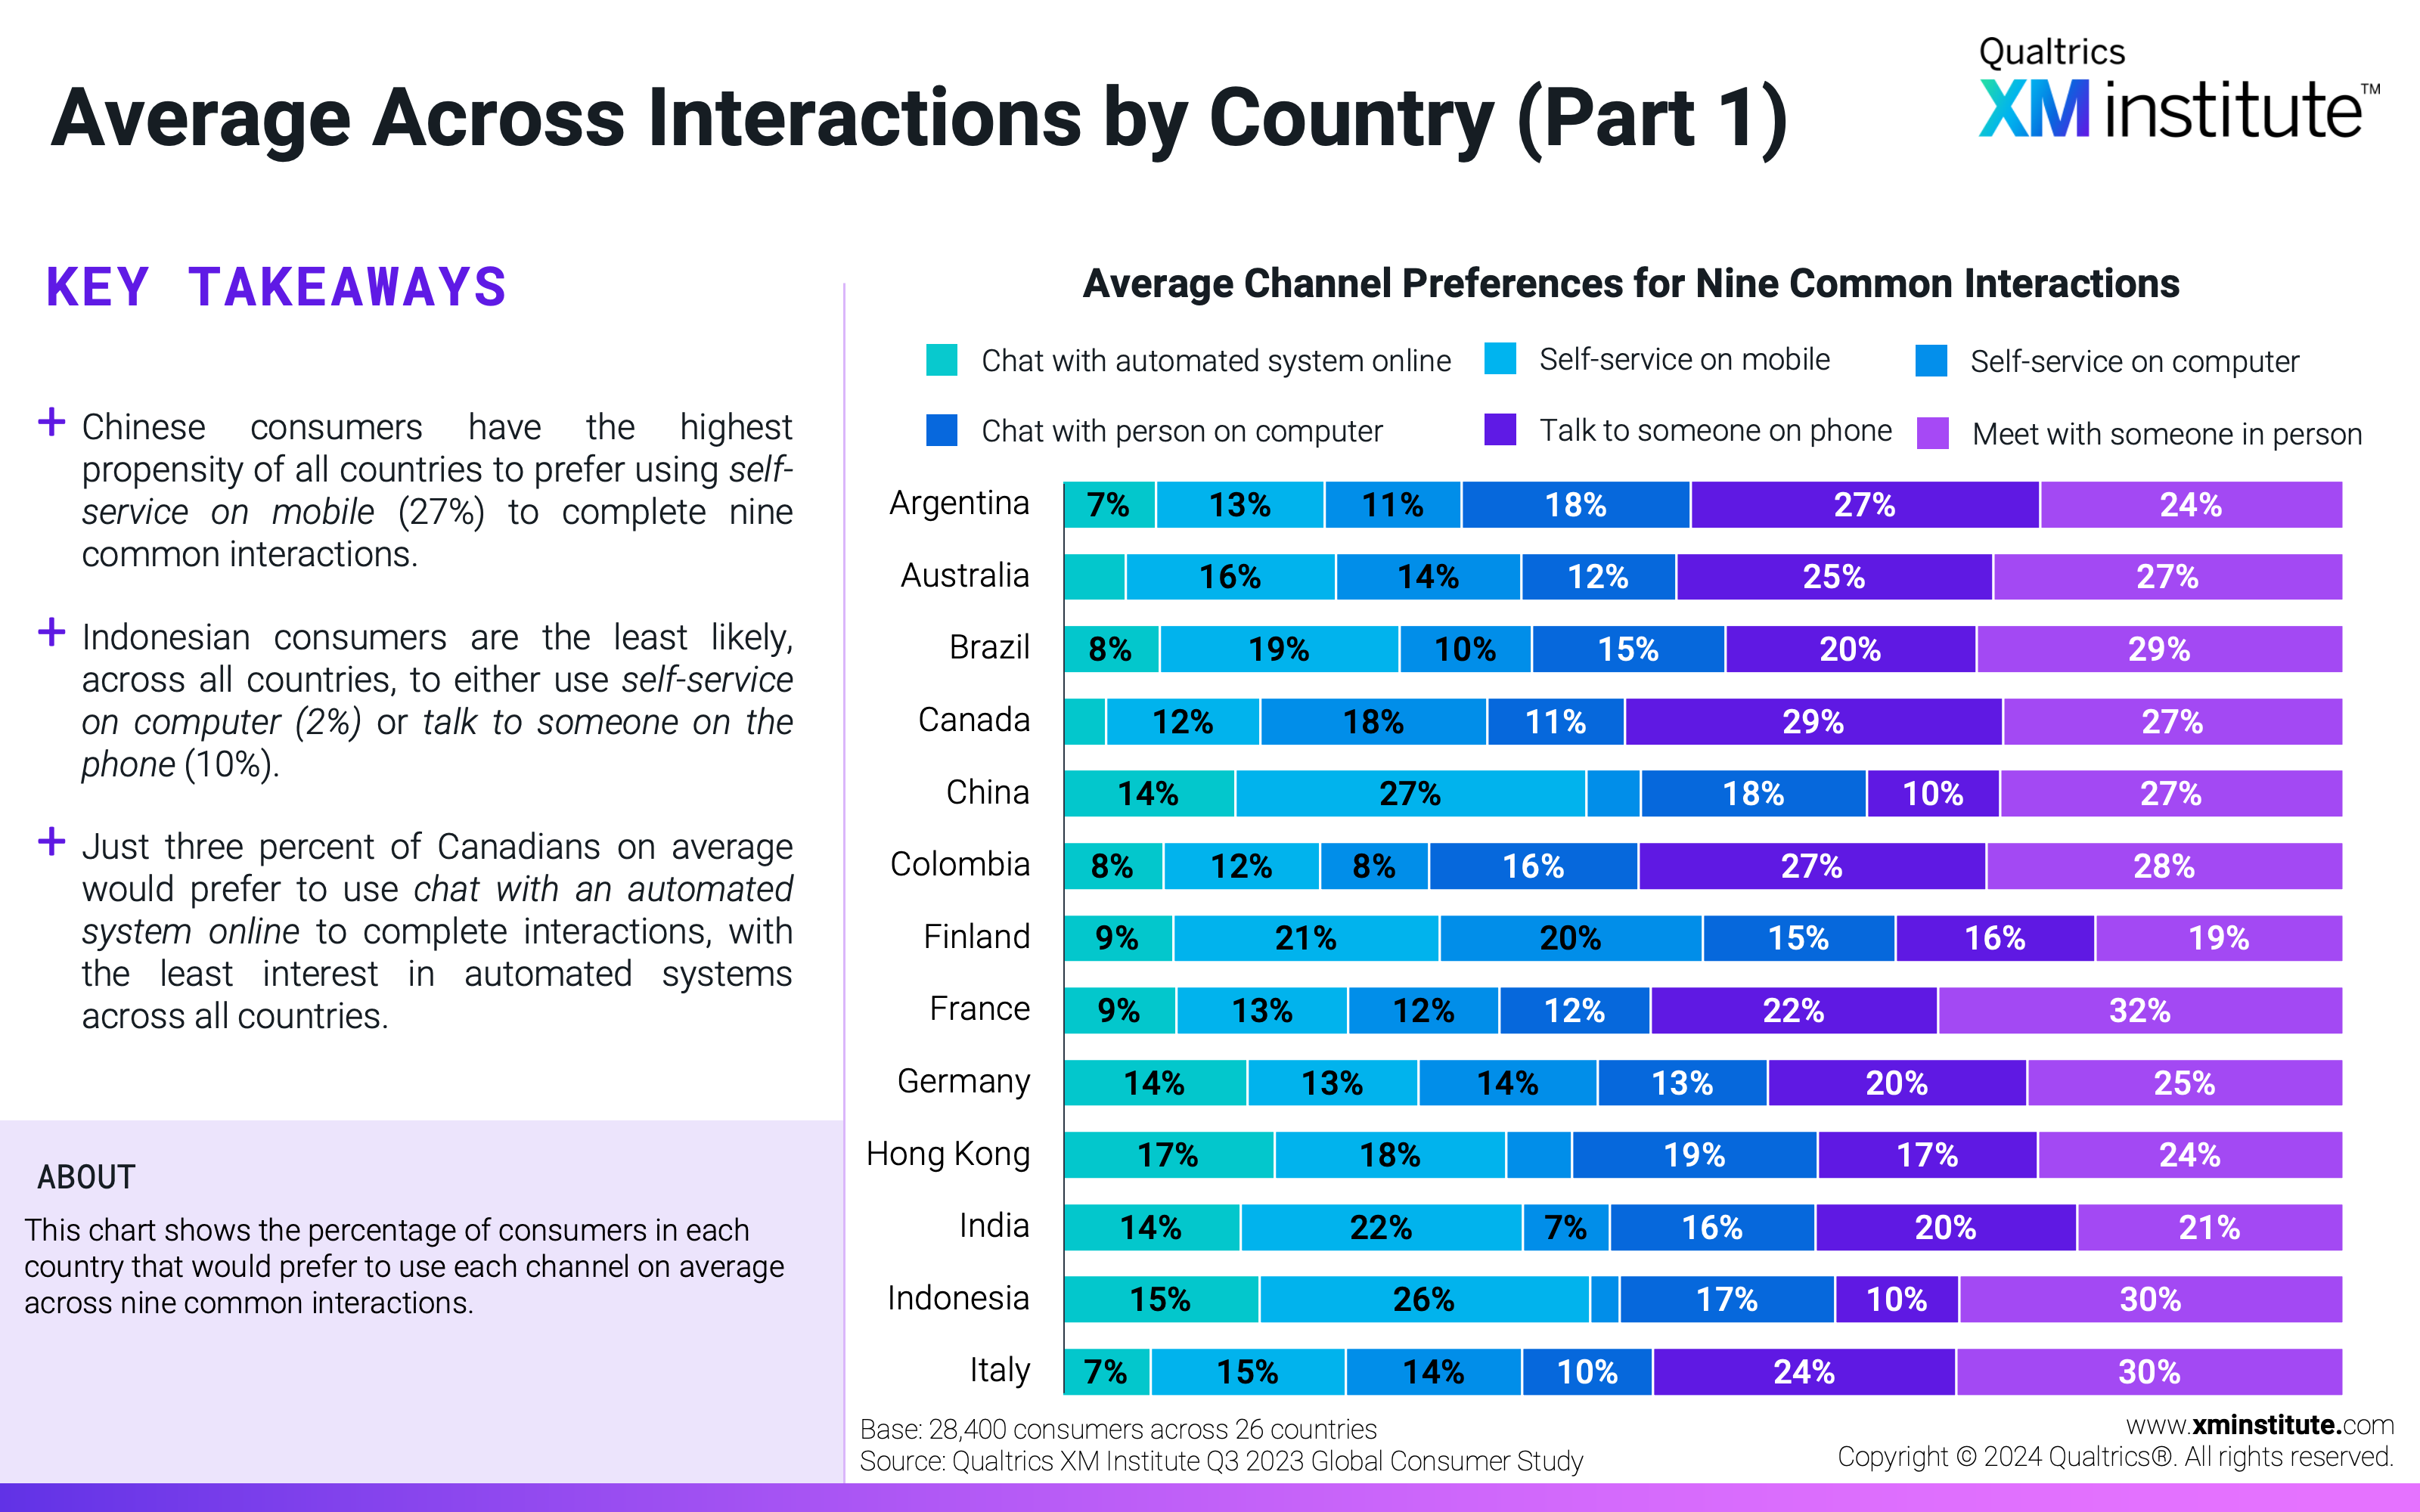
  2. Average Across Interactions by Country (Part 1) This chart shows the percentage of consumers in each country that would prefer to use each channel on average across nine common interactions.
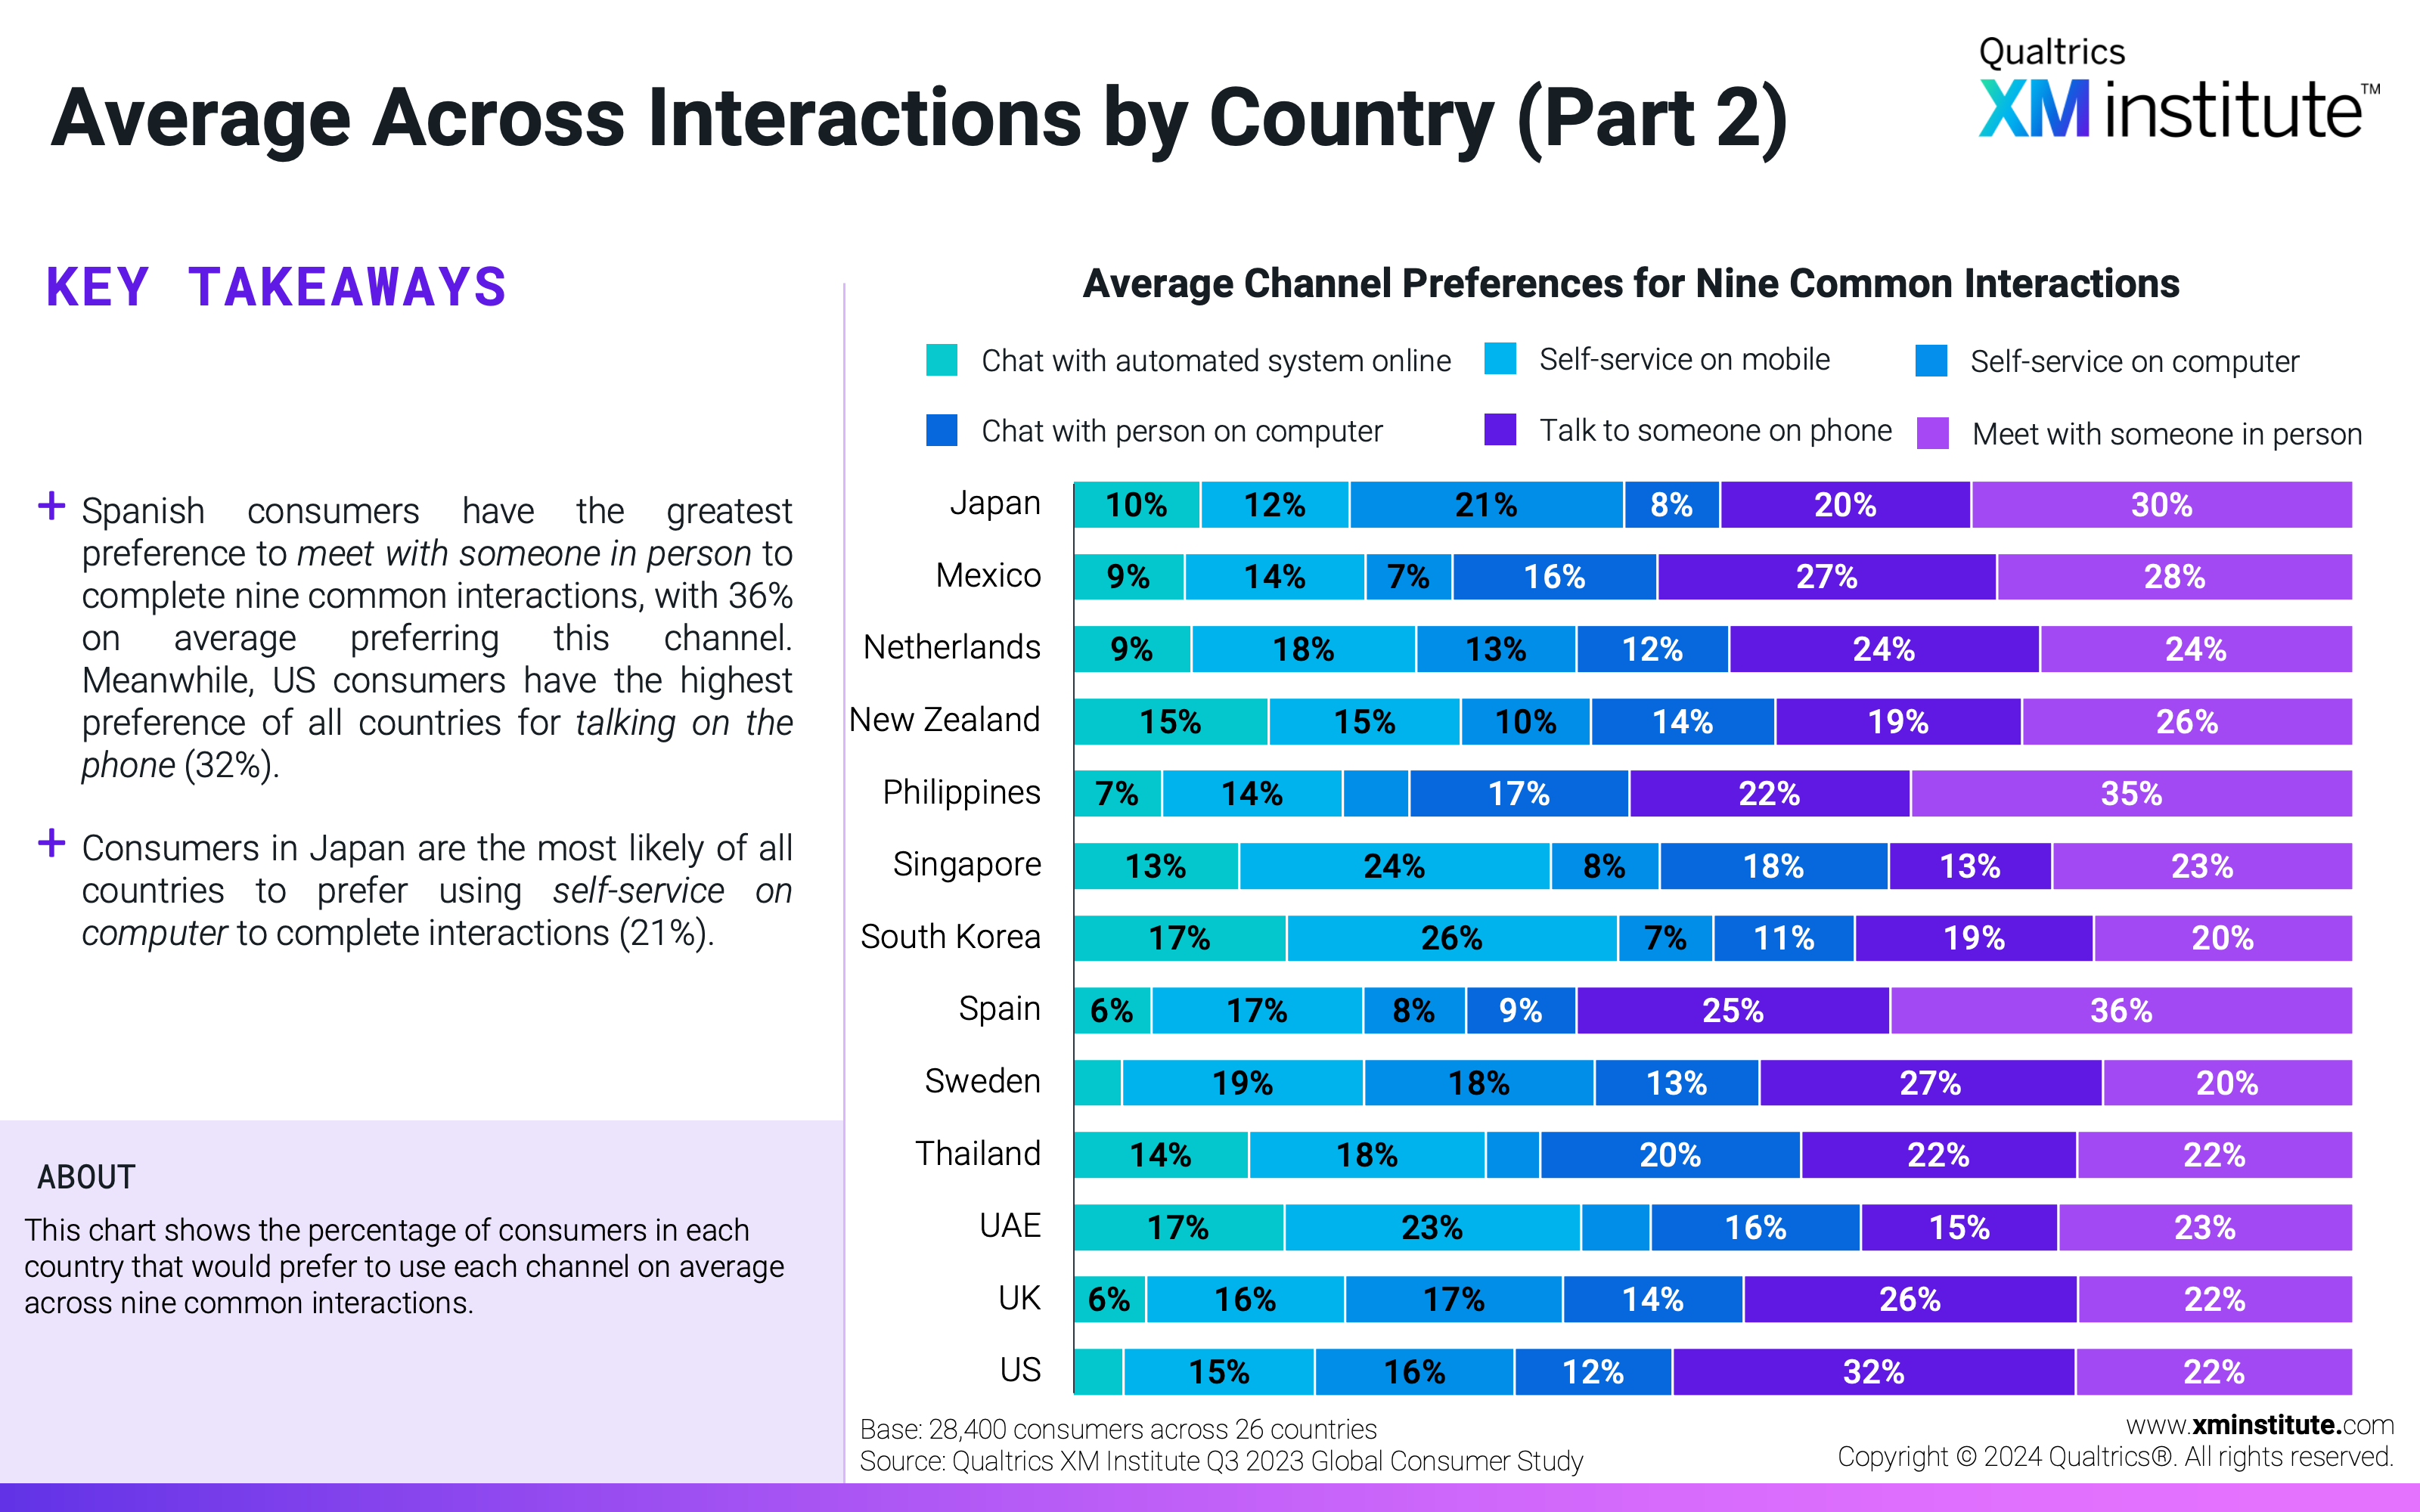
  3. Average Across Interactions by Country (Part 2) This chart shows the percentage of consumers in each country that would prefer to use each channel on average across nine common interactions.
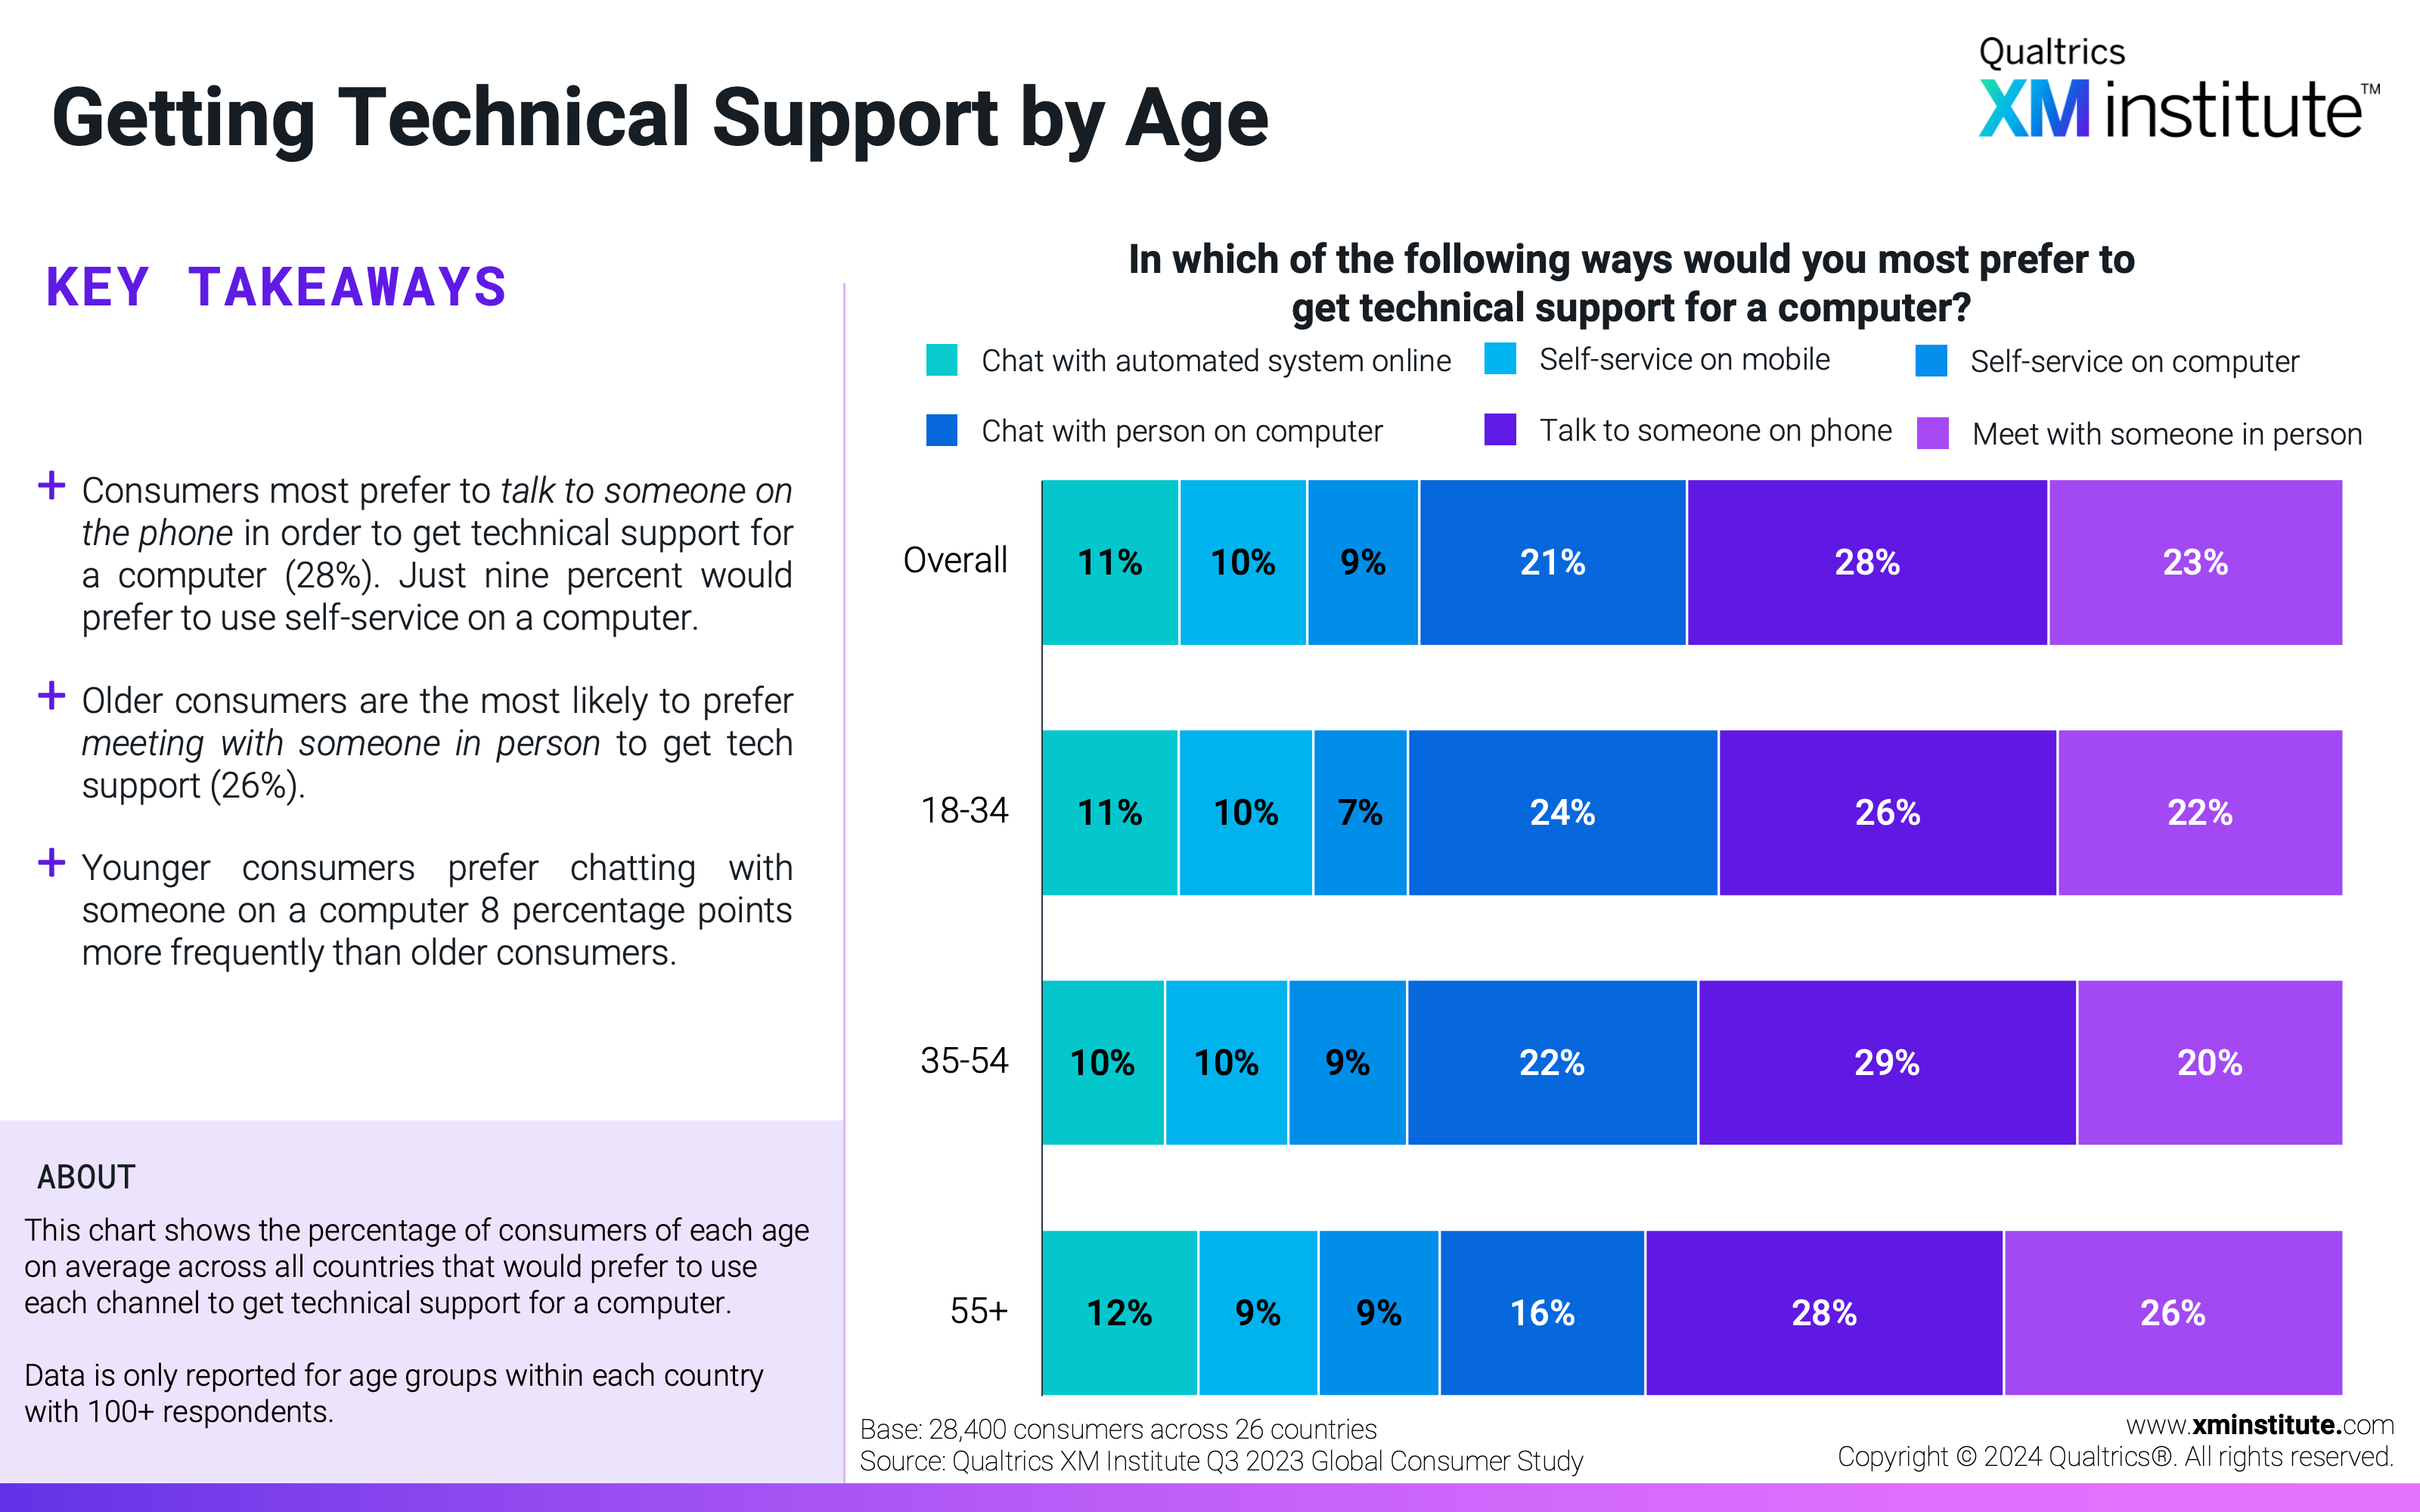
  4. Getting Technical Support by Age This chart shows the percentage of consumers of each age on average across all countries that would prefer to use each channel to get technical support for a computer.
  5. Getting Technical Support by Country (Part 1) This chart shows the percentage of consumers in each country that would prefer to use each channel to get technical support for a computer.
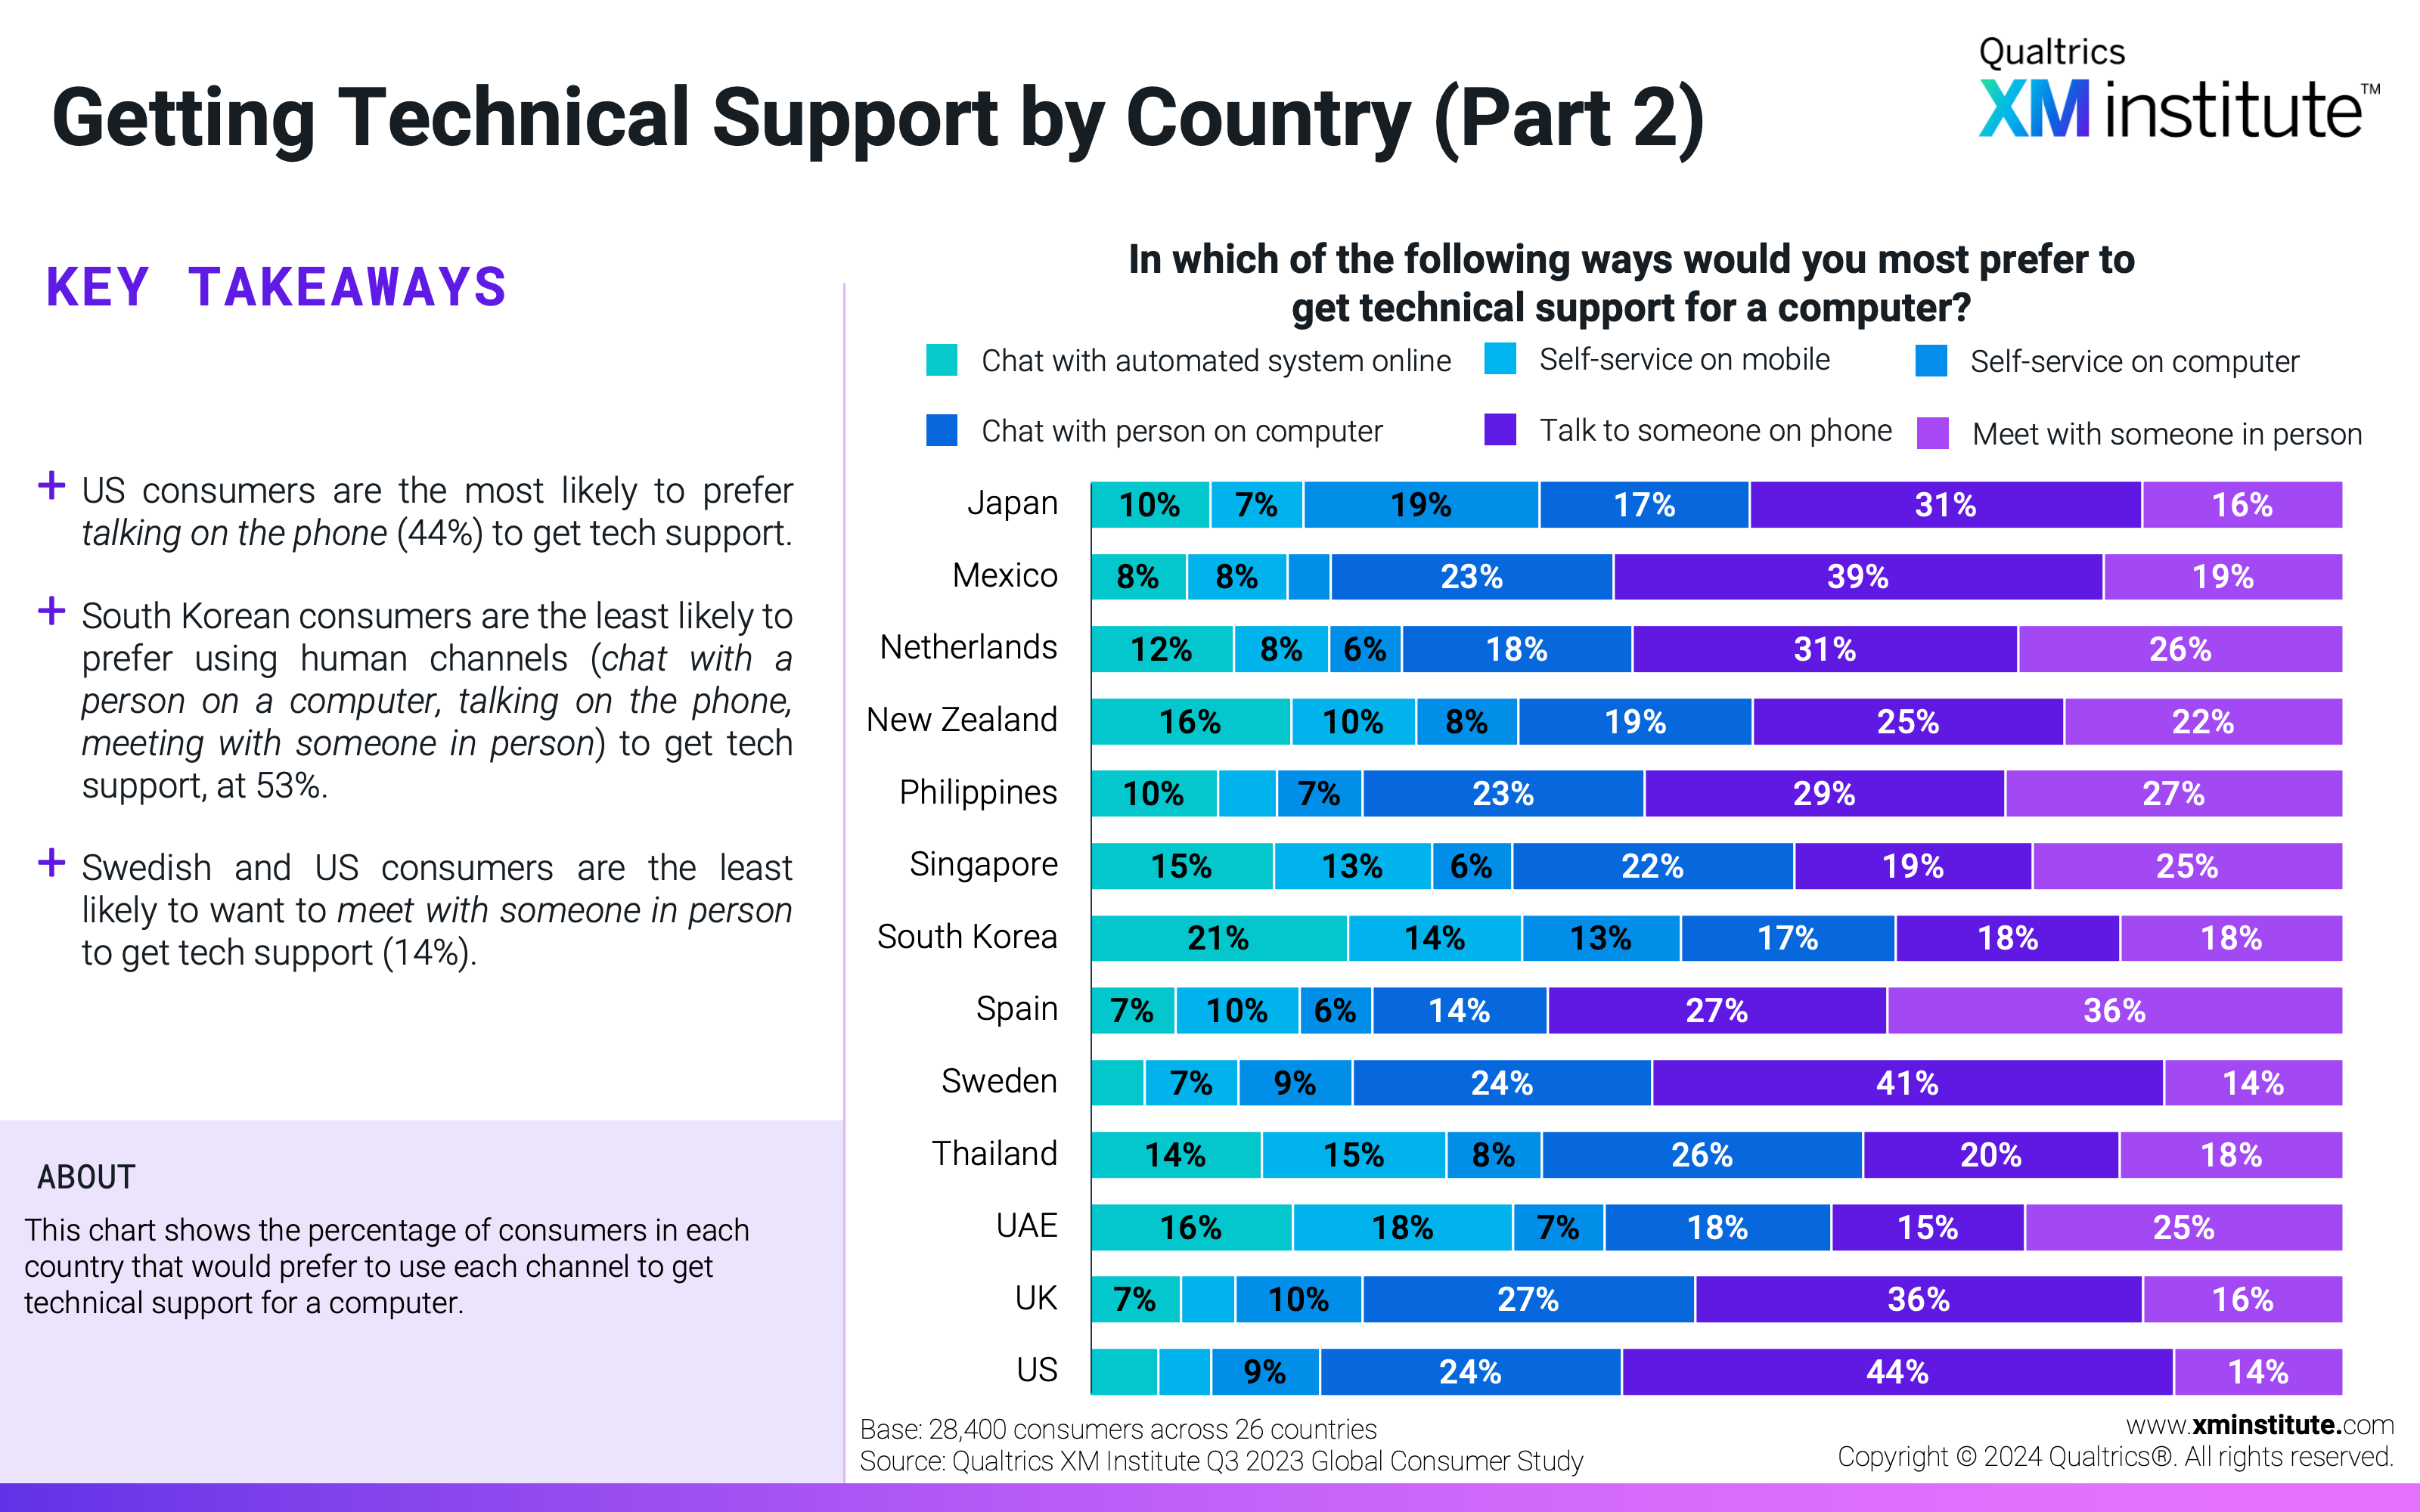
  6. Getting Technical Support by Country (Part 2) This chart shows the percentage of consumers in each country that would prefer to use each channel to get technical support for a computer.
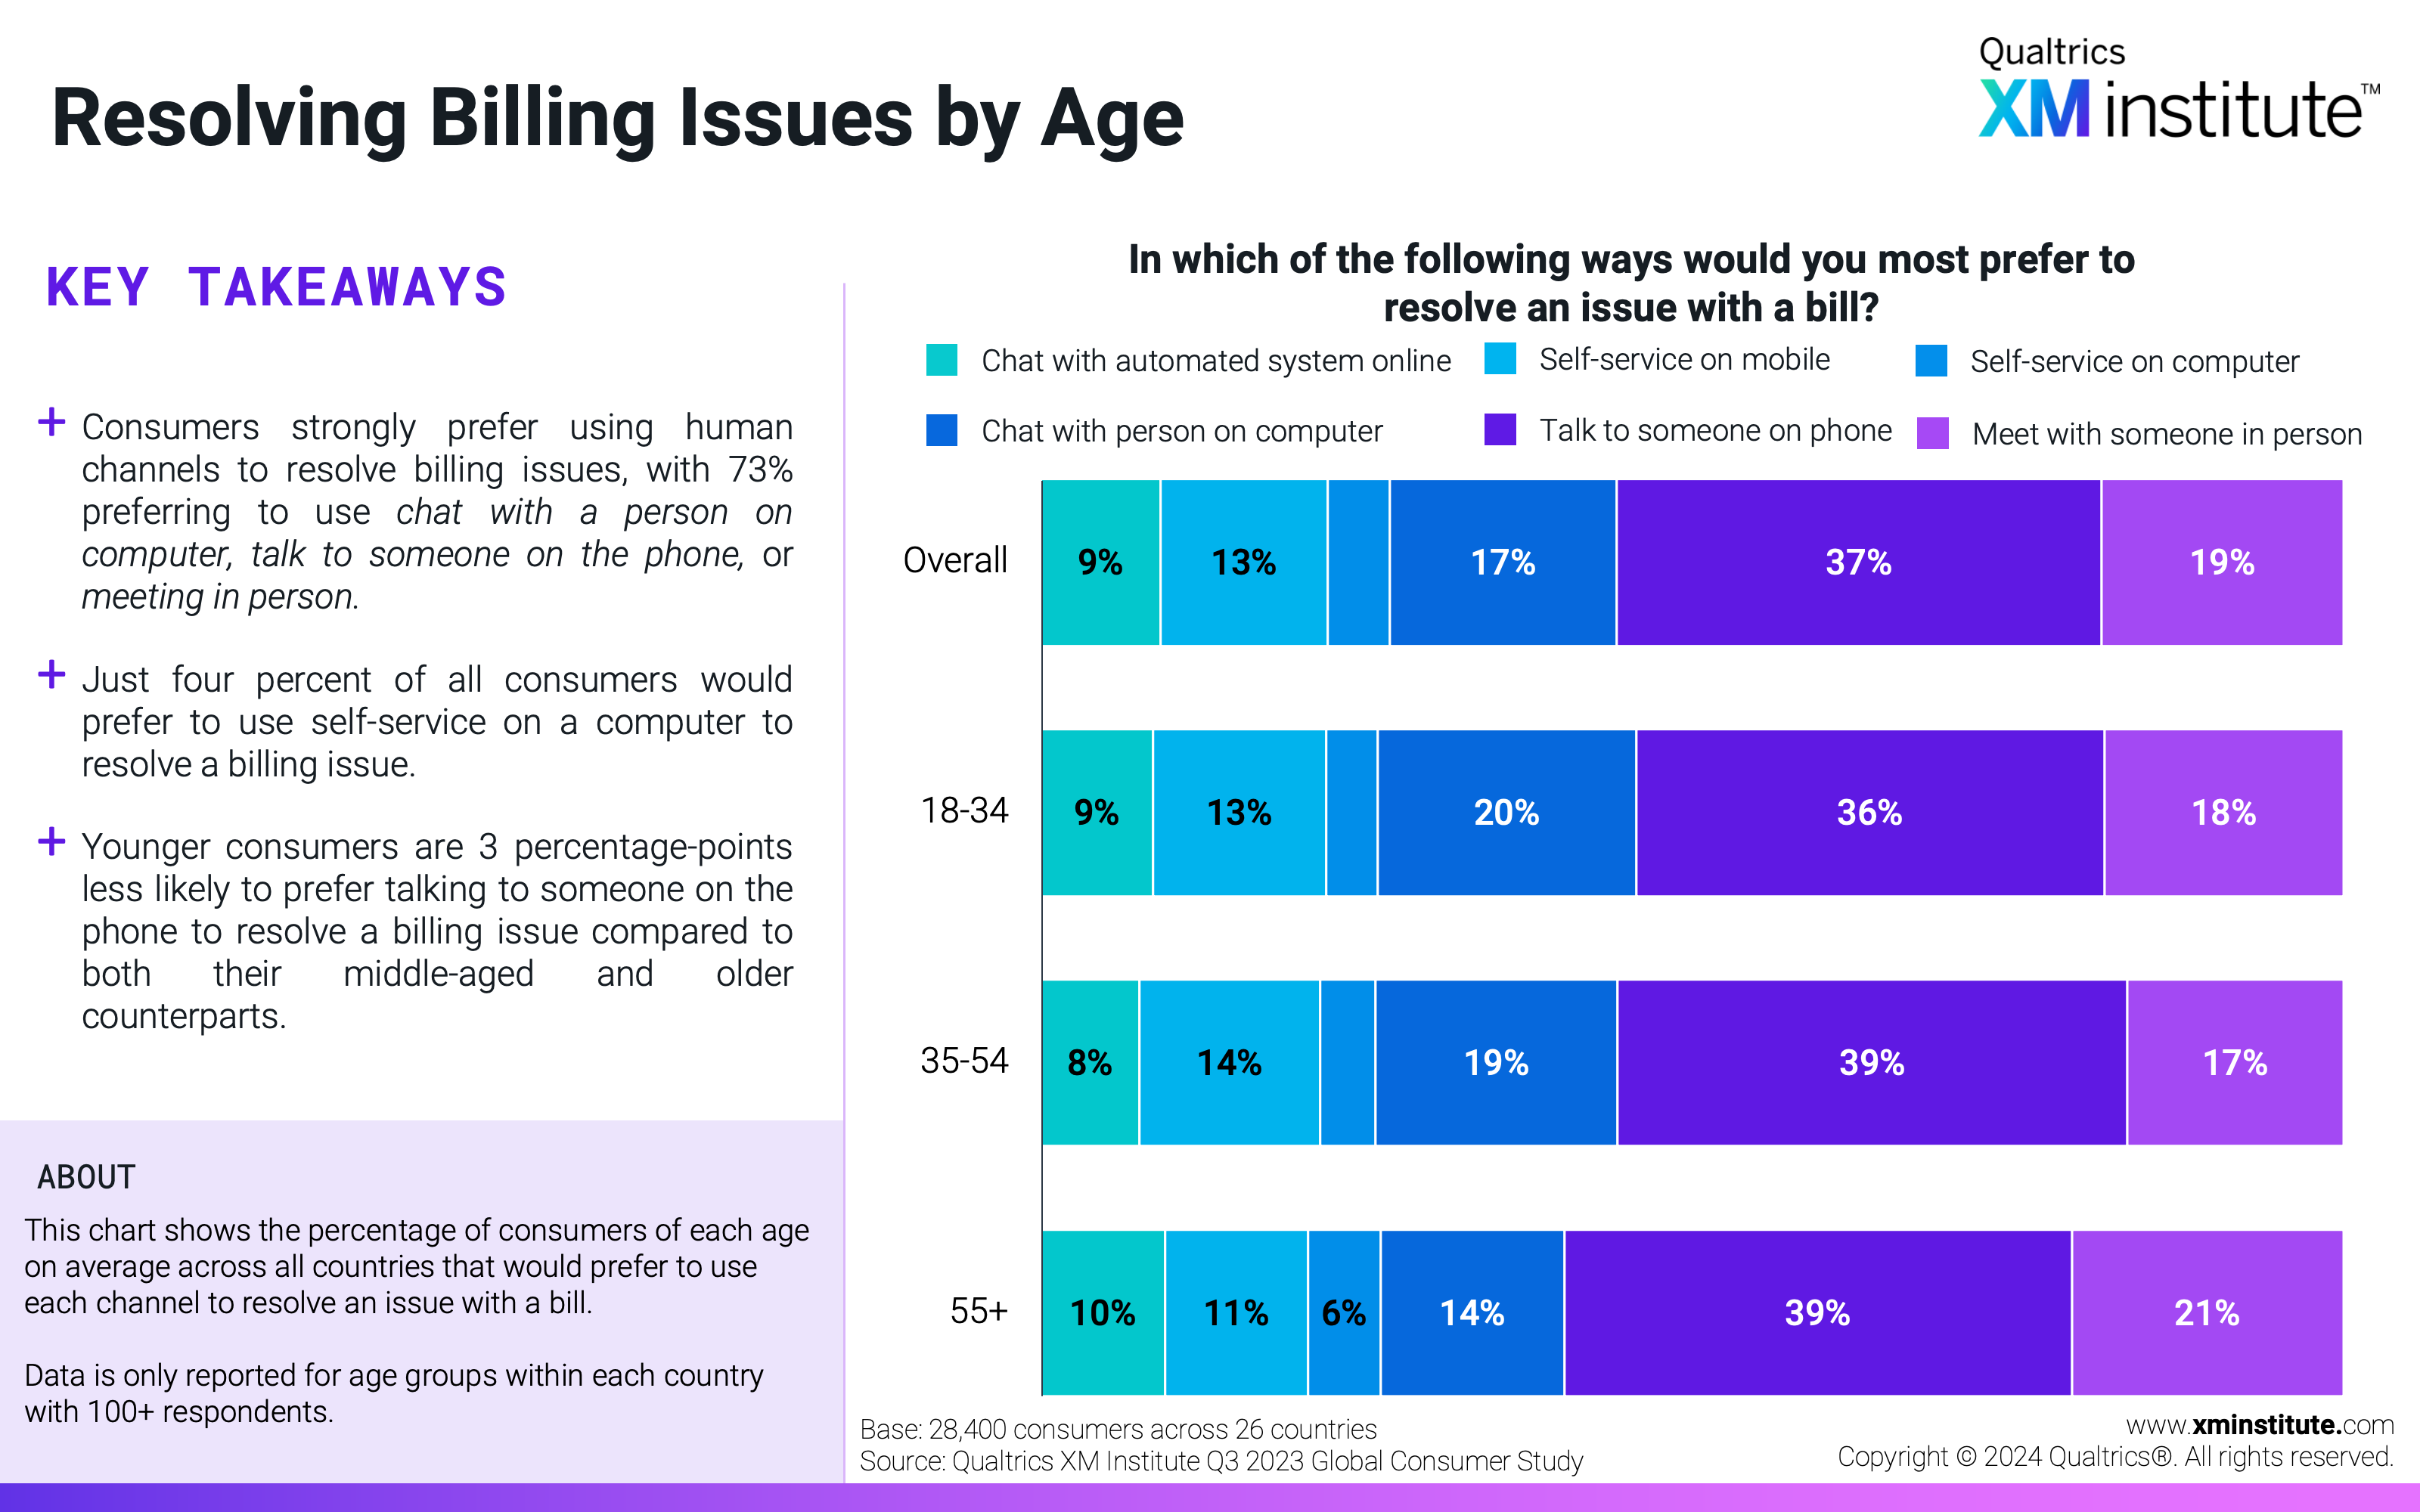
  7. Resolving Billing Issues by Age This chart shows the percentage of consumers of each age on average across all countries that would prefer to use each channel to resolve an issue with a bill.
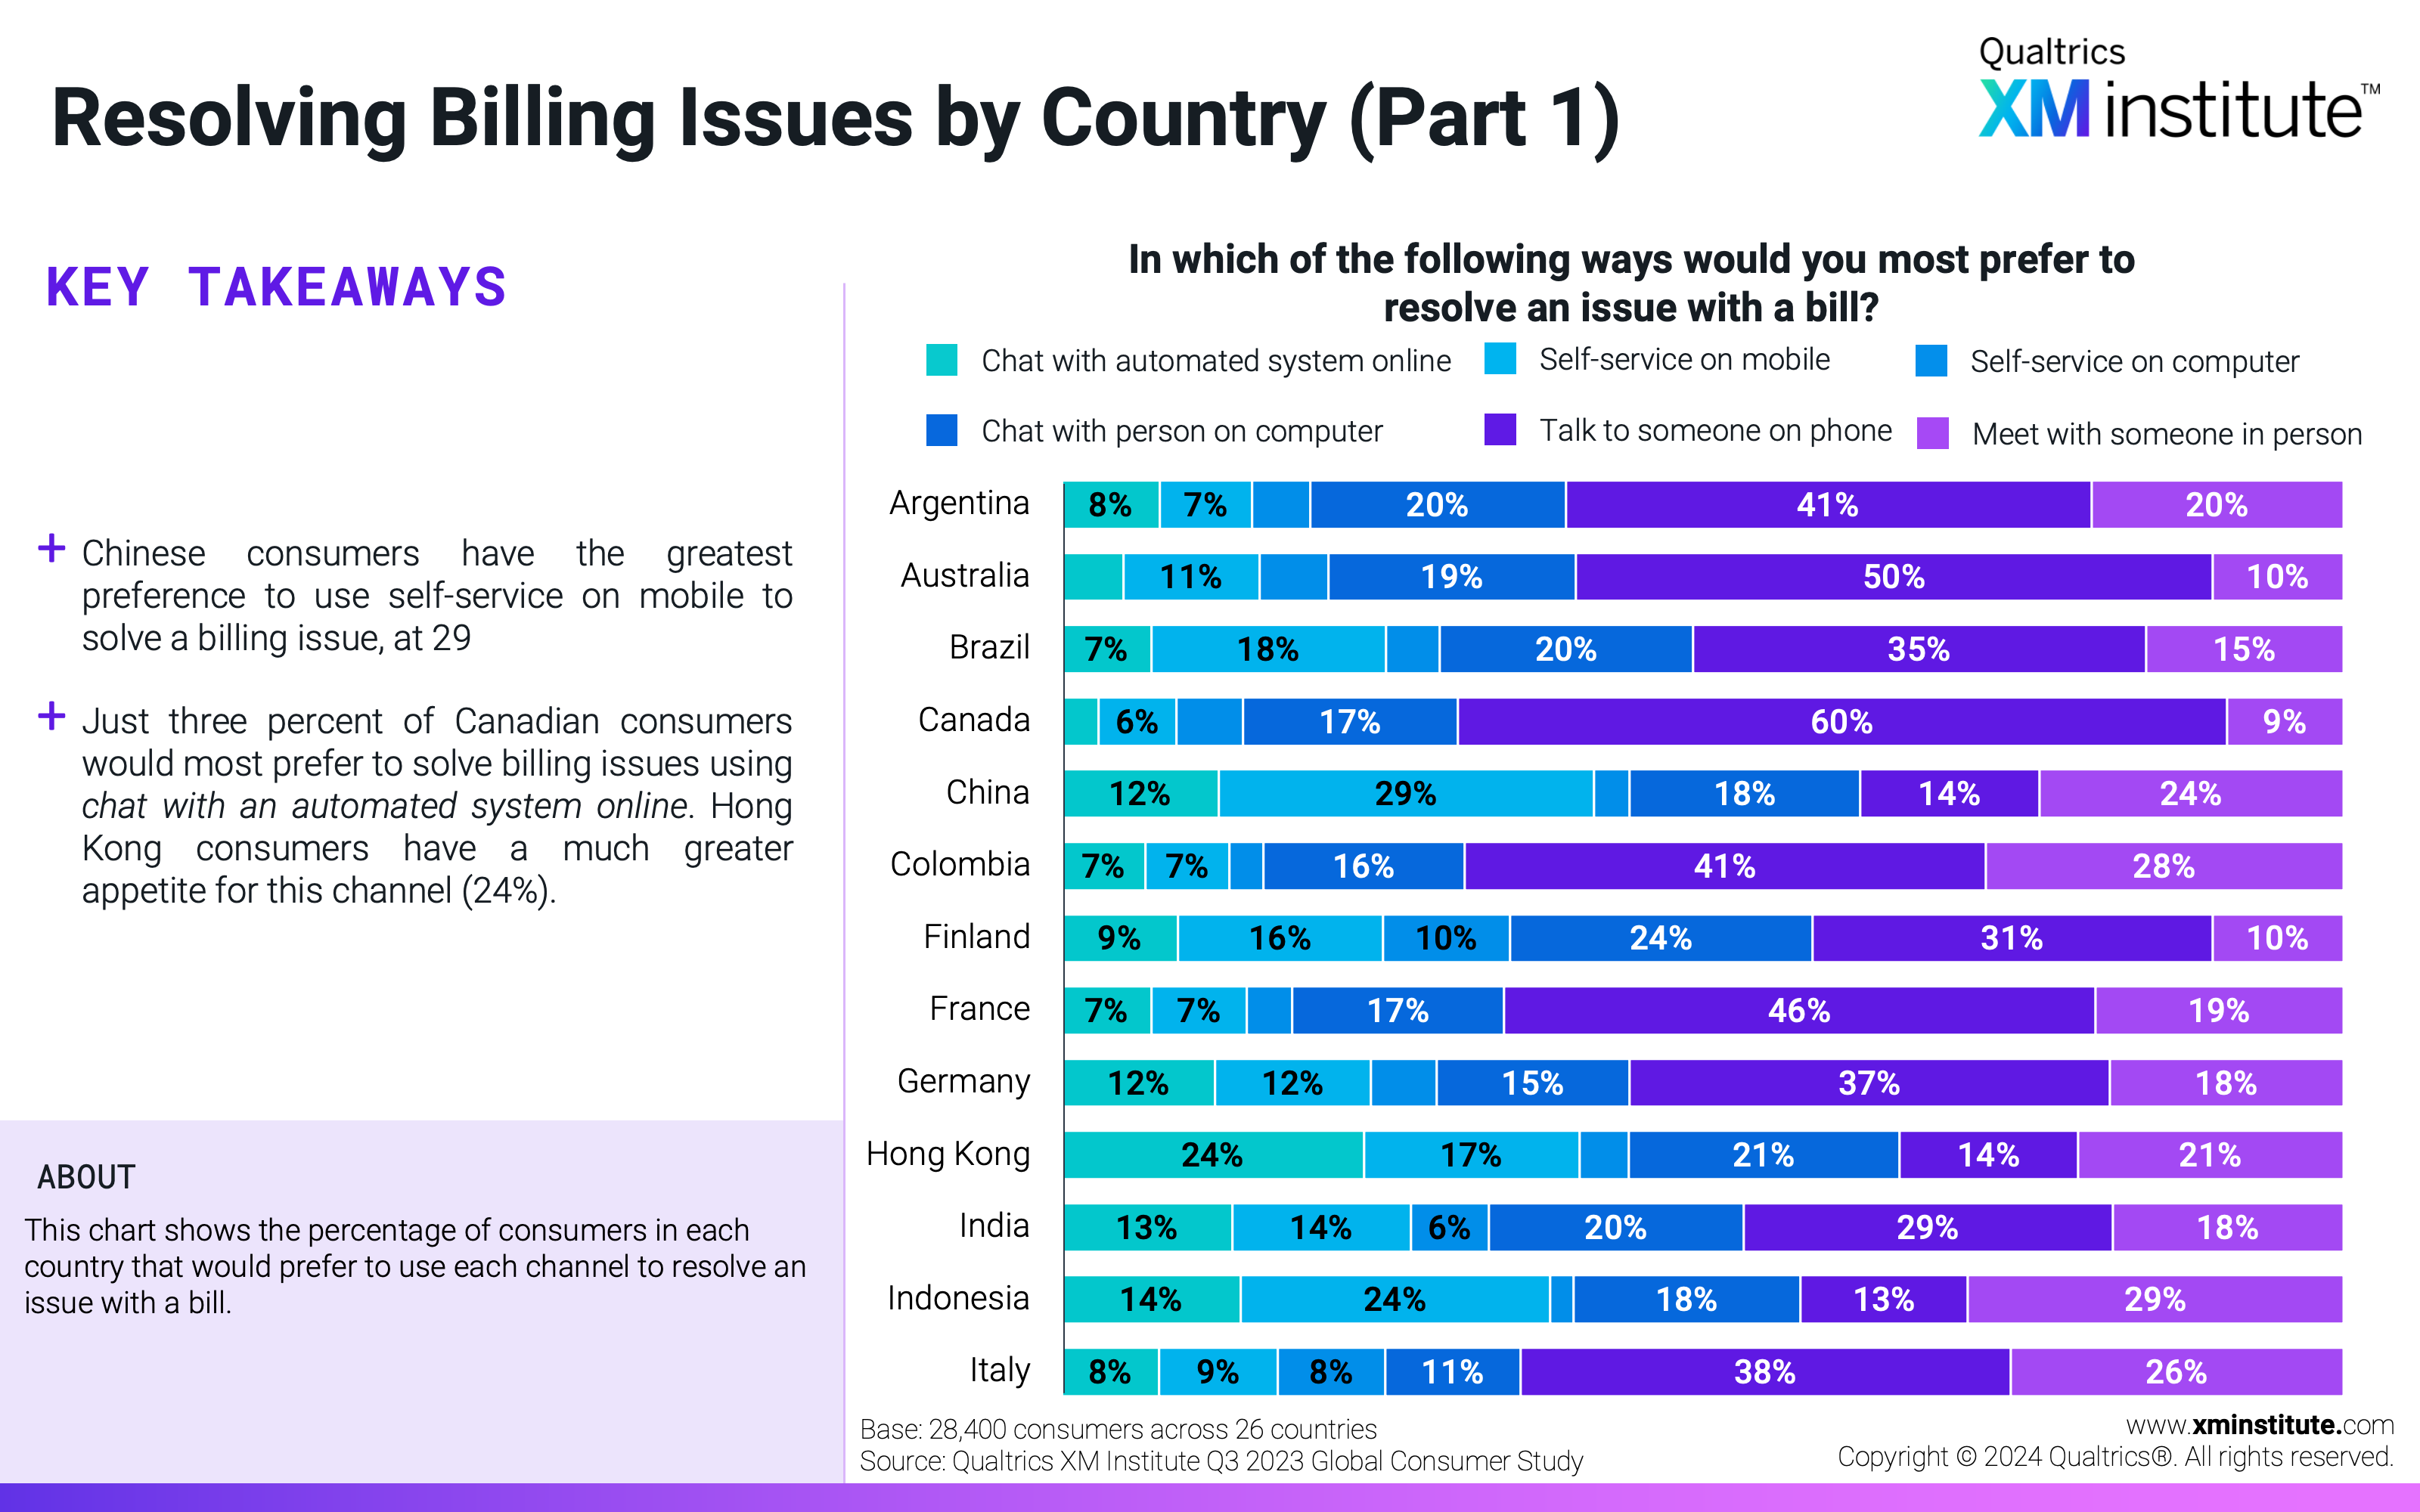
  8. Resolving Billing Issues by Country (Part 1) This chart shows the percentage of consumers in each country that would prefer to use each channel to resolve an issue with a bill.
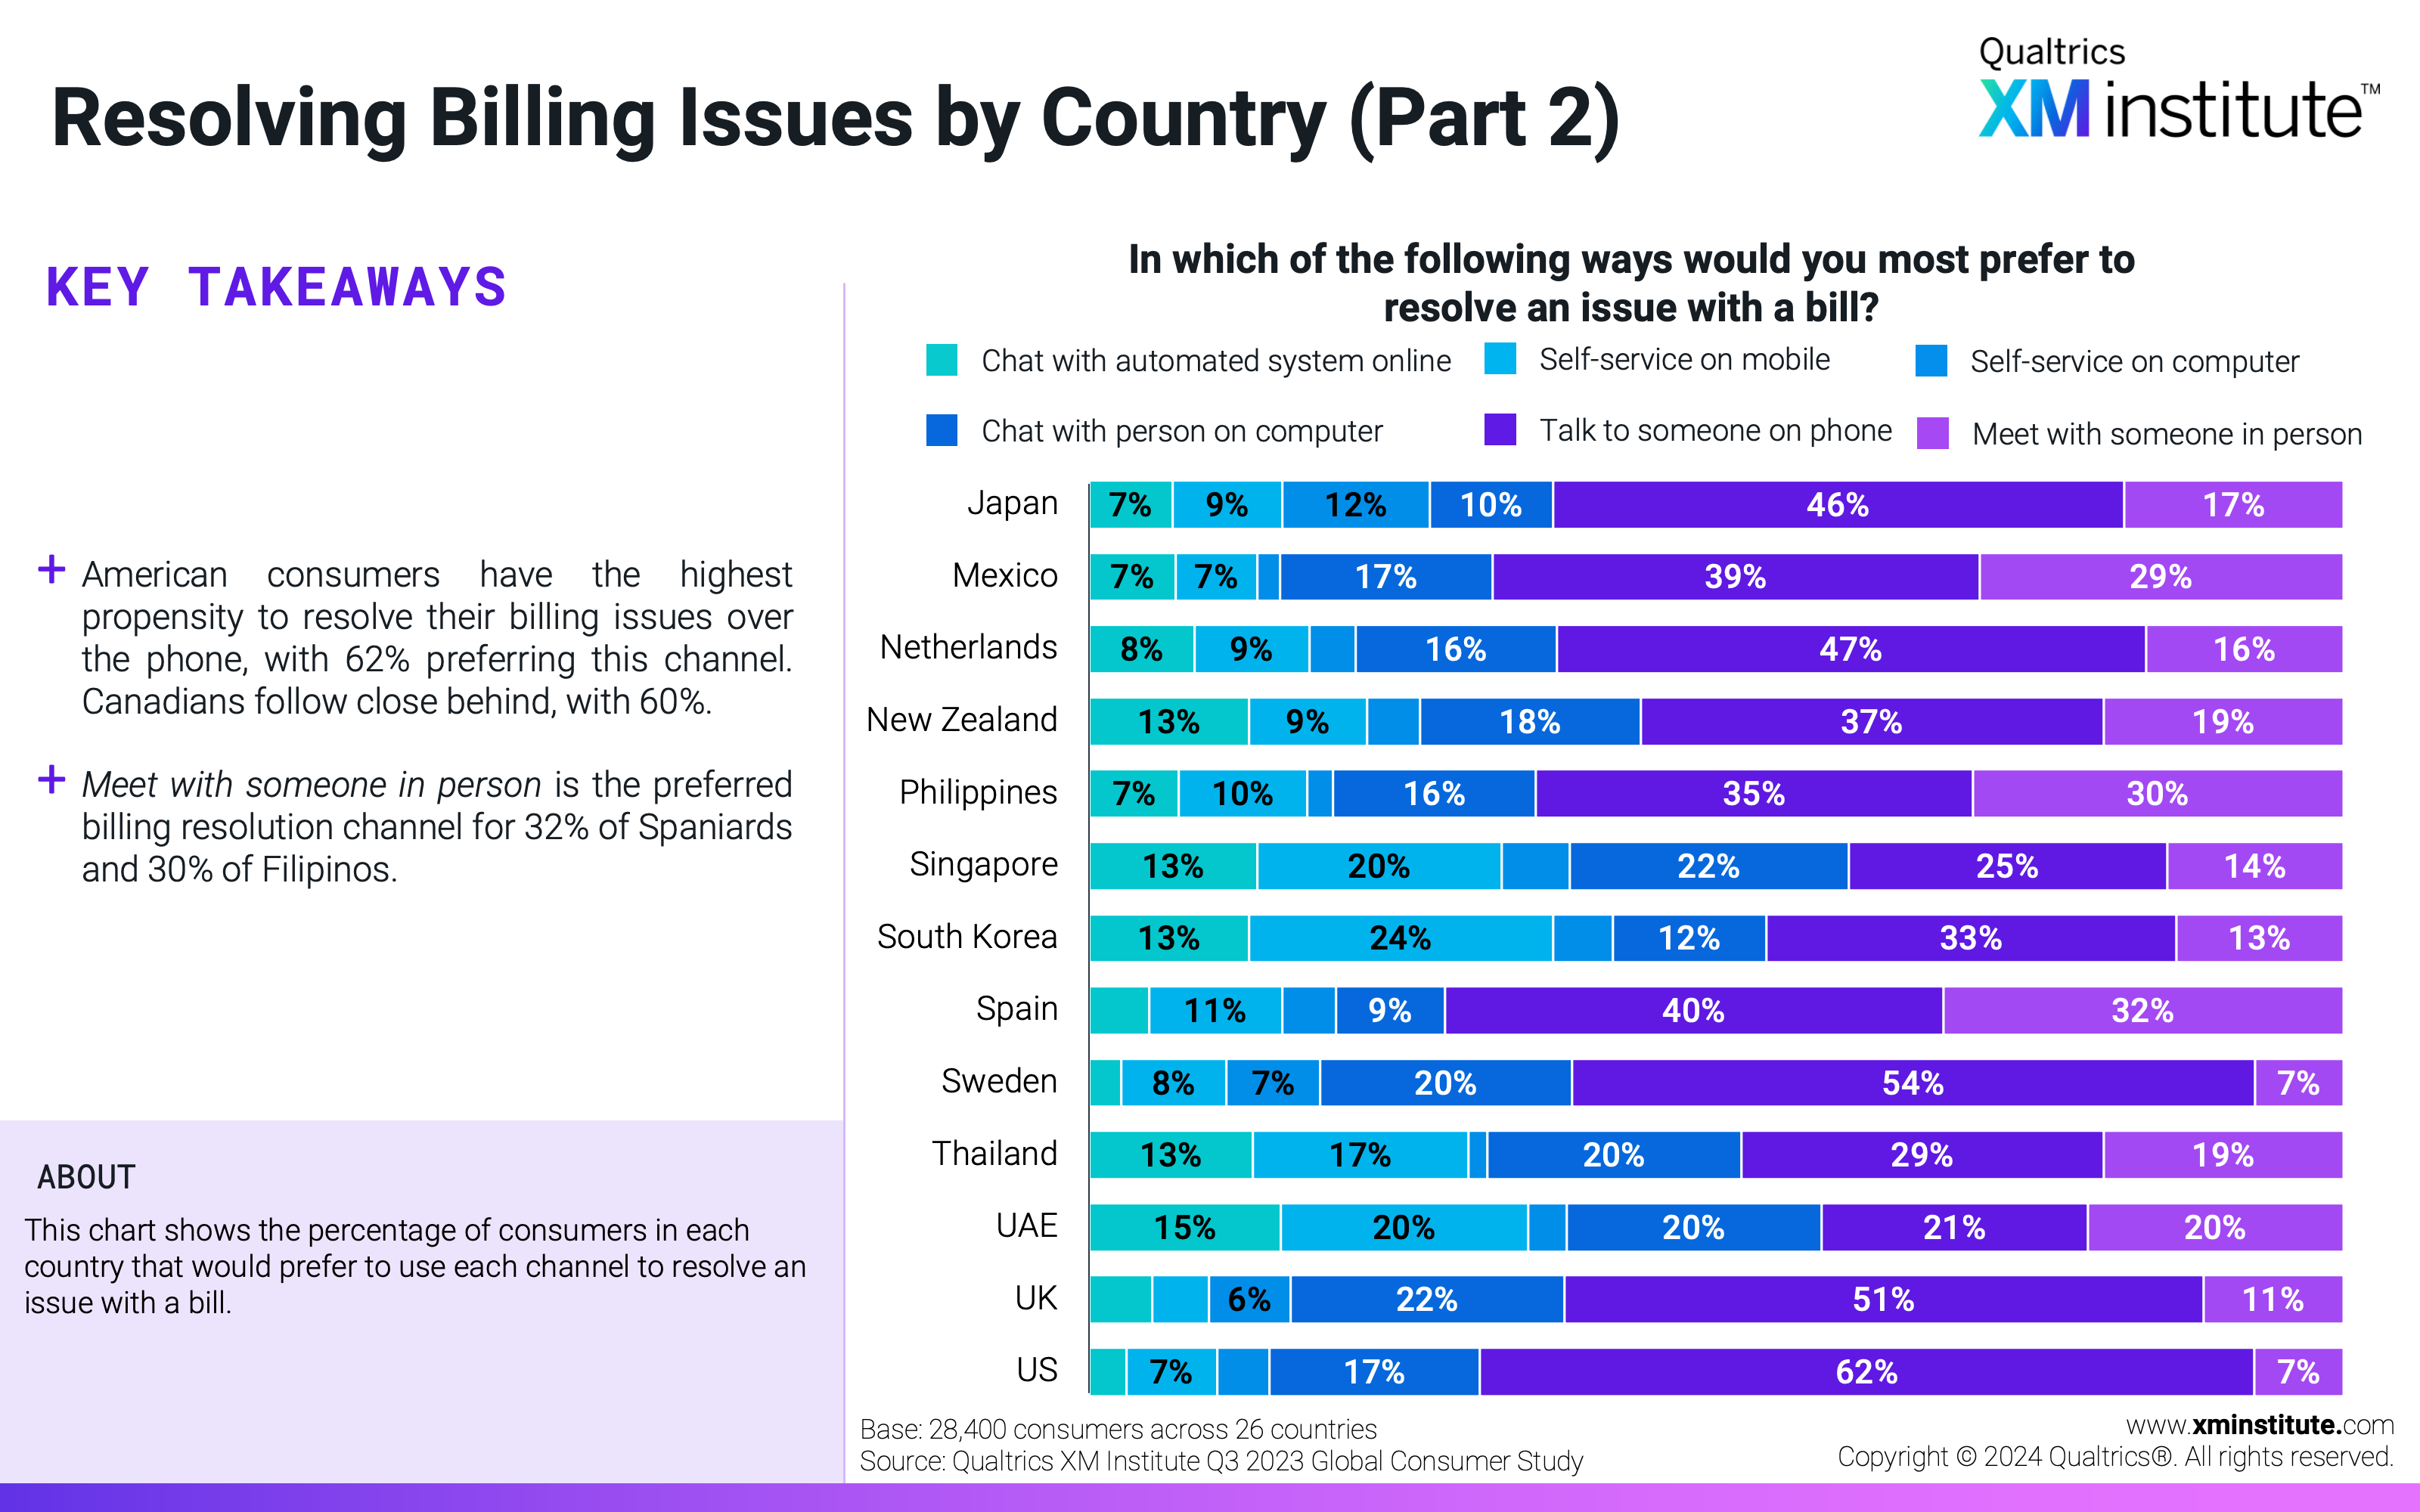
  9. Resolving Billing Issues by Country (Part 2) This chart shows the percentage of consumers in each country that would prefer to use each channel to resolve an issue with a bill.
  10. Booking a Plane Ticket by Age This chart shows the percentage of consumers of each age on average across all countries that would prefer to use each channel to book an airline ticket.
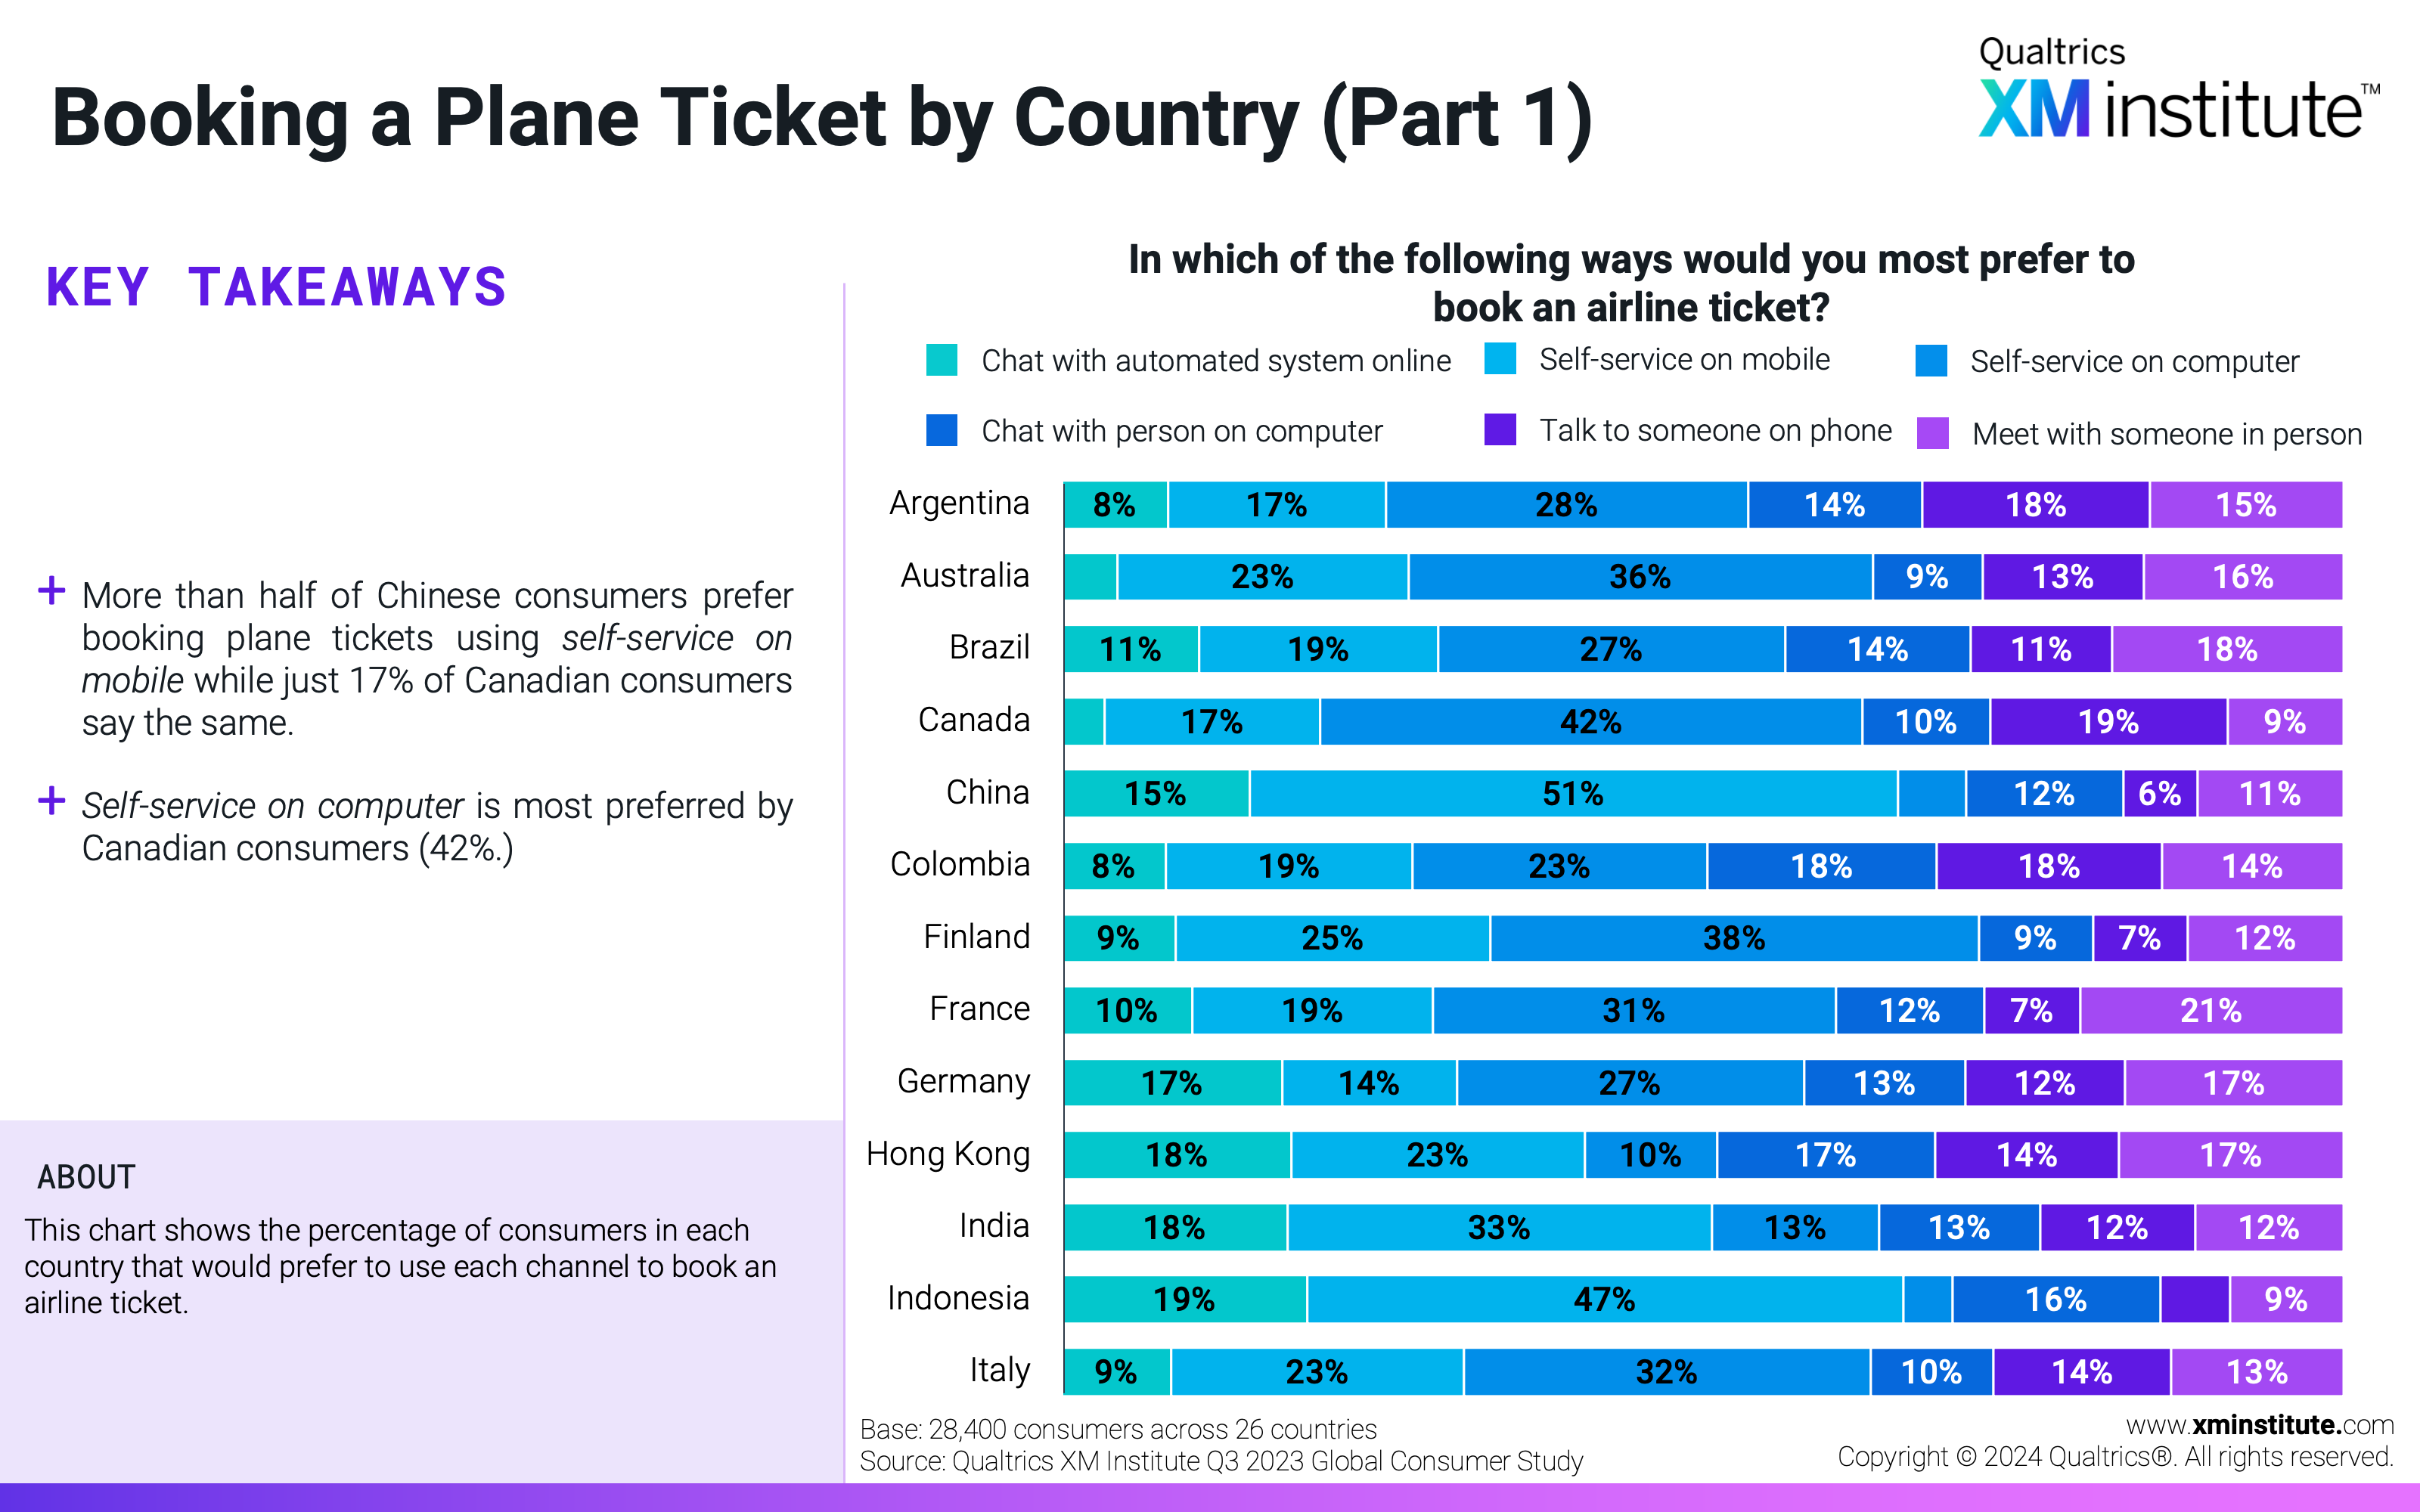
  11. Booking a Plane Ticket by Country (Part 1) This chart shows the percentage of consumers in each country that would prefer to use each channel to book an airline ticket.
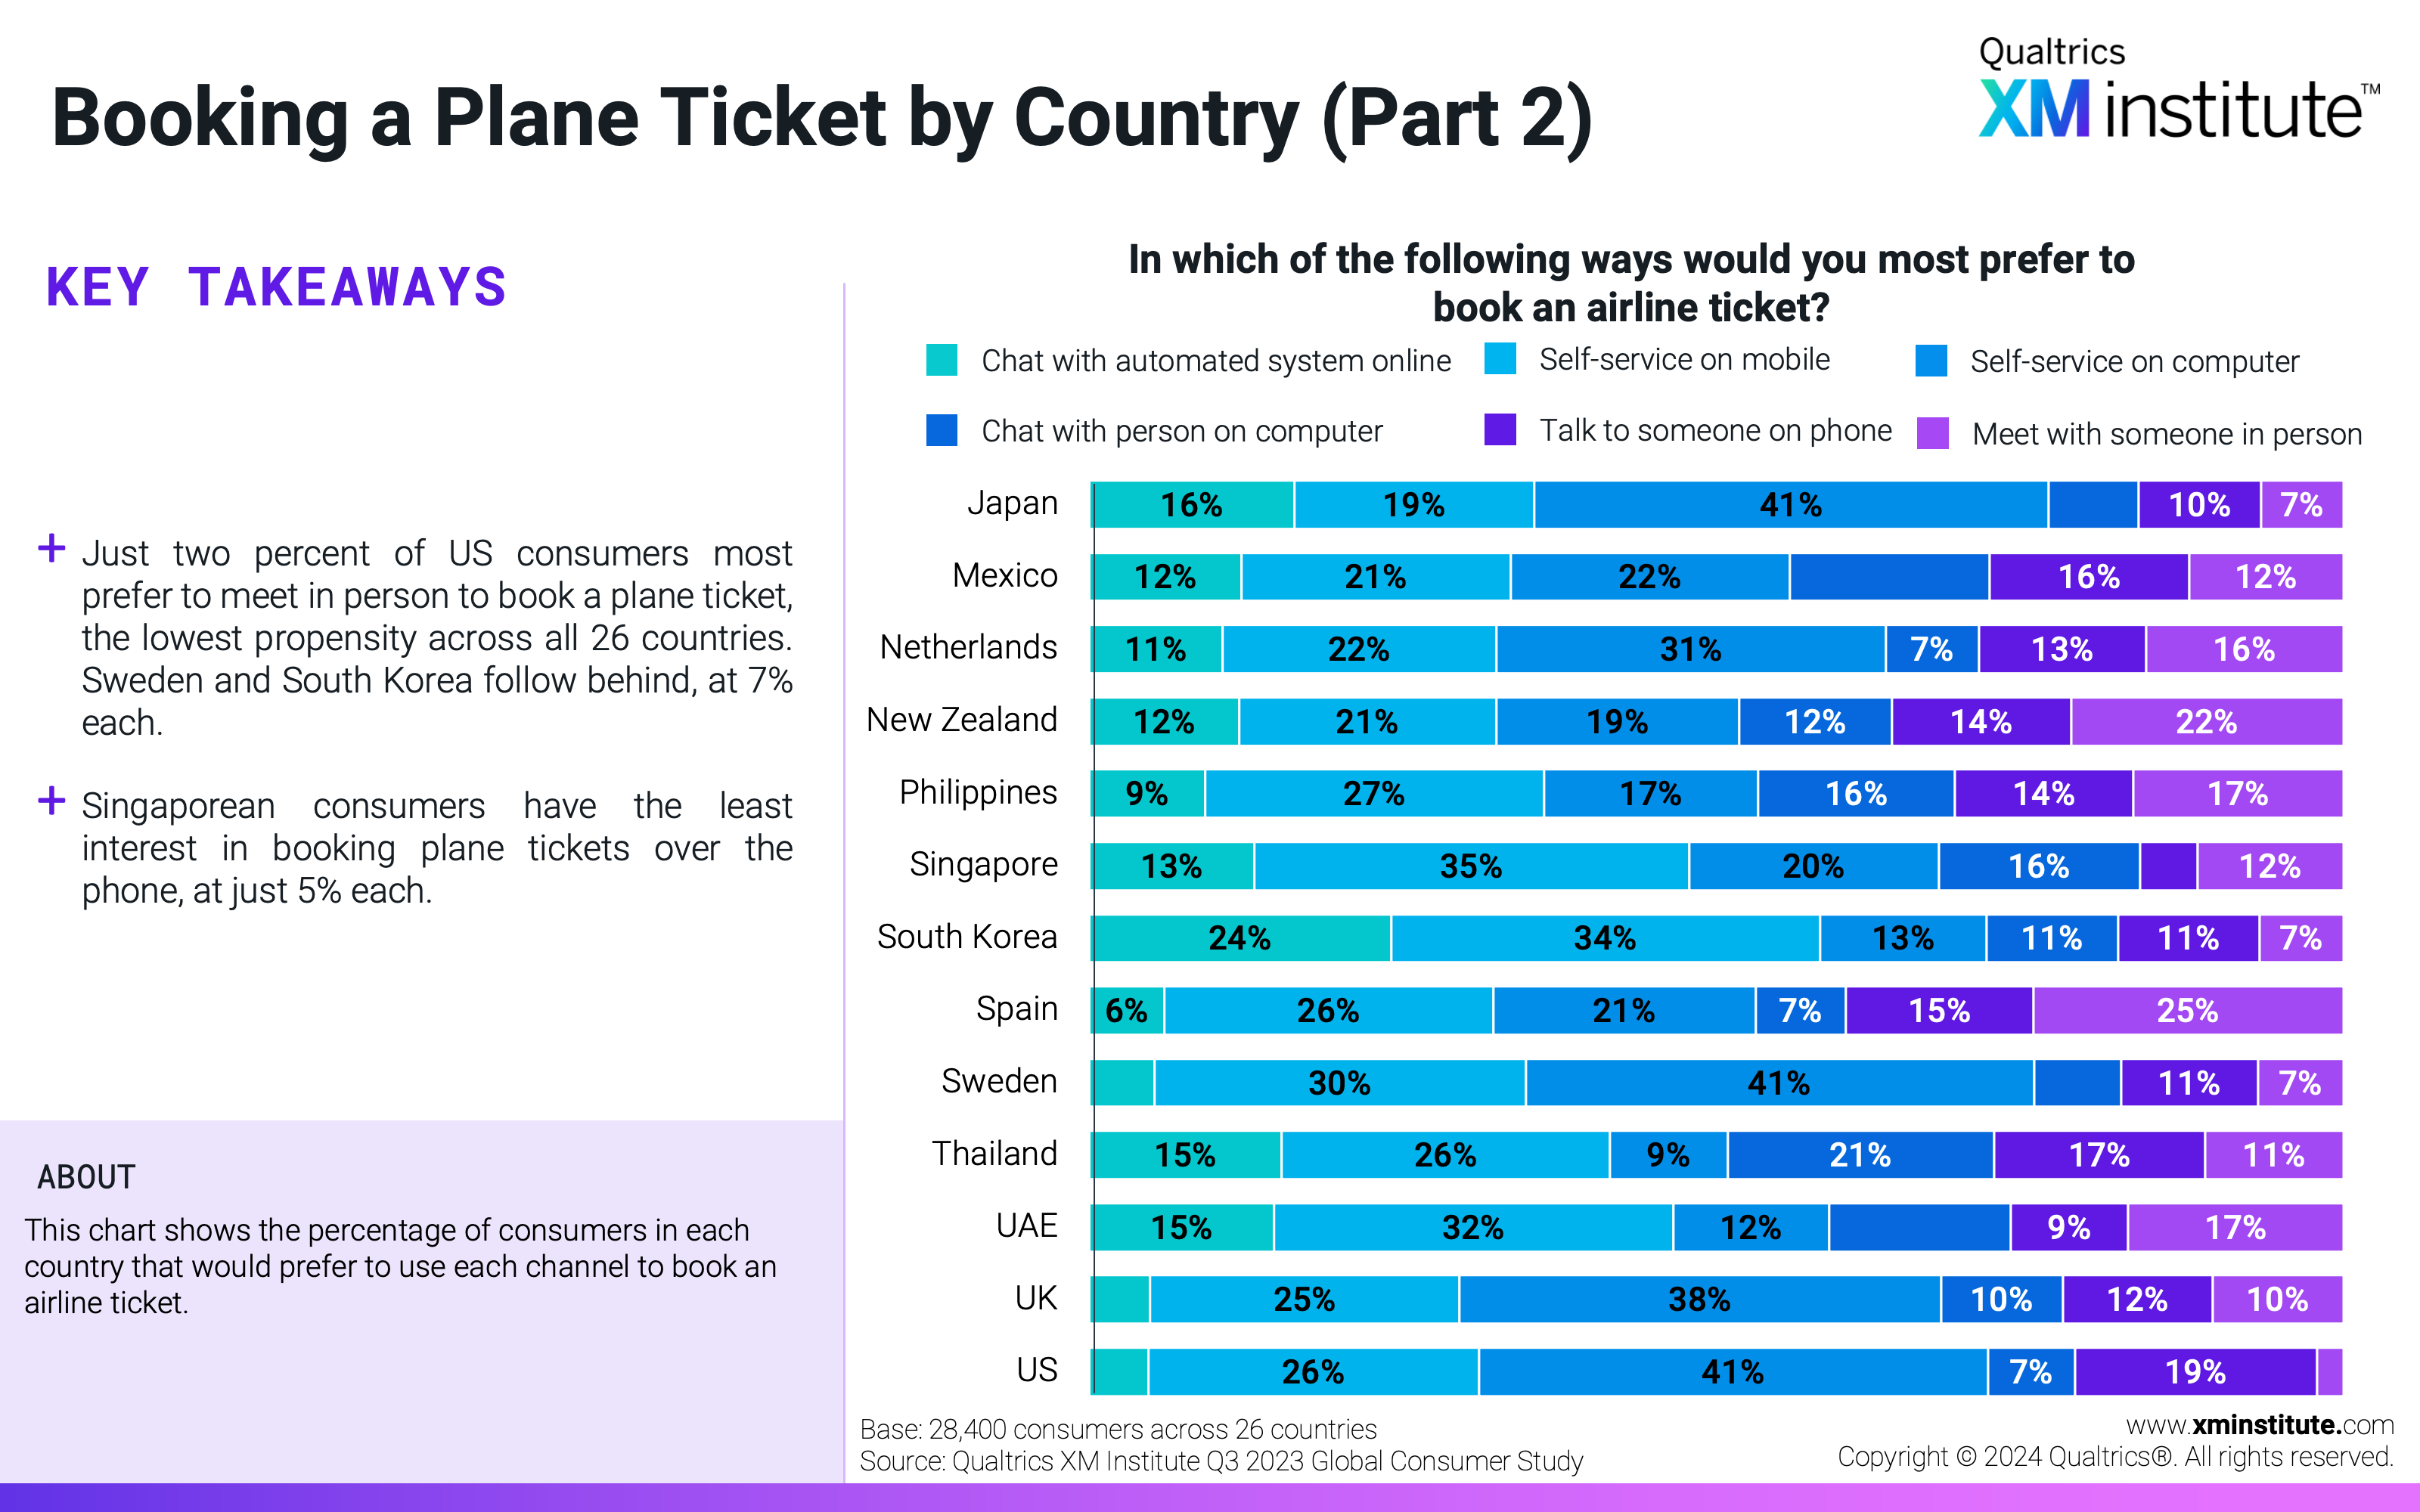
  12. Booking a Plane Ticket by Country (Part 2)
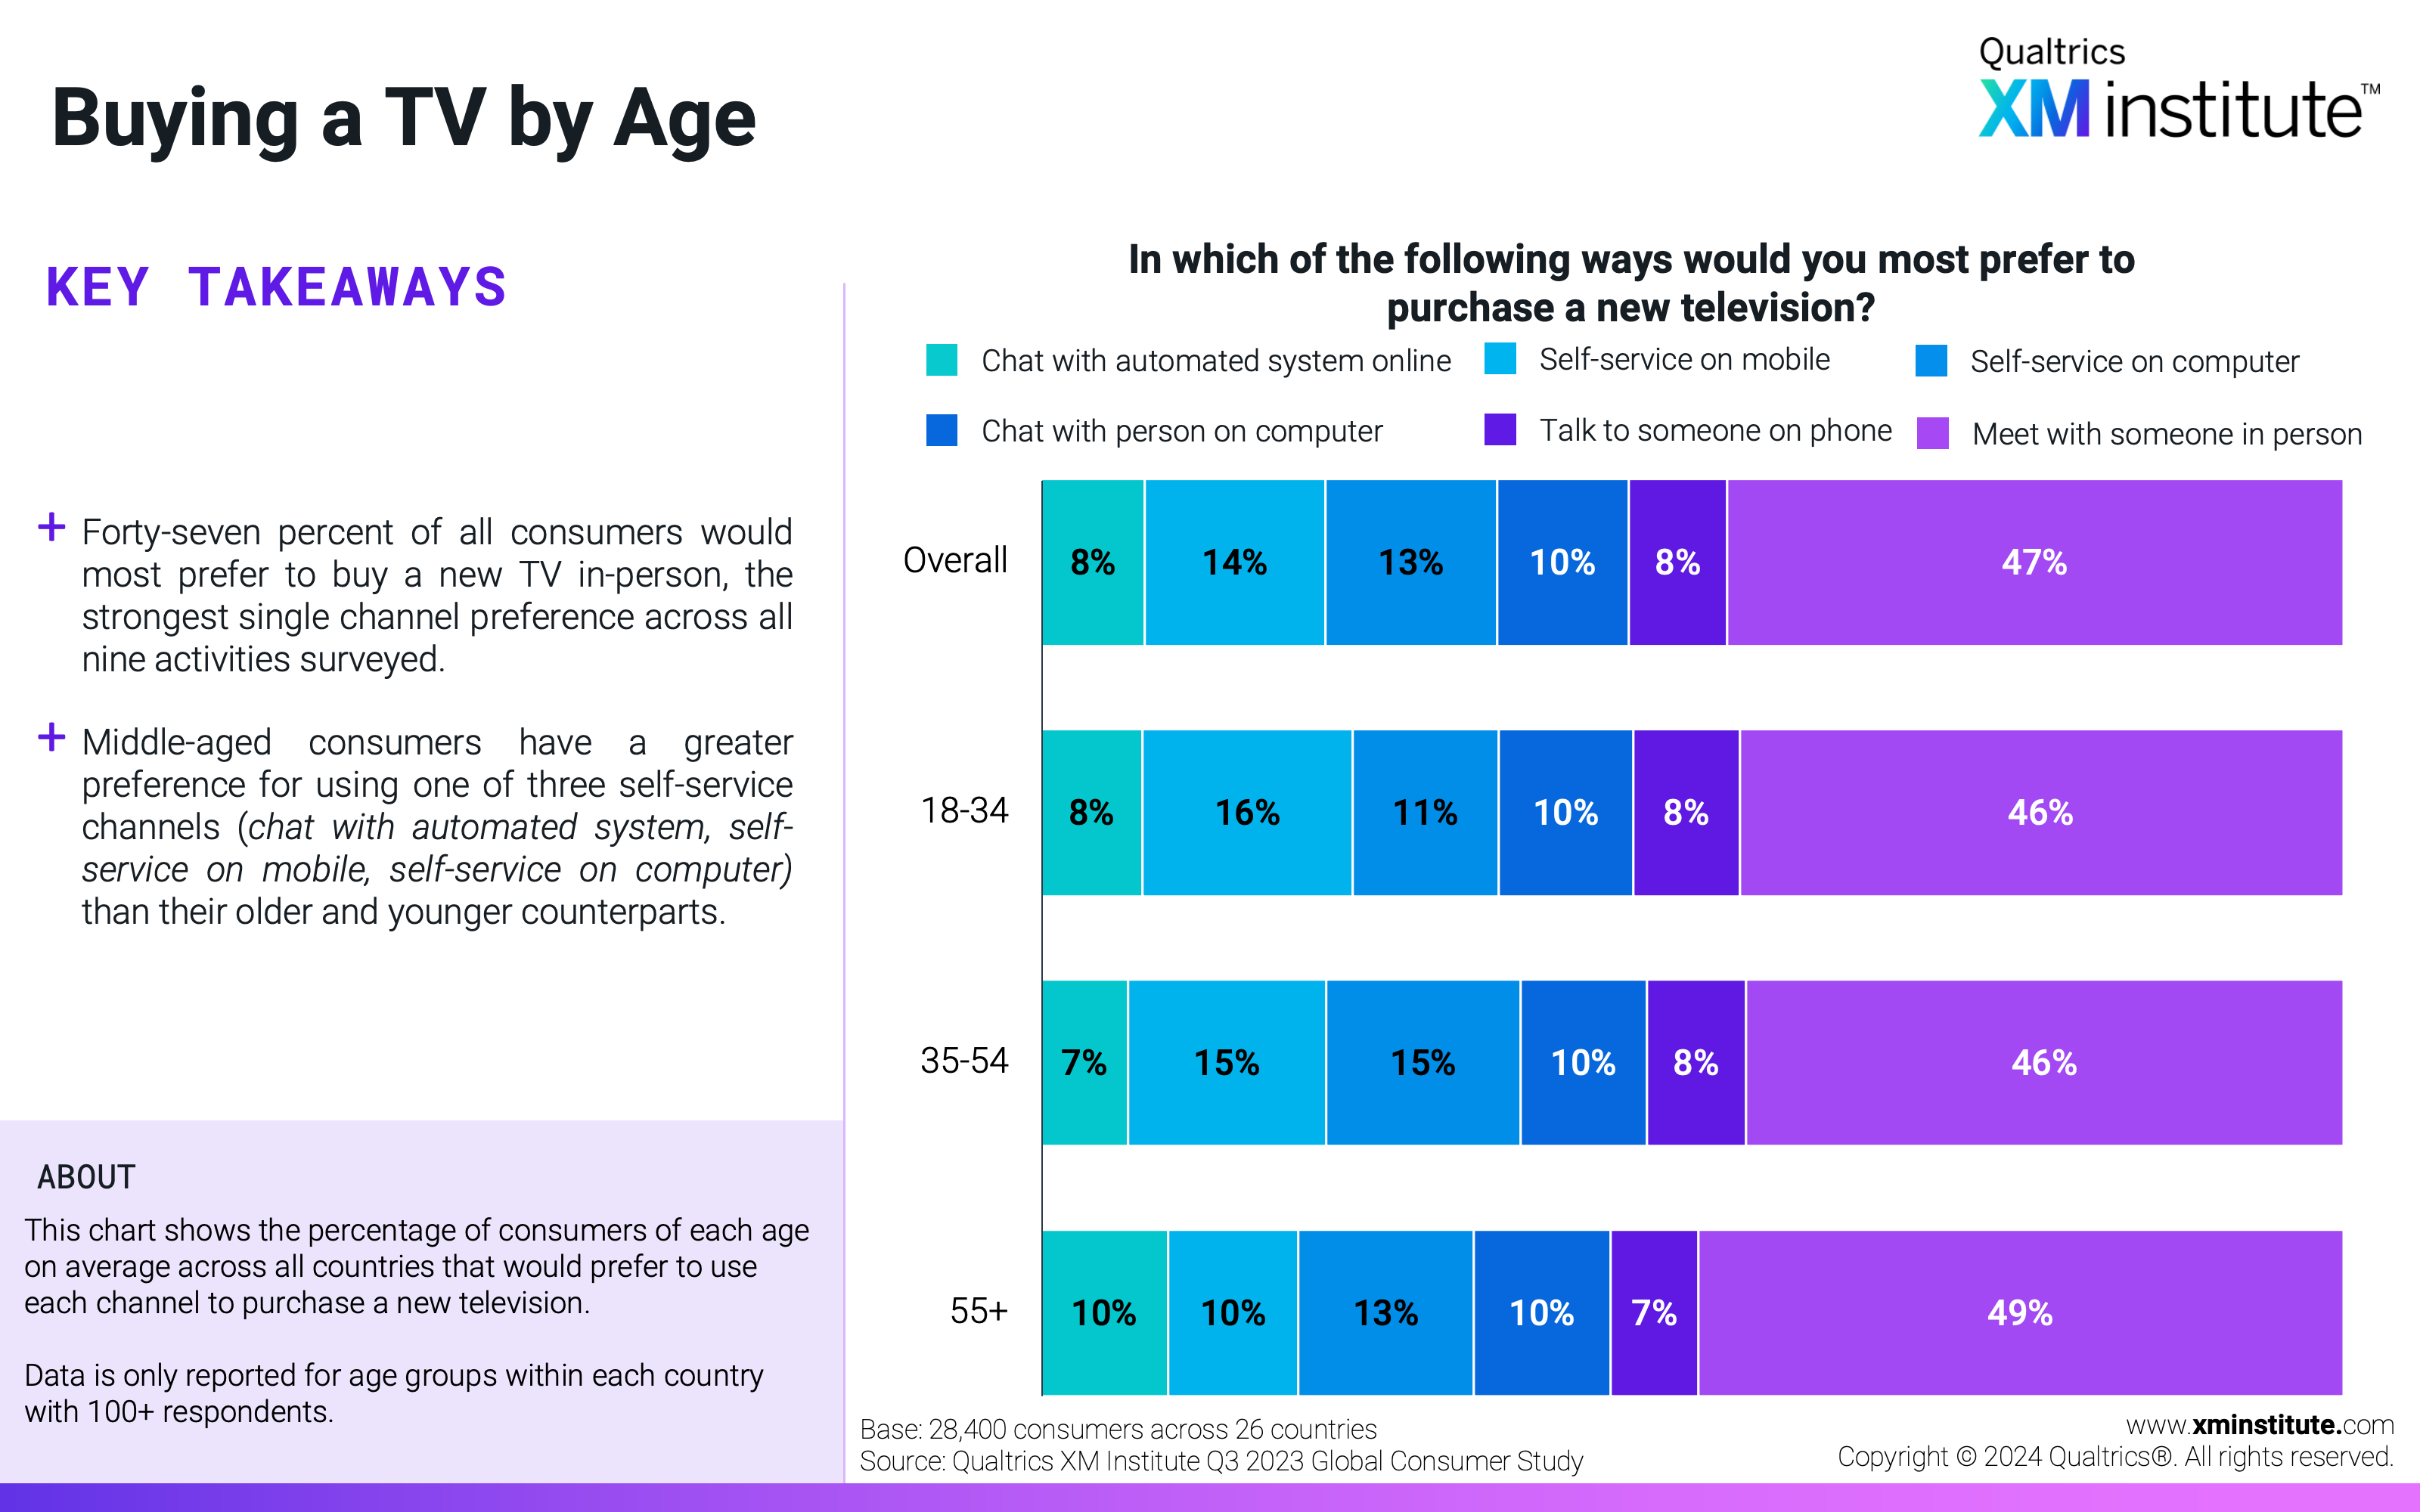
 This chart shows the percentage of consumers in each country that would prefer to use each channel to book an airline ticket.
  13. Buying a TV by Age This chart shows the percentage of consumers of each age on average across all countries that would prefer to use each channel to purchase a new television.
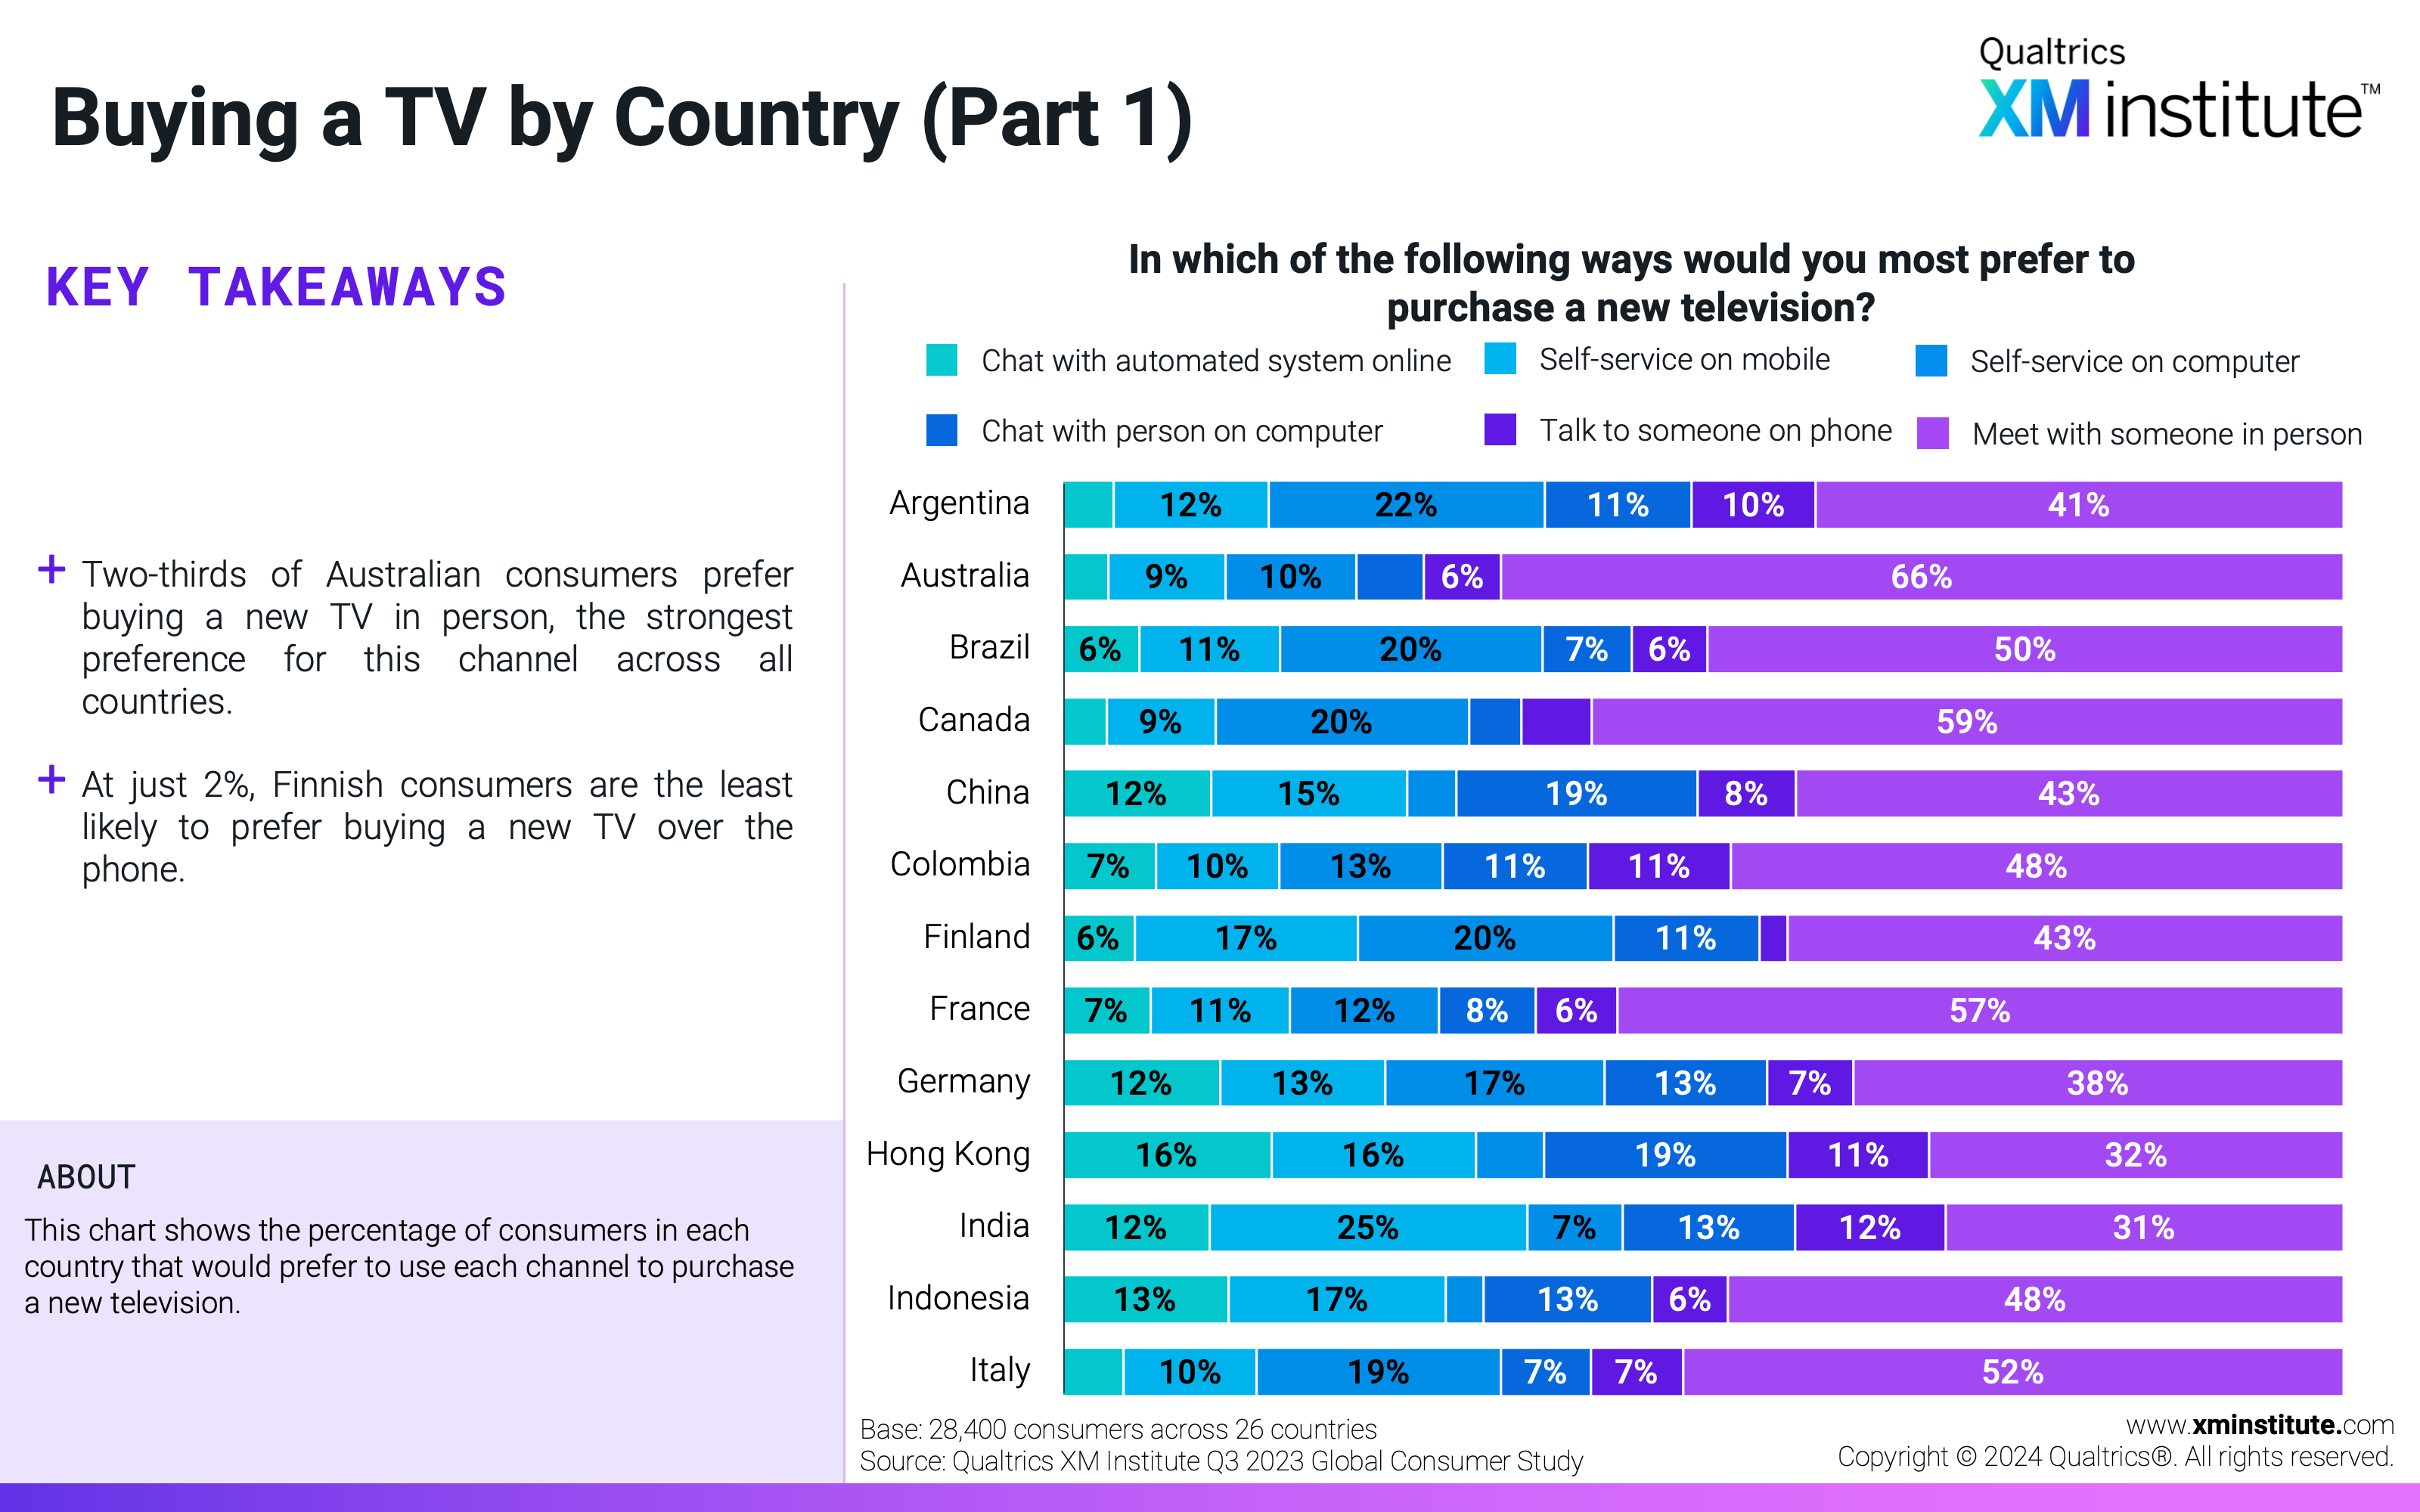
  14. Buying a TV by Country (Part 1) This chart shows the percentage of consumers in each country that would prefer to use each channel to purchase a new television.
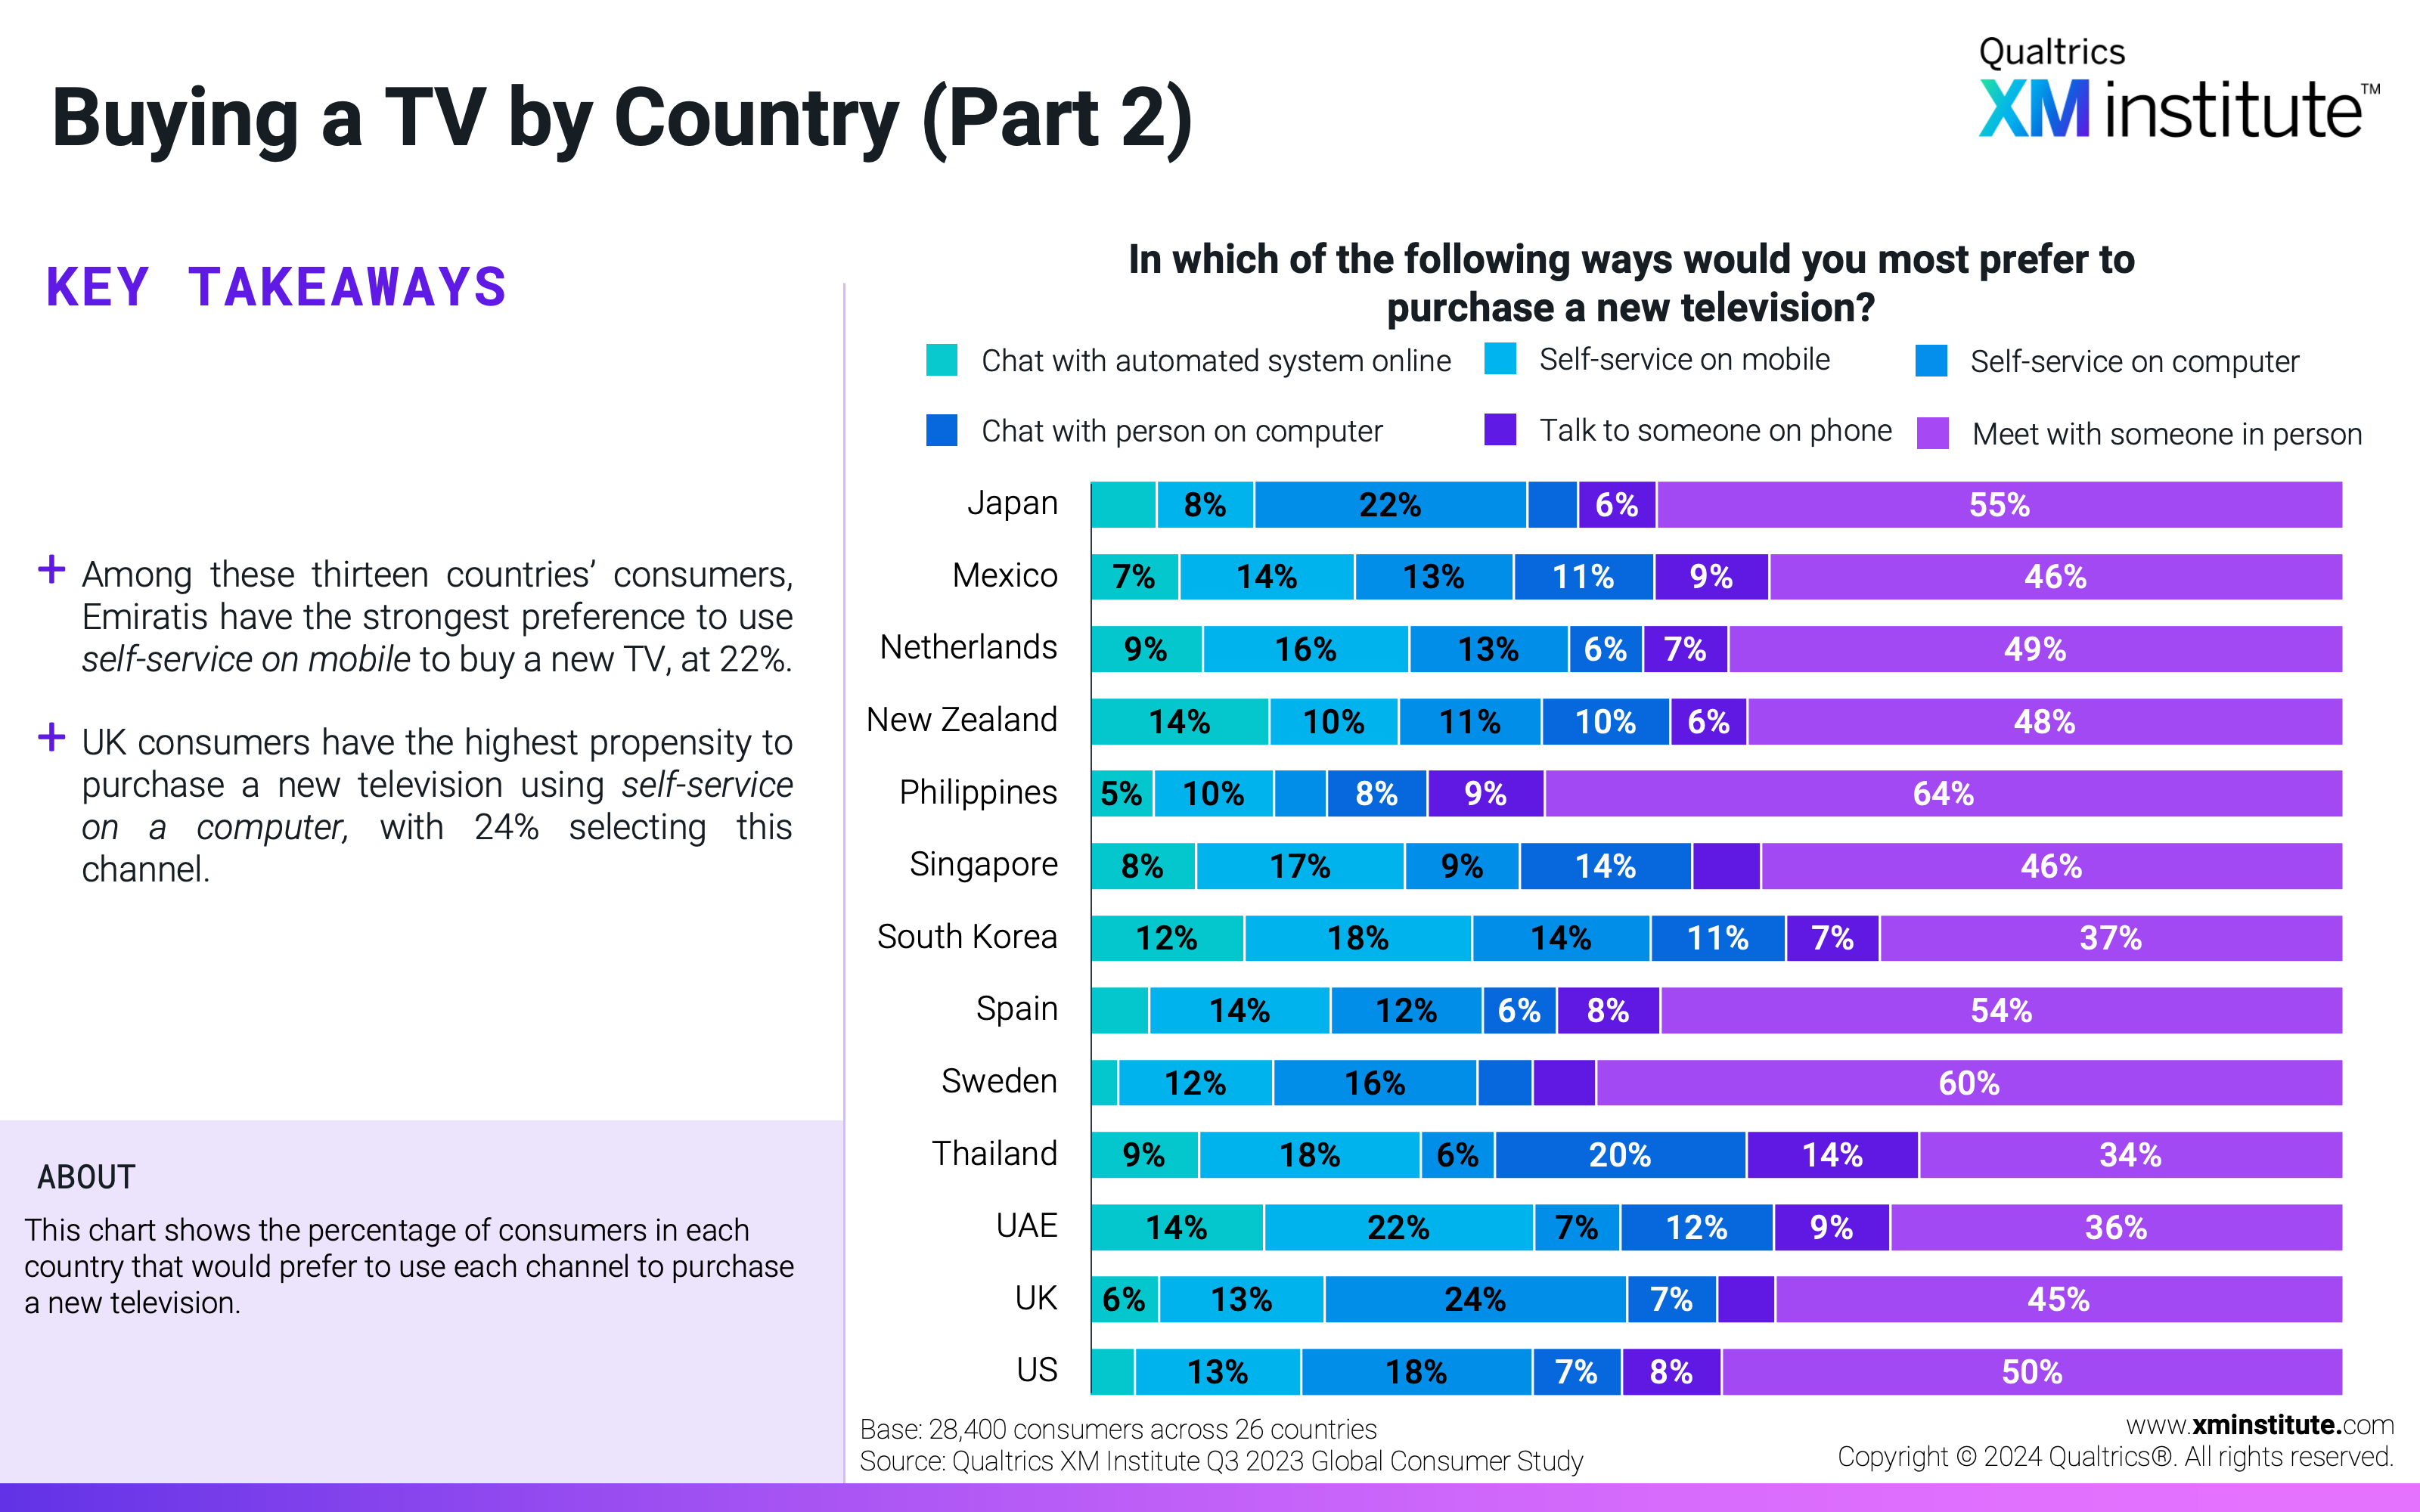
  15. Buying a TV by Country (Part 2) This chart shows the percentage of consumers in each country that would prefer to use each channel to purchase a new television.
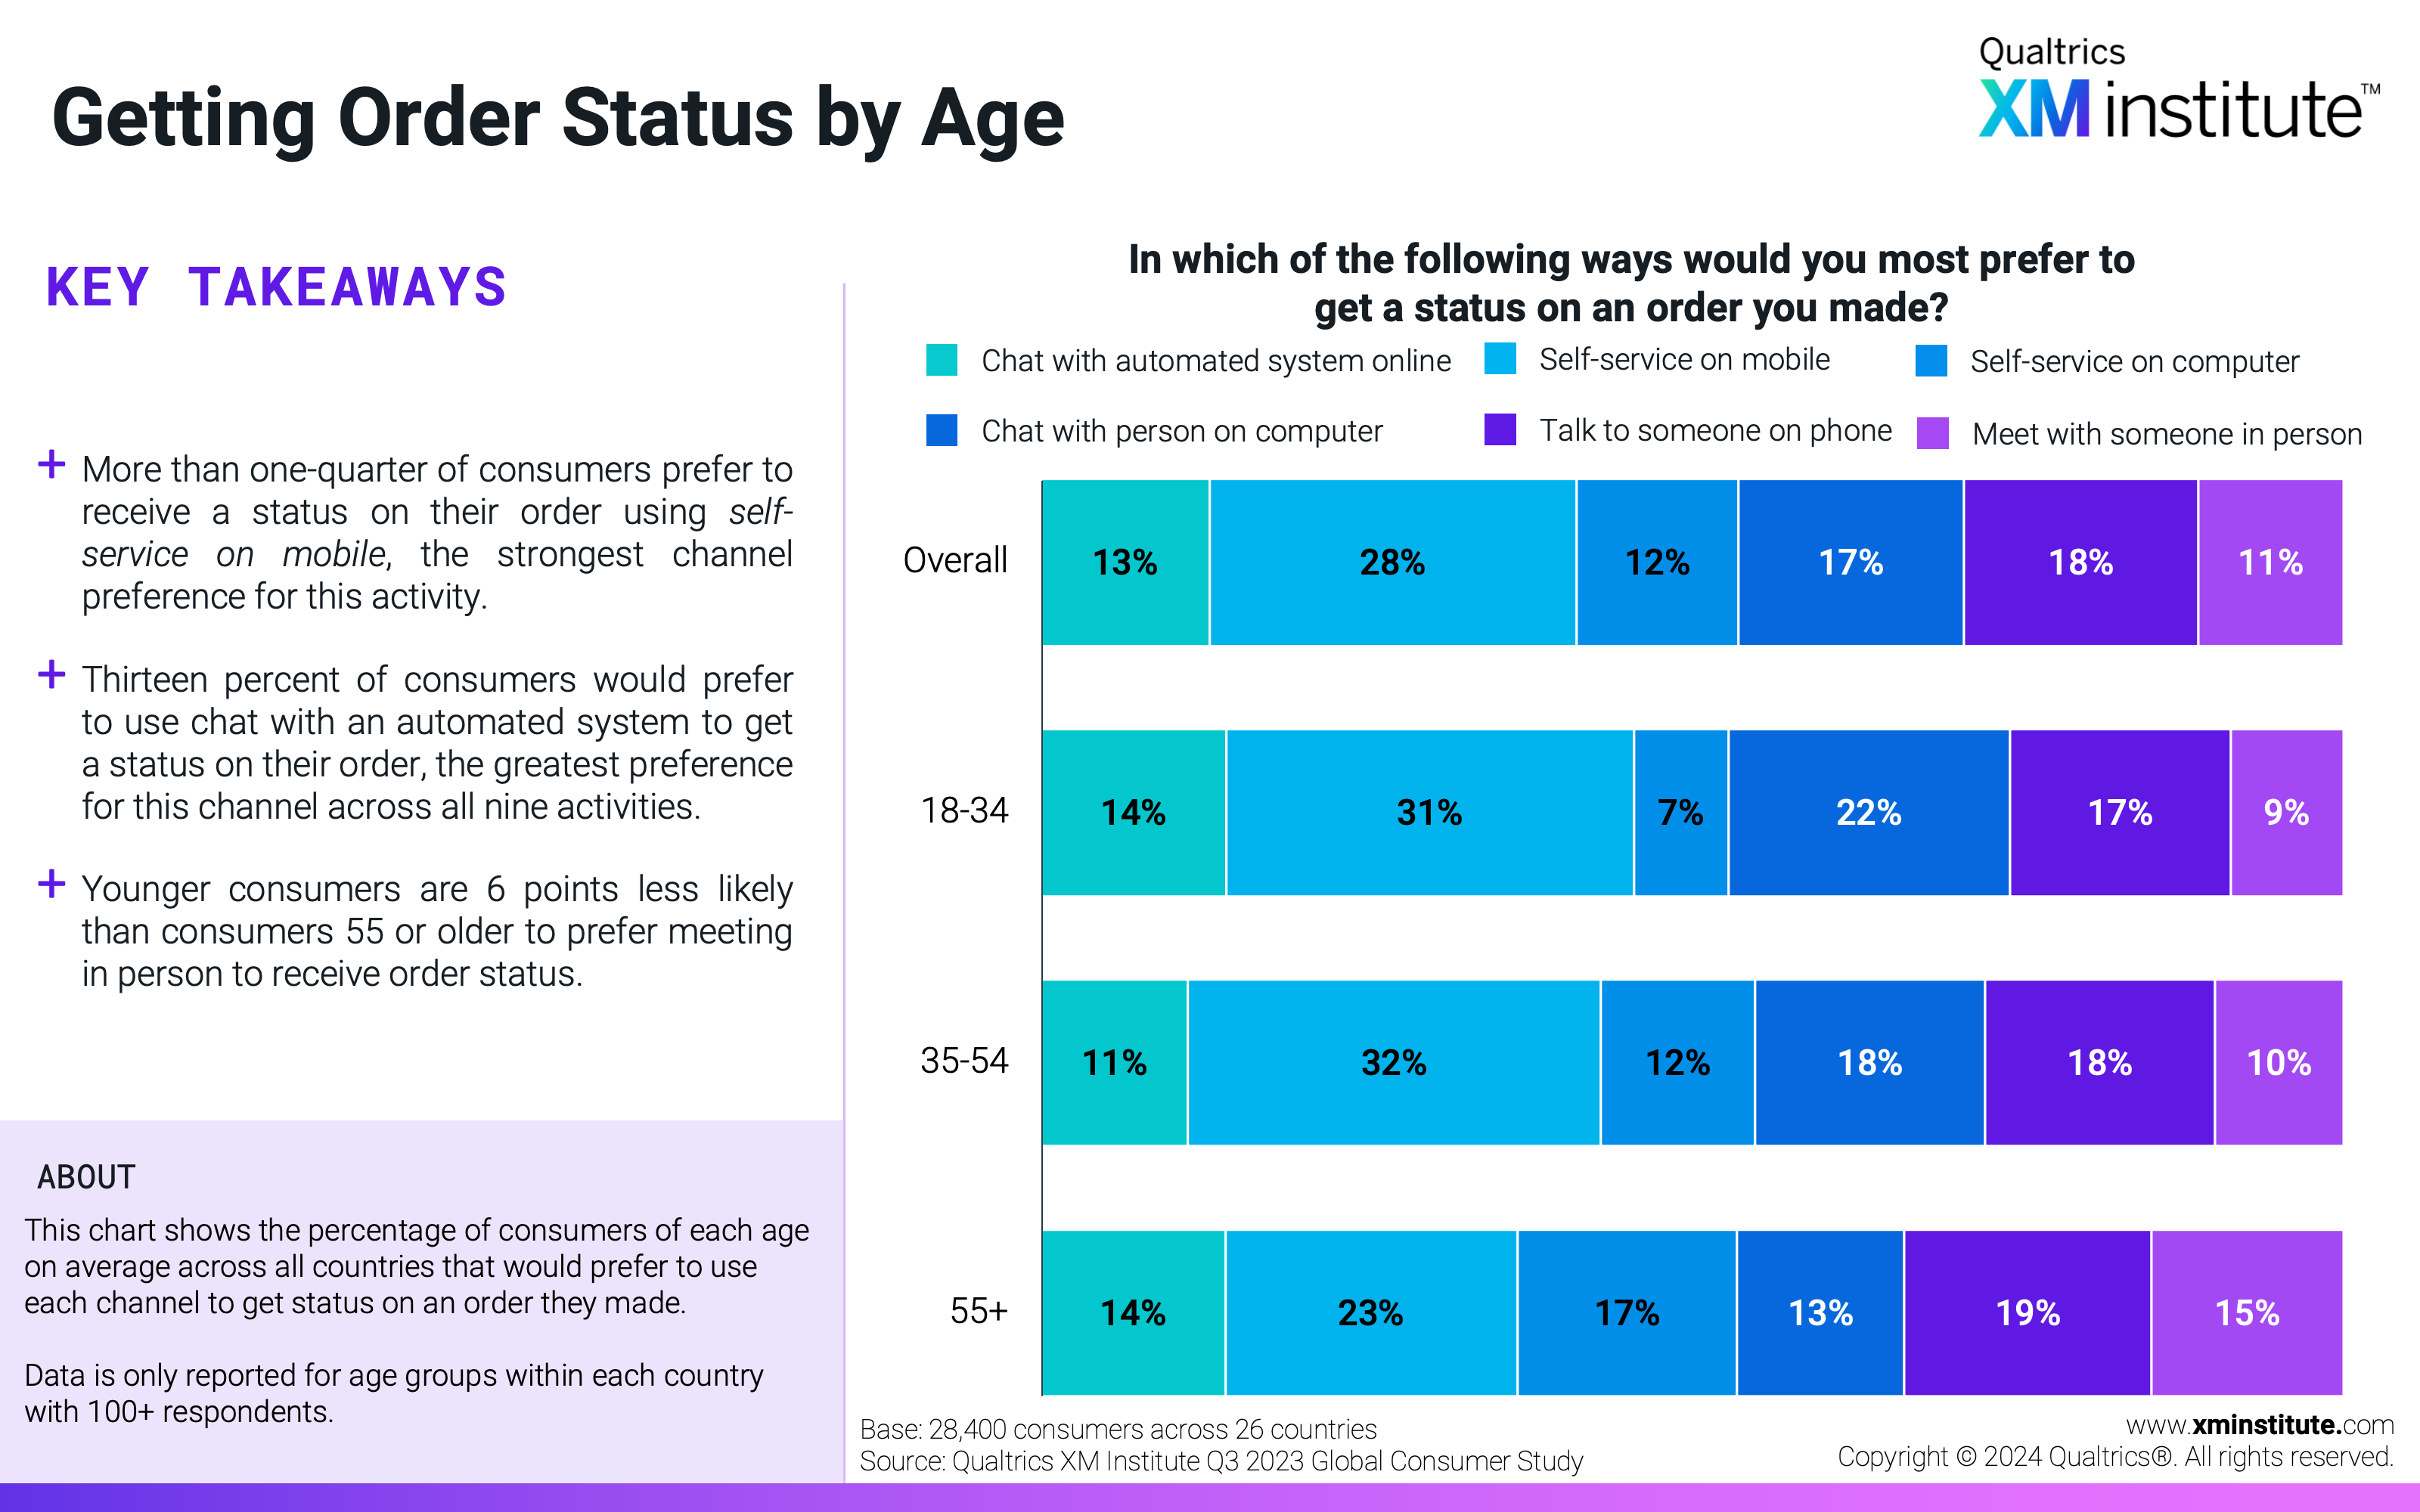
  16. Getting Order Status by Age This chart shows the percentage of consumers of each age on average across all countries that would prefer to use each channel to get status on an order they made.
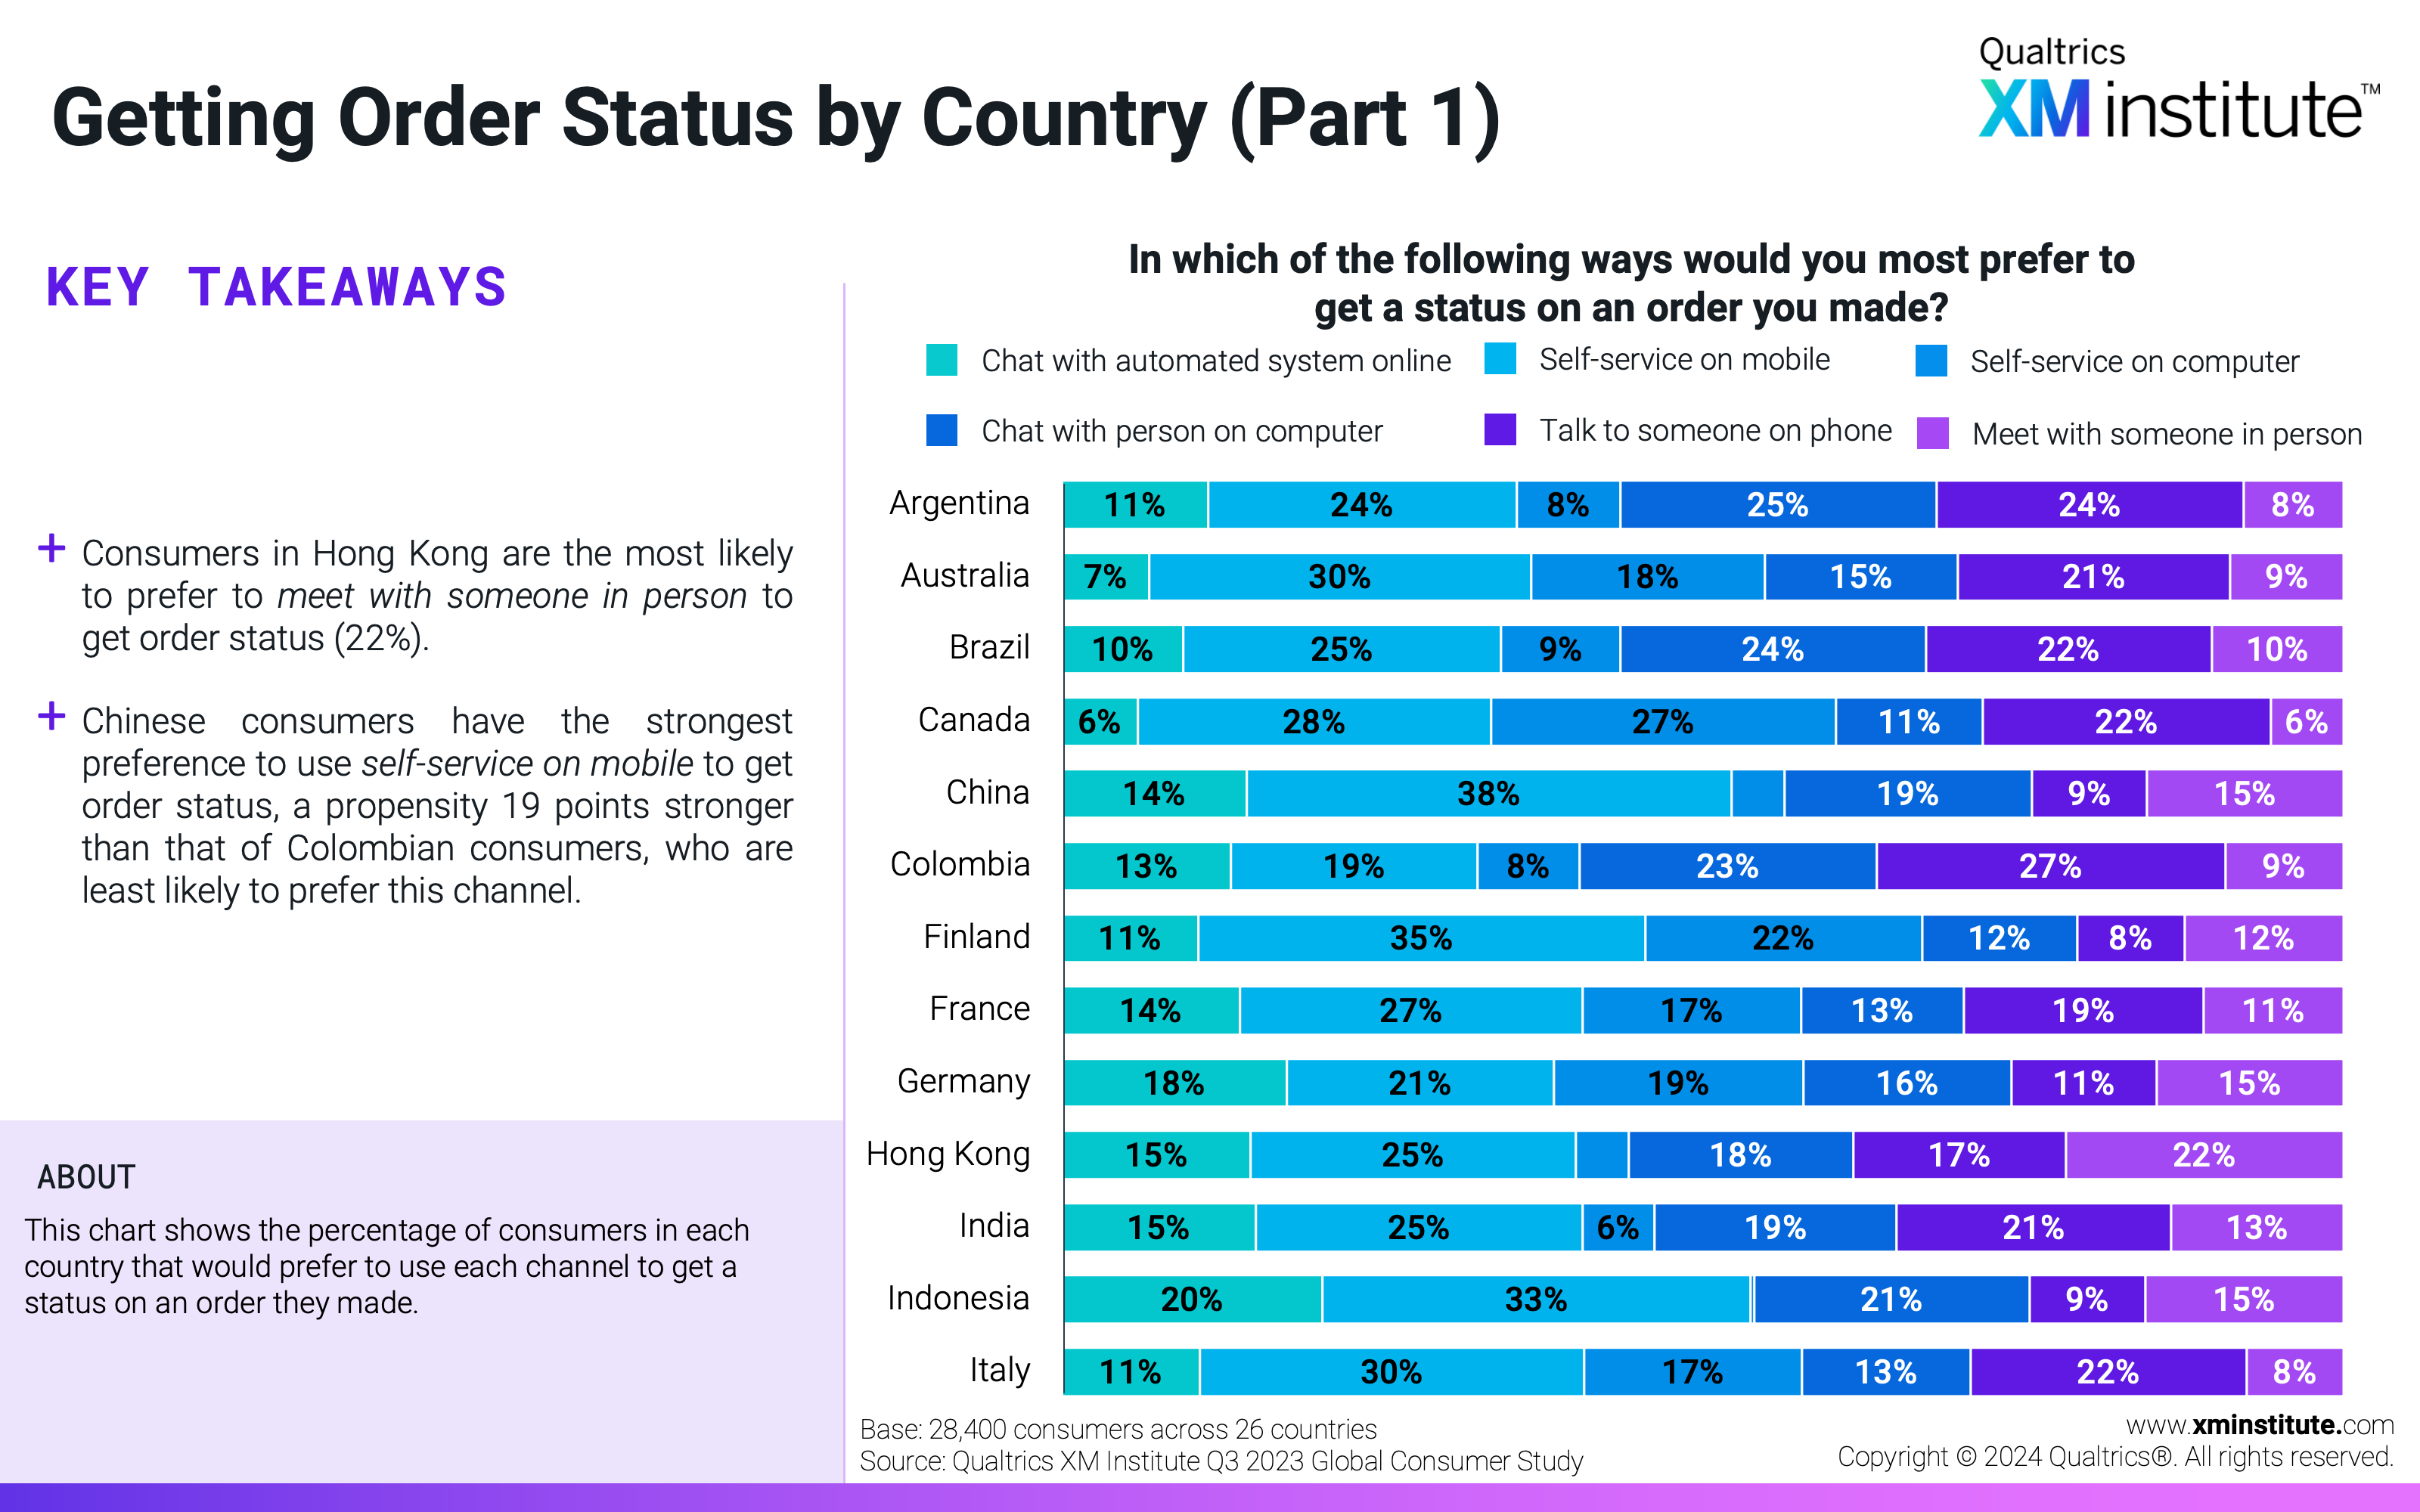
  17. Getting Order Status by Country (Part 1) This chart shows the percentage of consumers in each country that would prefer to use each channel to get a status on an order they made.
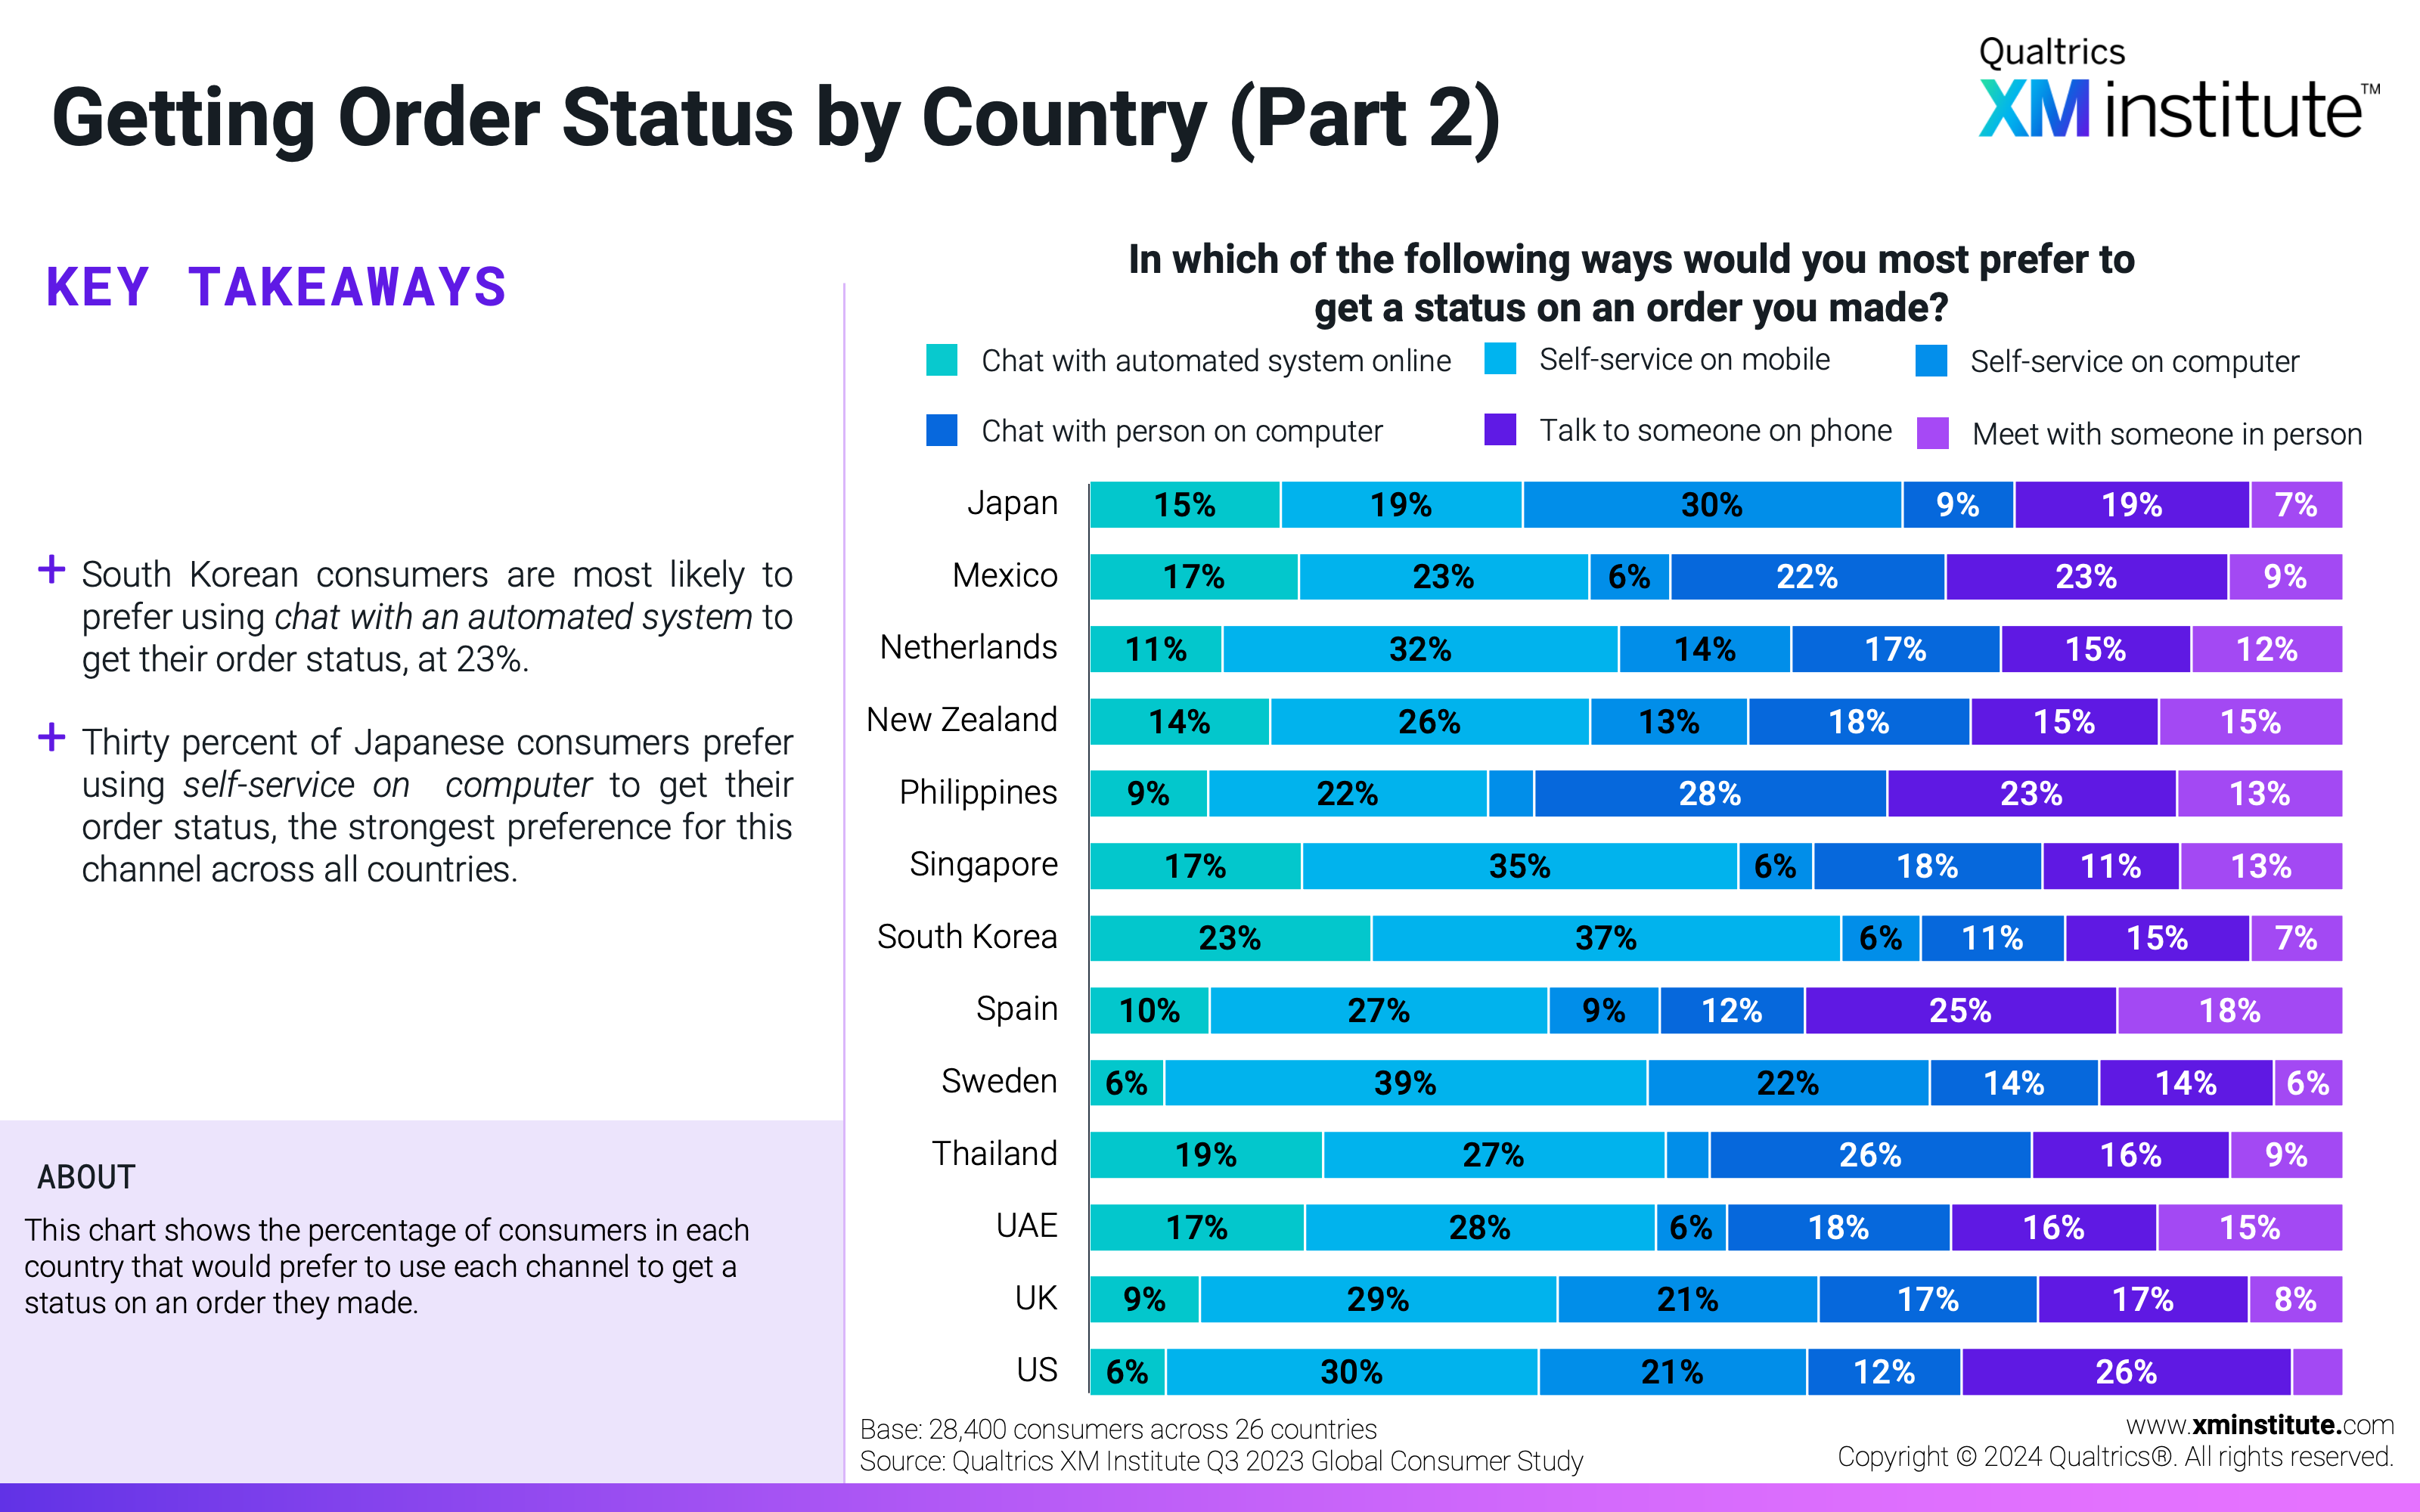
  18. Getting Order Status by Country (Part 2) This chart shows the percentage of consumers in each country that would prefer to use each channel to get a status on an order they made.
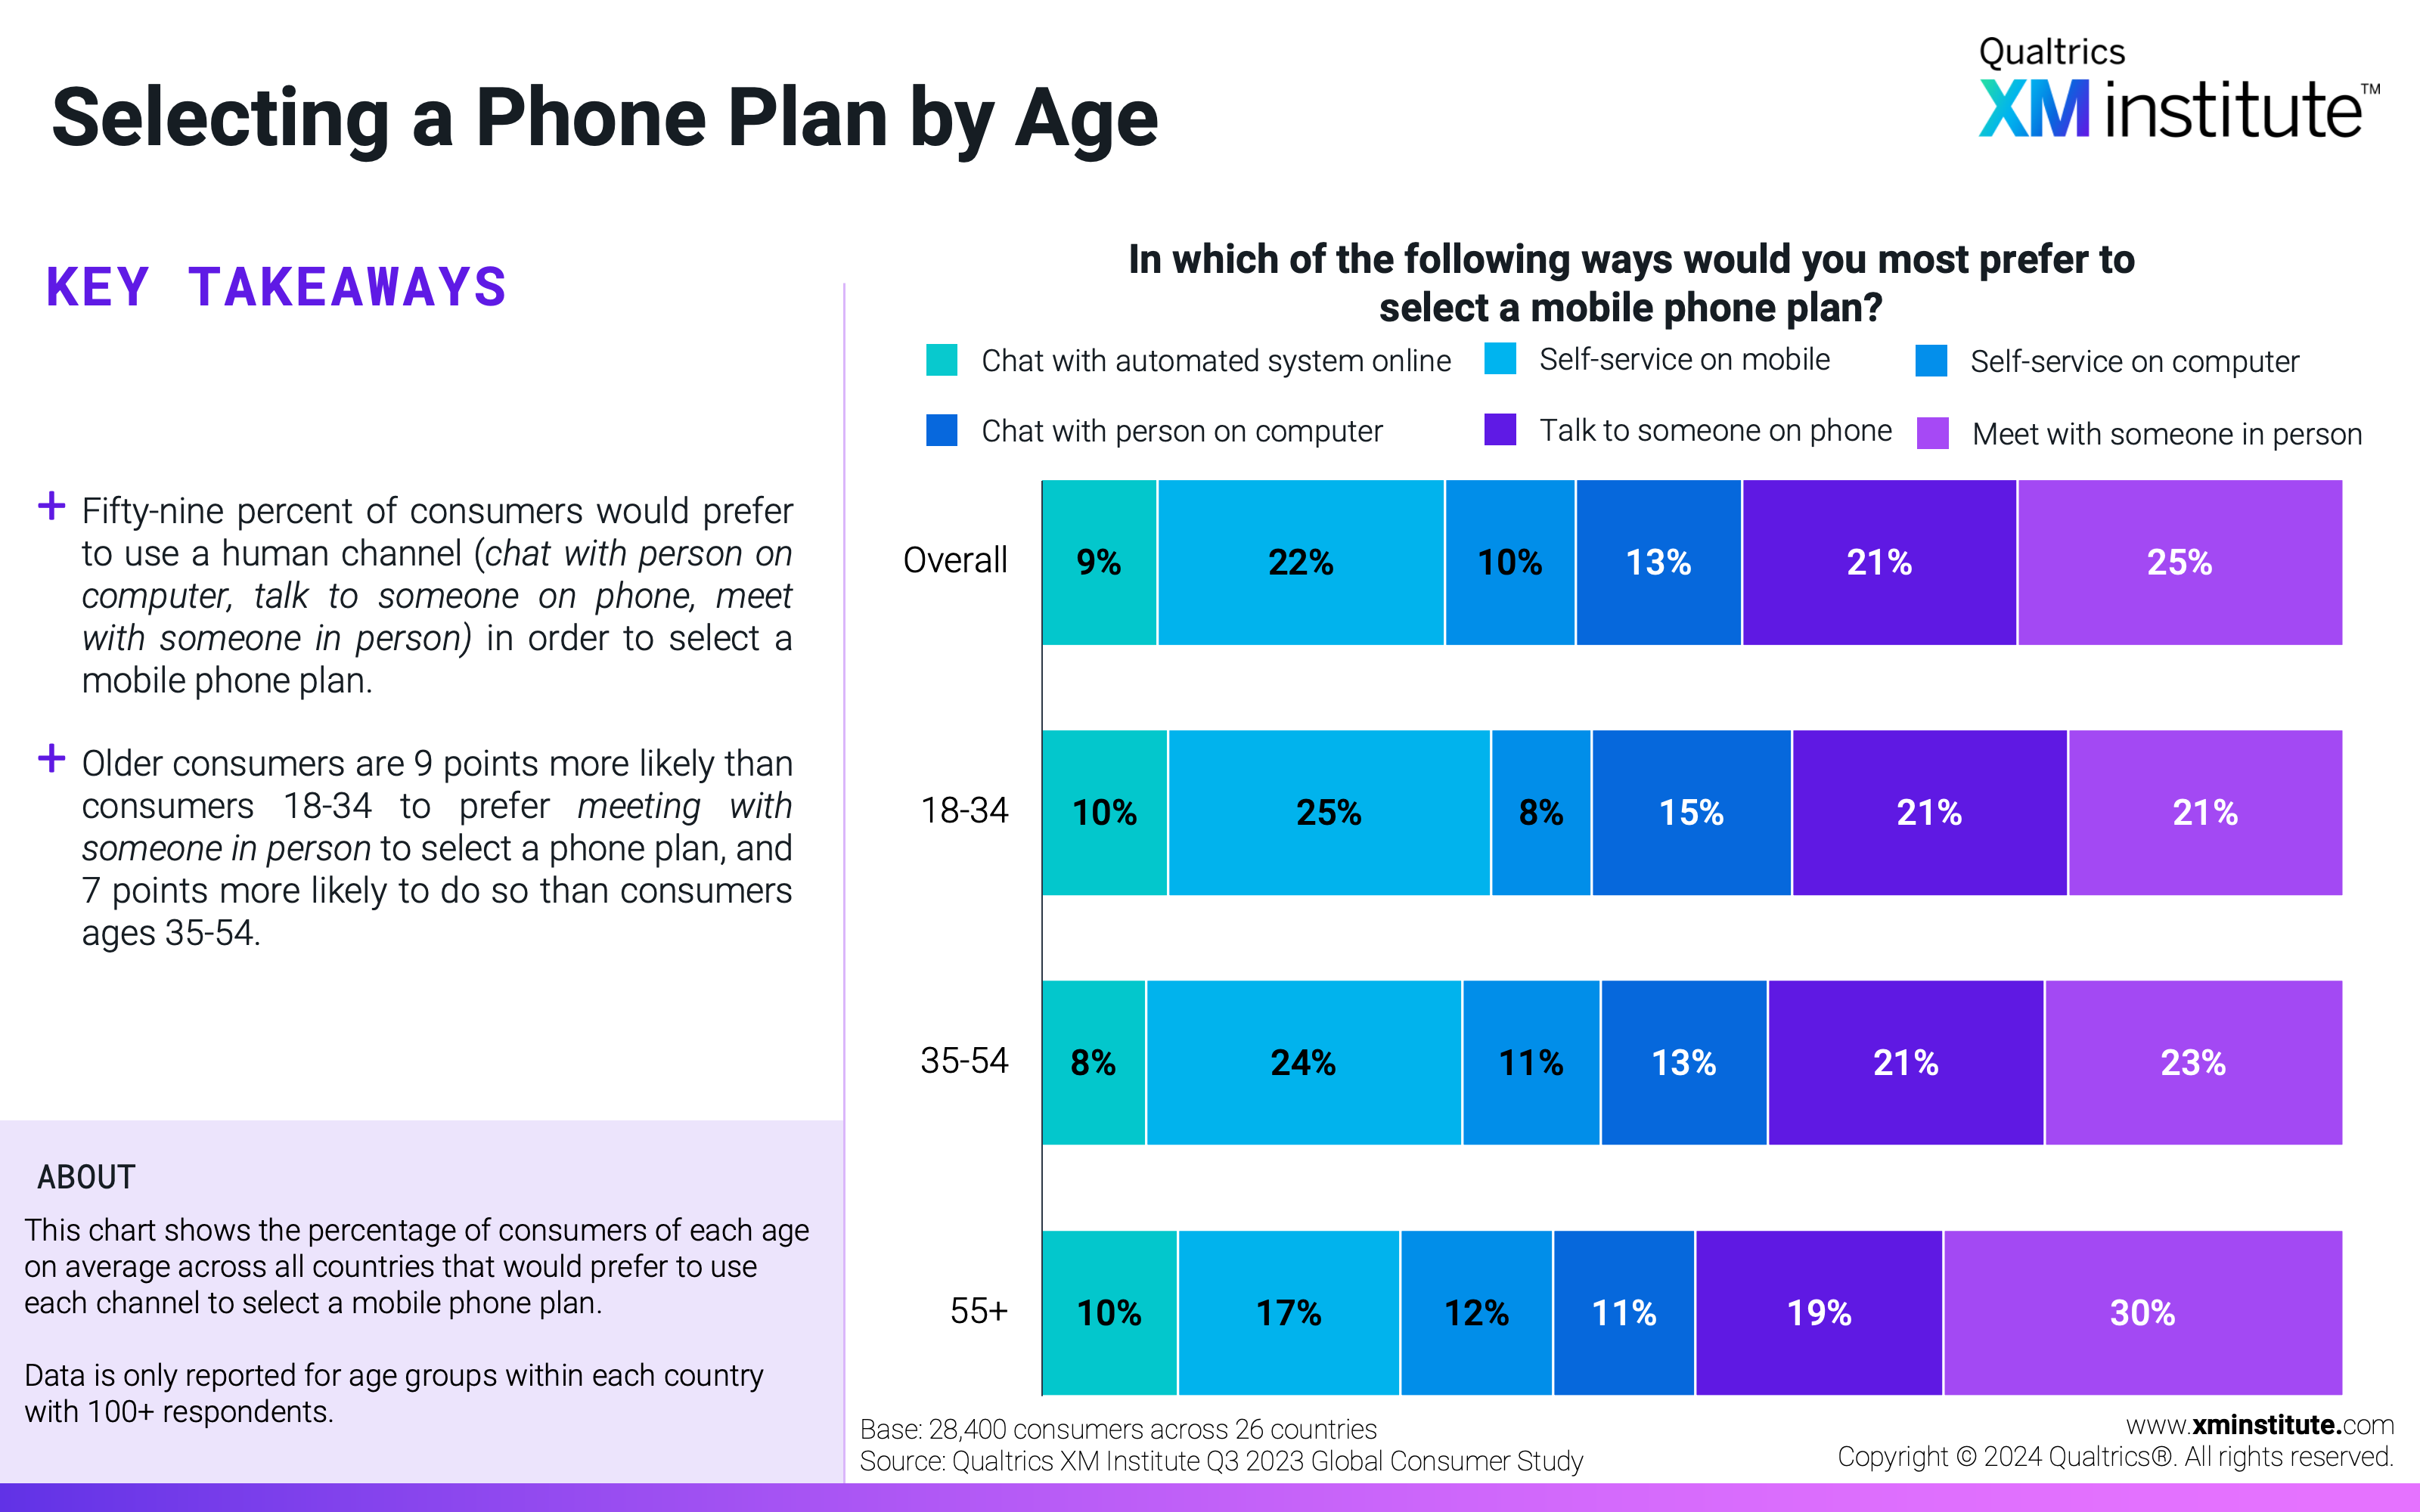
  19. Selecting a Phone Plan by Age This chart shows the percentage of consumers of each age on average across all countries that would prefer to use each channel to select a mobile phone plan.
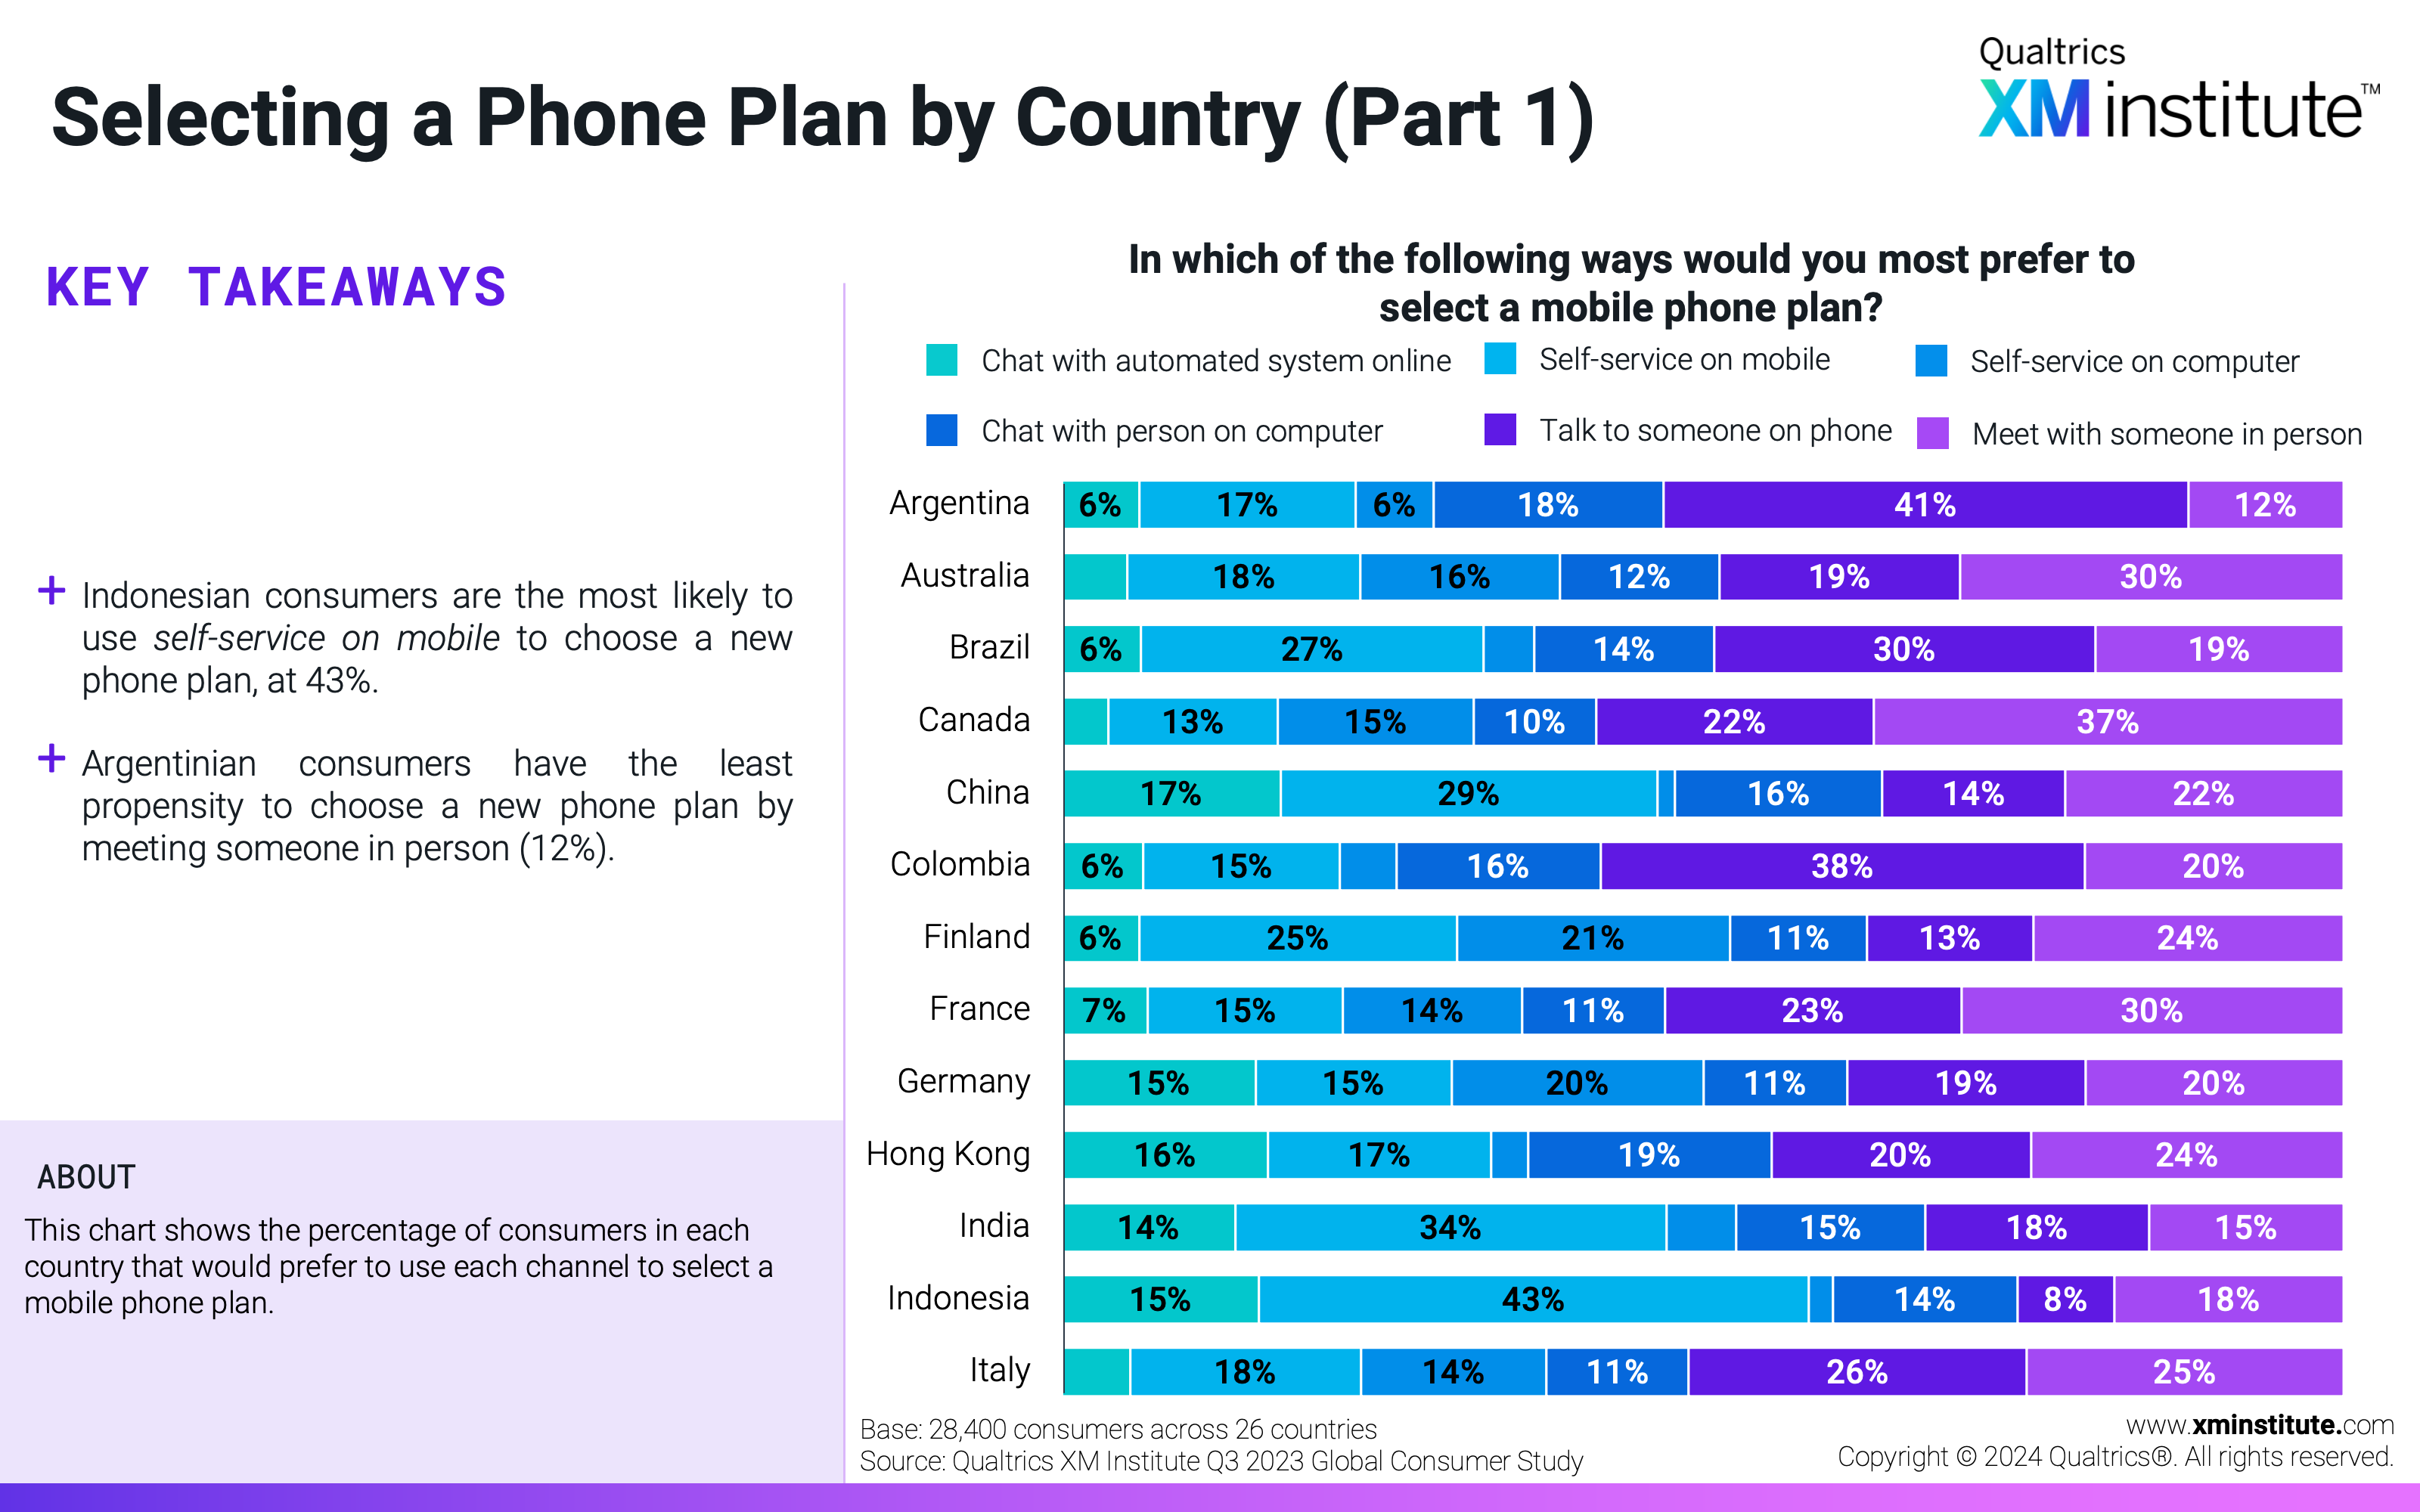
  20. Selecting a Phone Plan by Country (Part 1) This chart shows the percentage of consumers in each country that would prefer to use each channel to select a mobile phone plan.
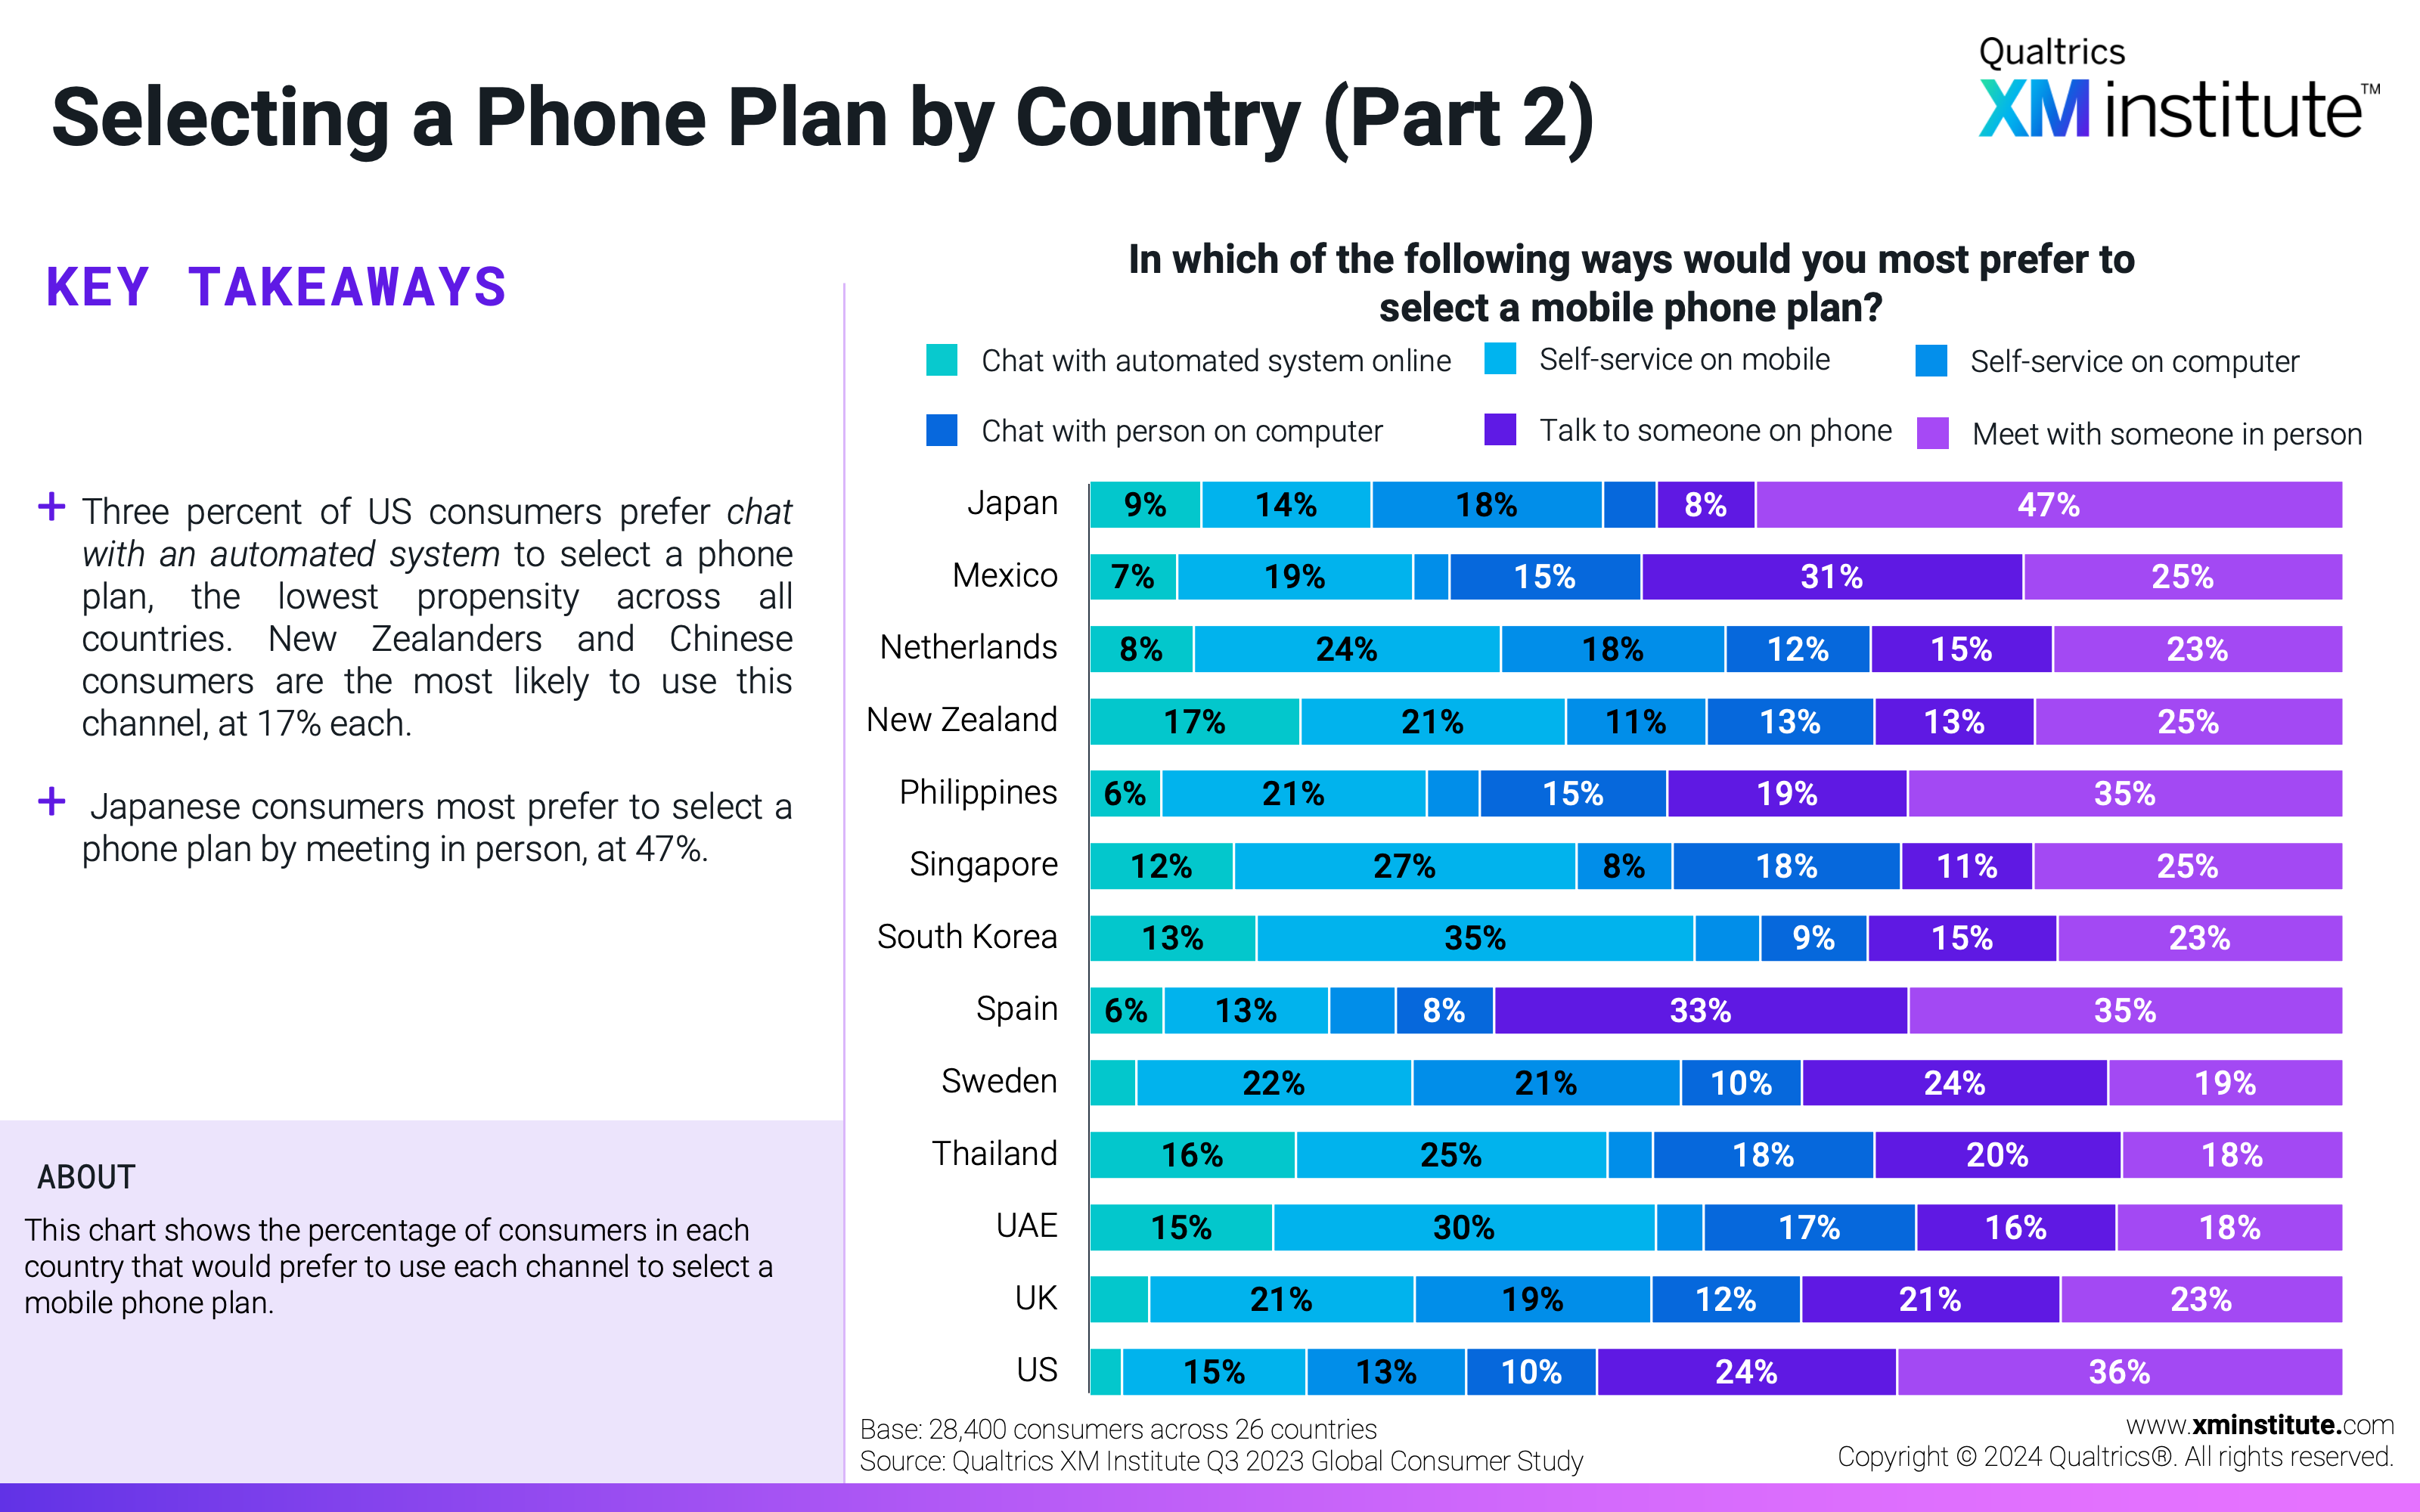
  21. Selecting a Phone Plan by Country (Part 2) This chart shows the percentage of consumers in each country that would prefer to use each channel to select a mobile phone plan.
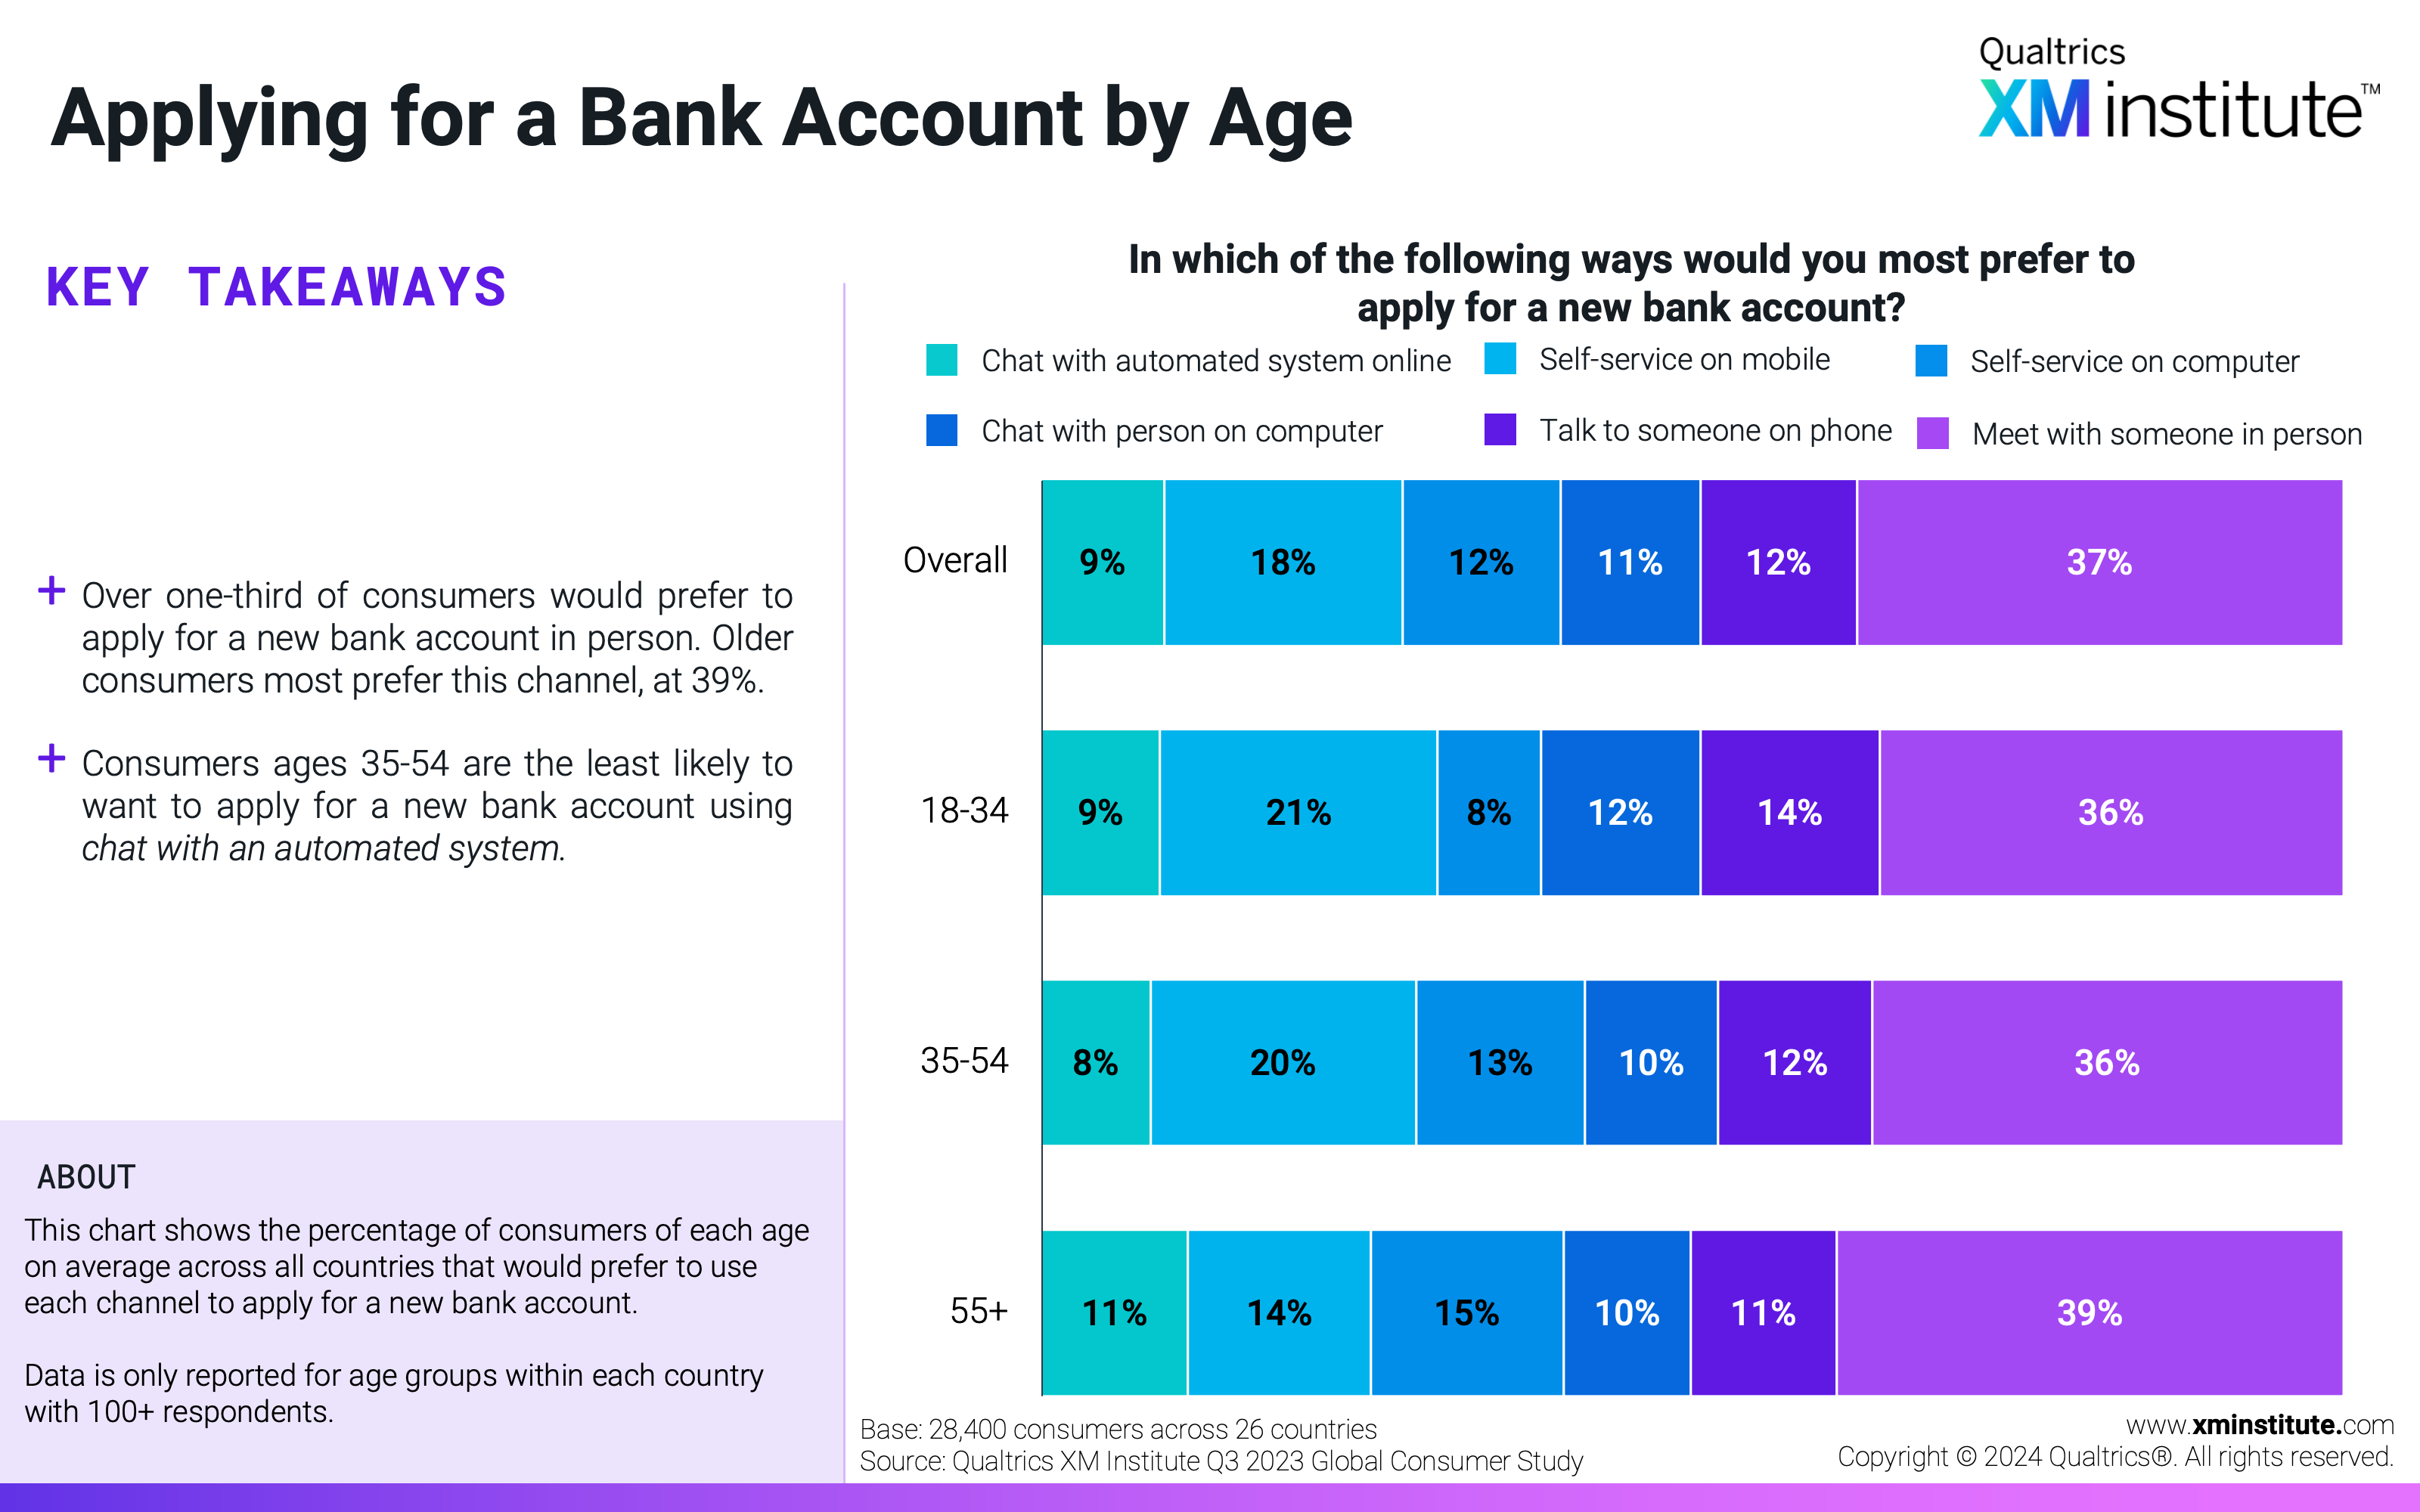
  22. Applying for a Bank Account by Age This chart shows the percentage of consumers of each age on average across all countries that would prefer to use each channel to apply for a new bank account.
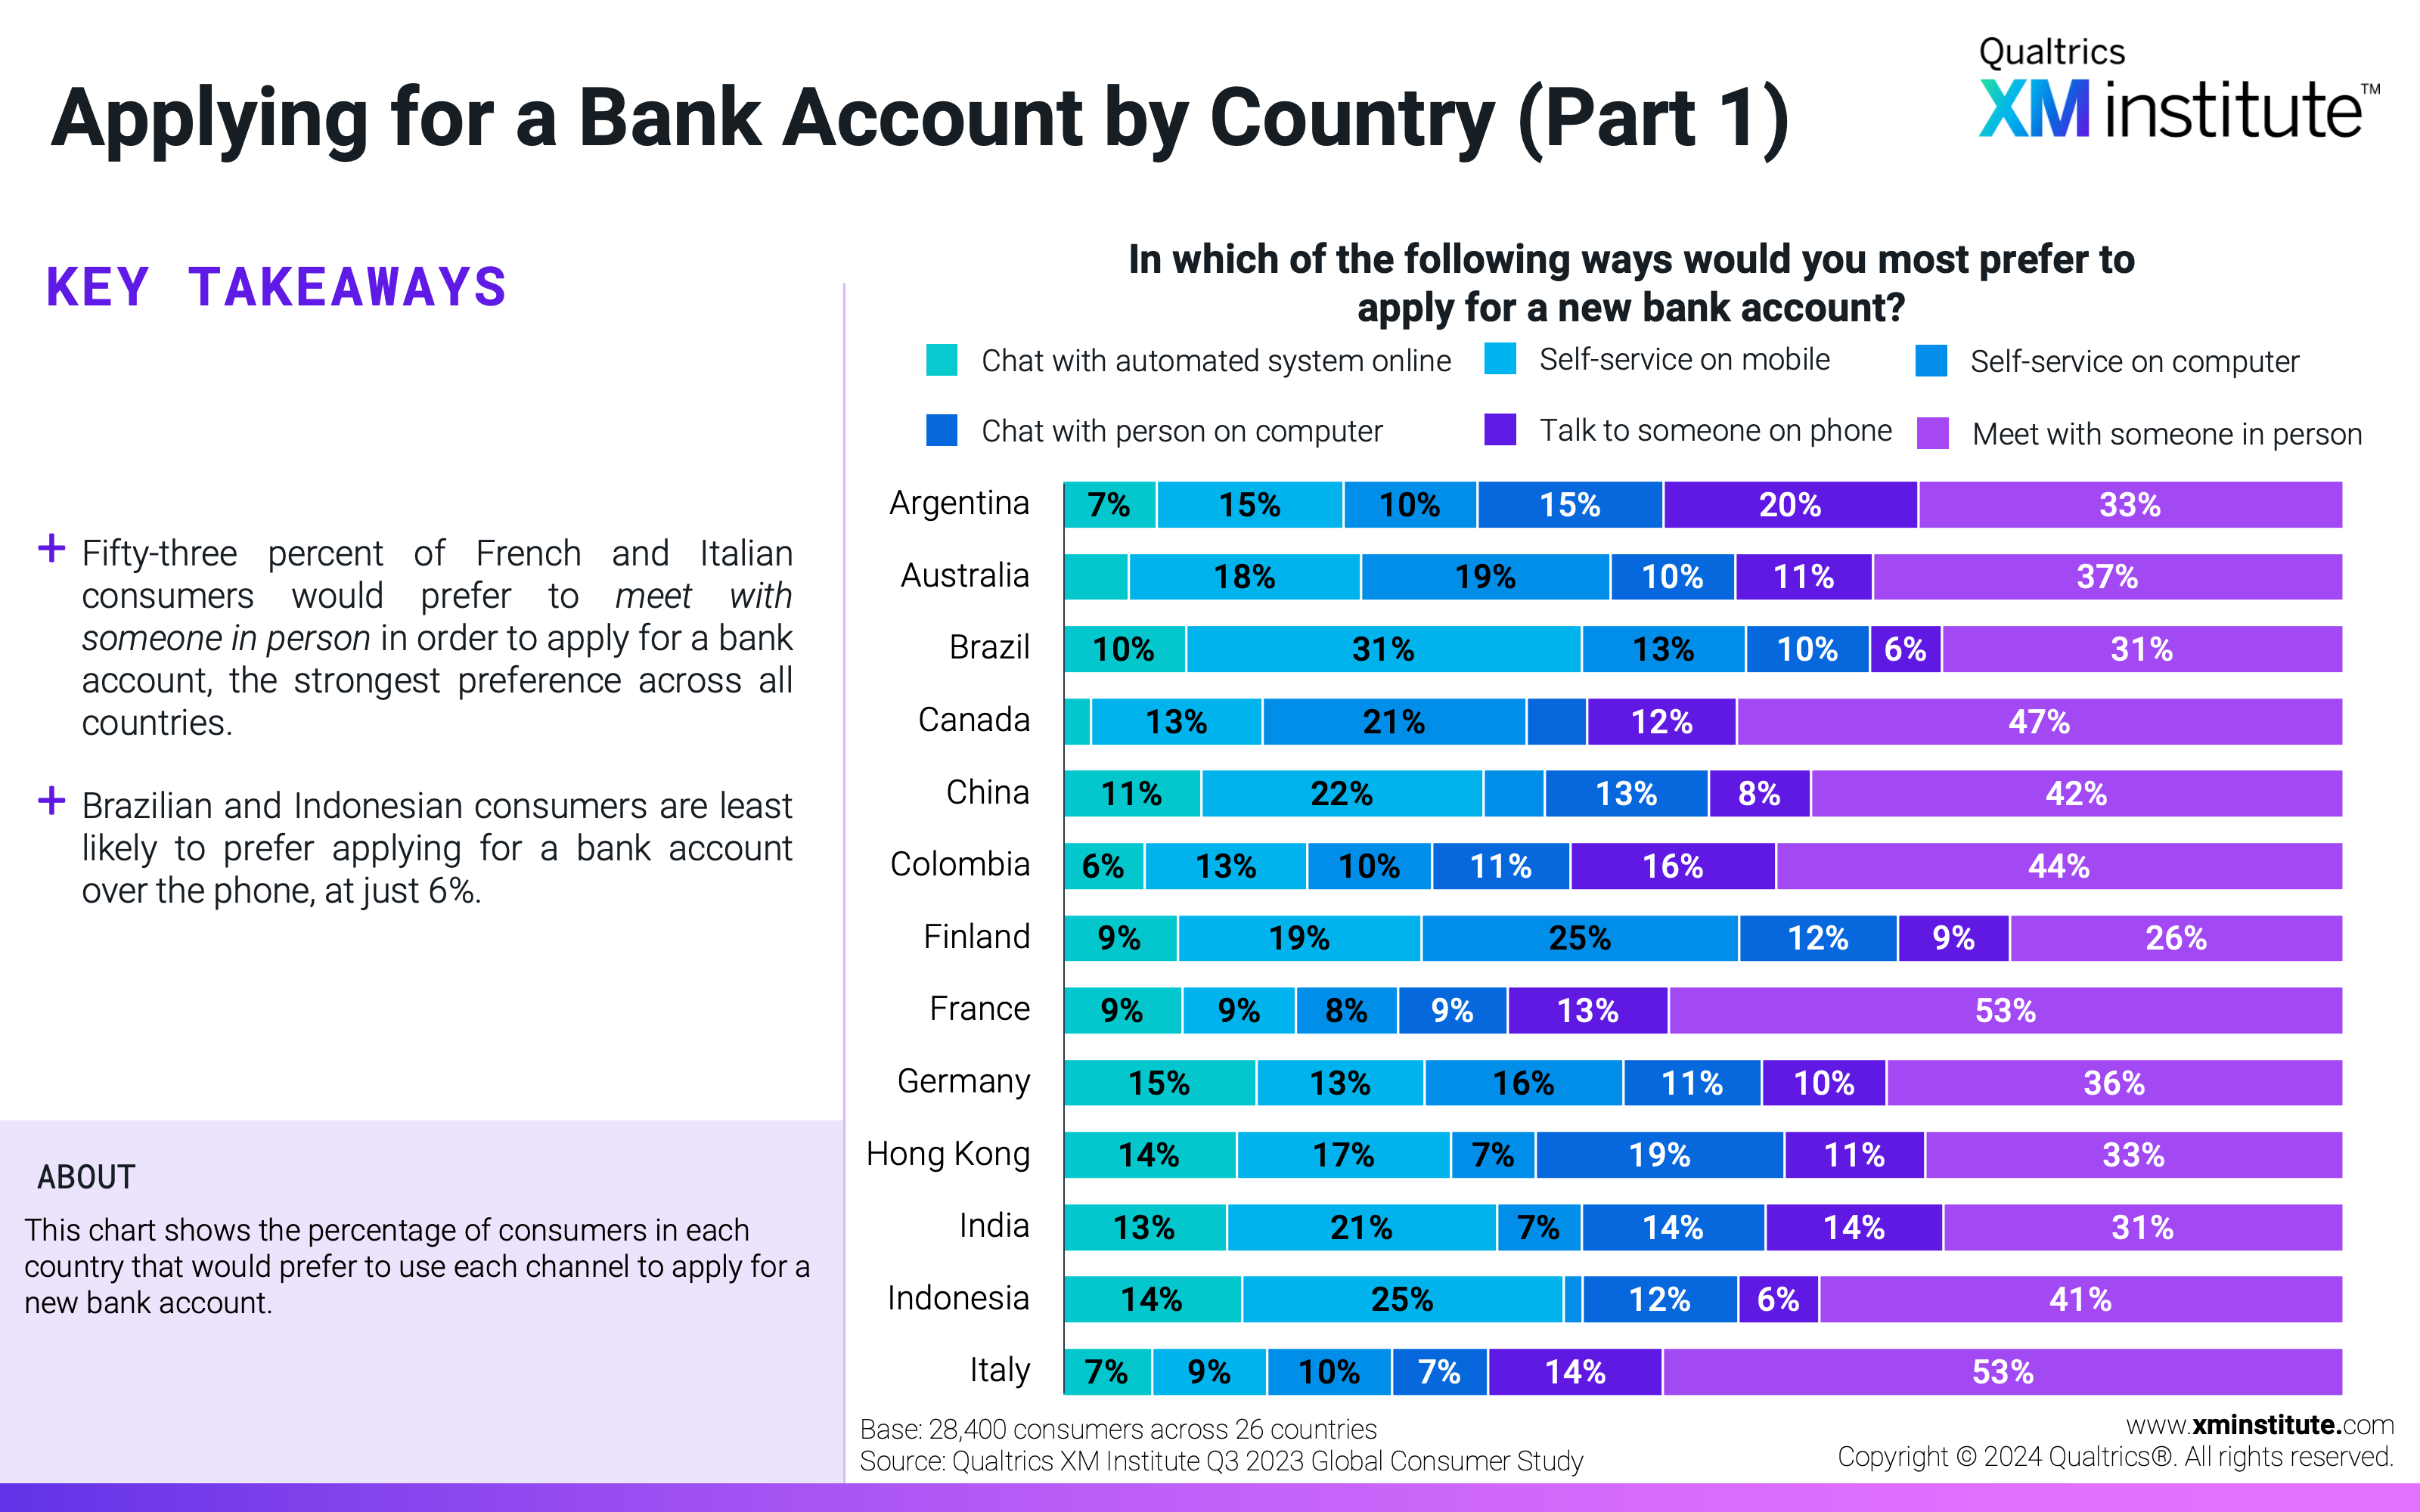
  23. Applying for a Bank Account by Country (Part 1) This chart shows the percentage of consumers in each country that would prefer to use each channel to apply for a new bank account.
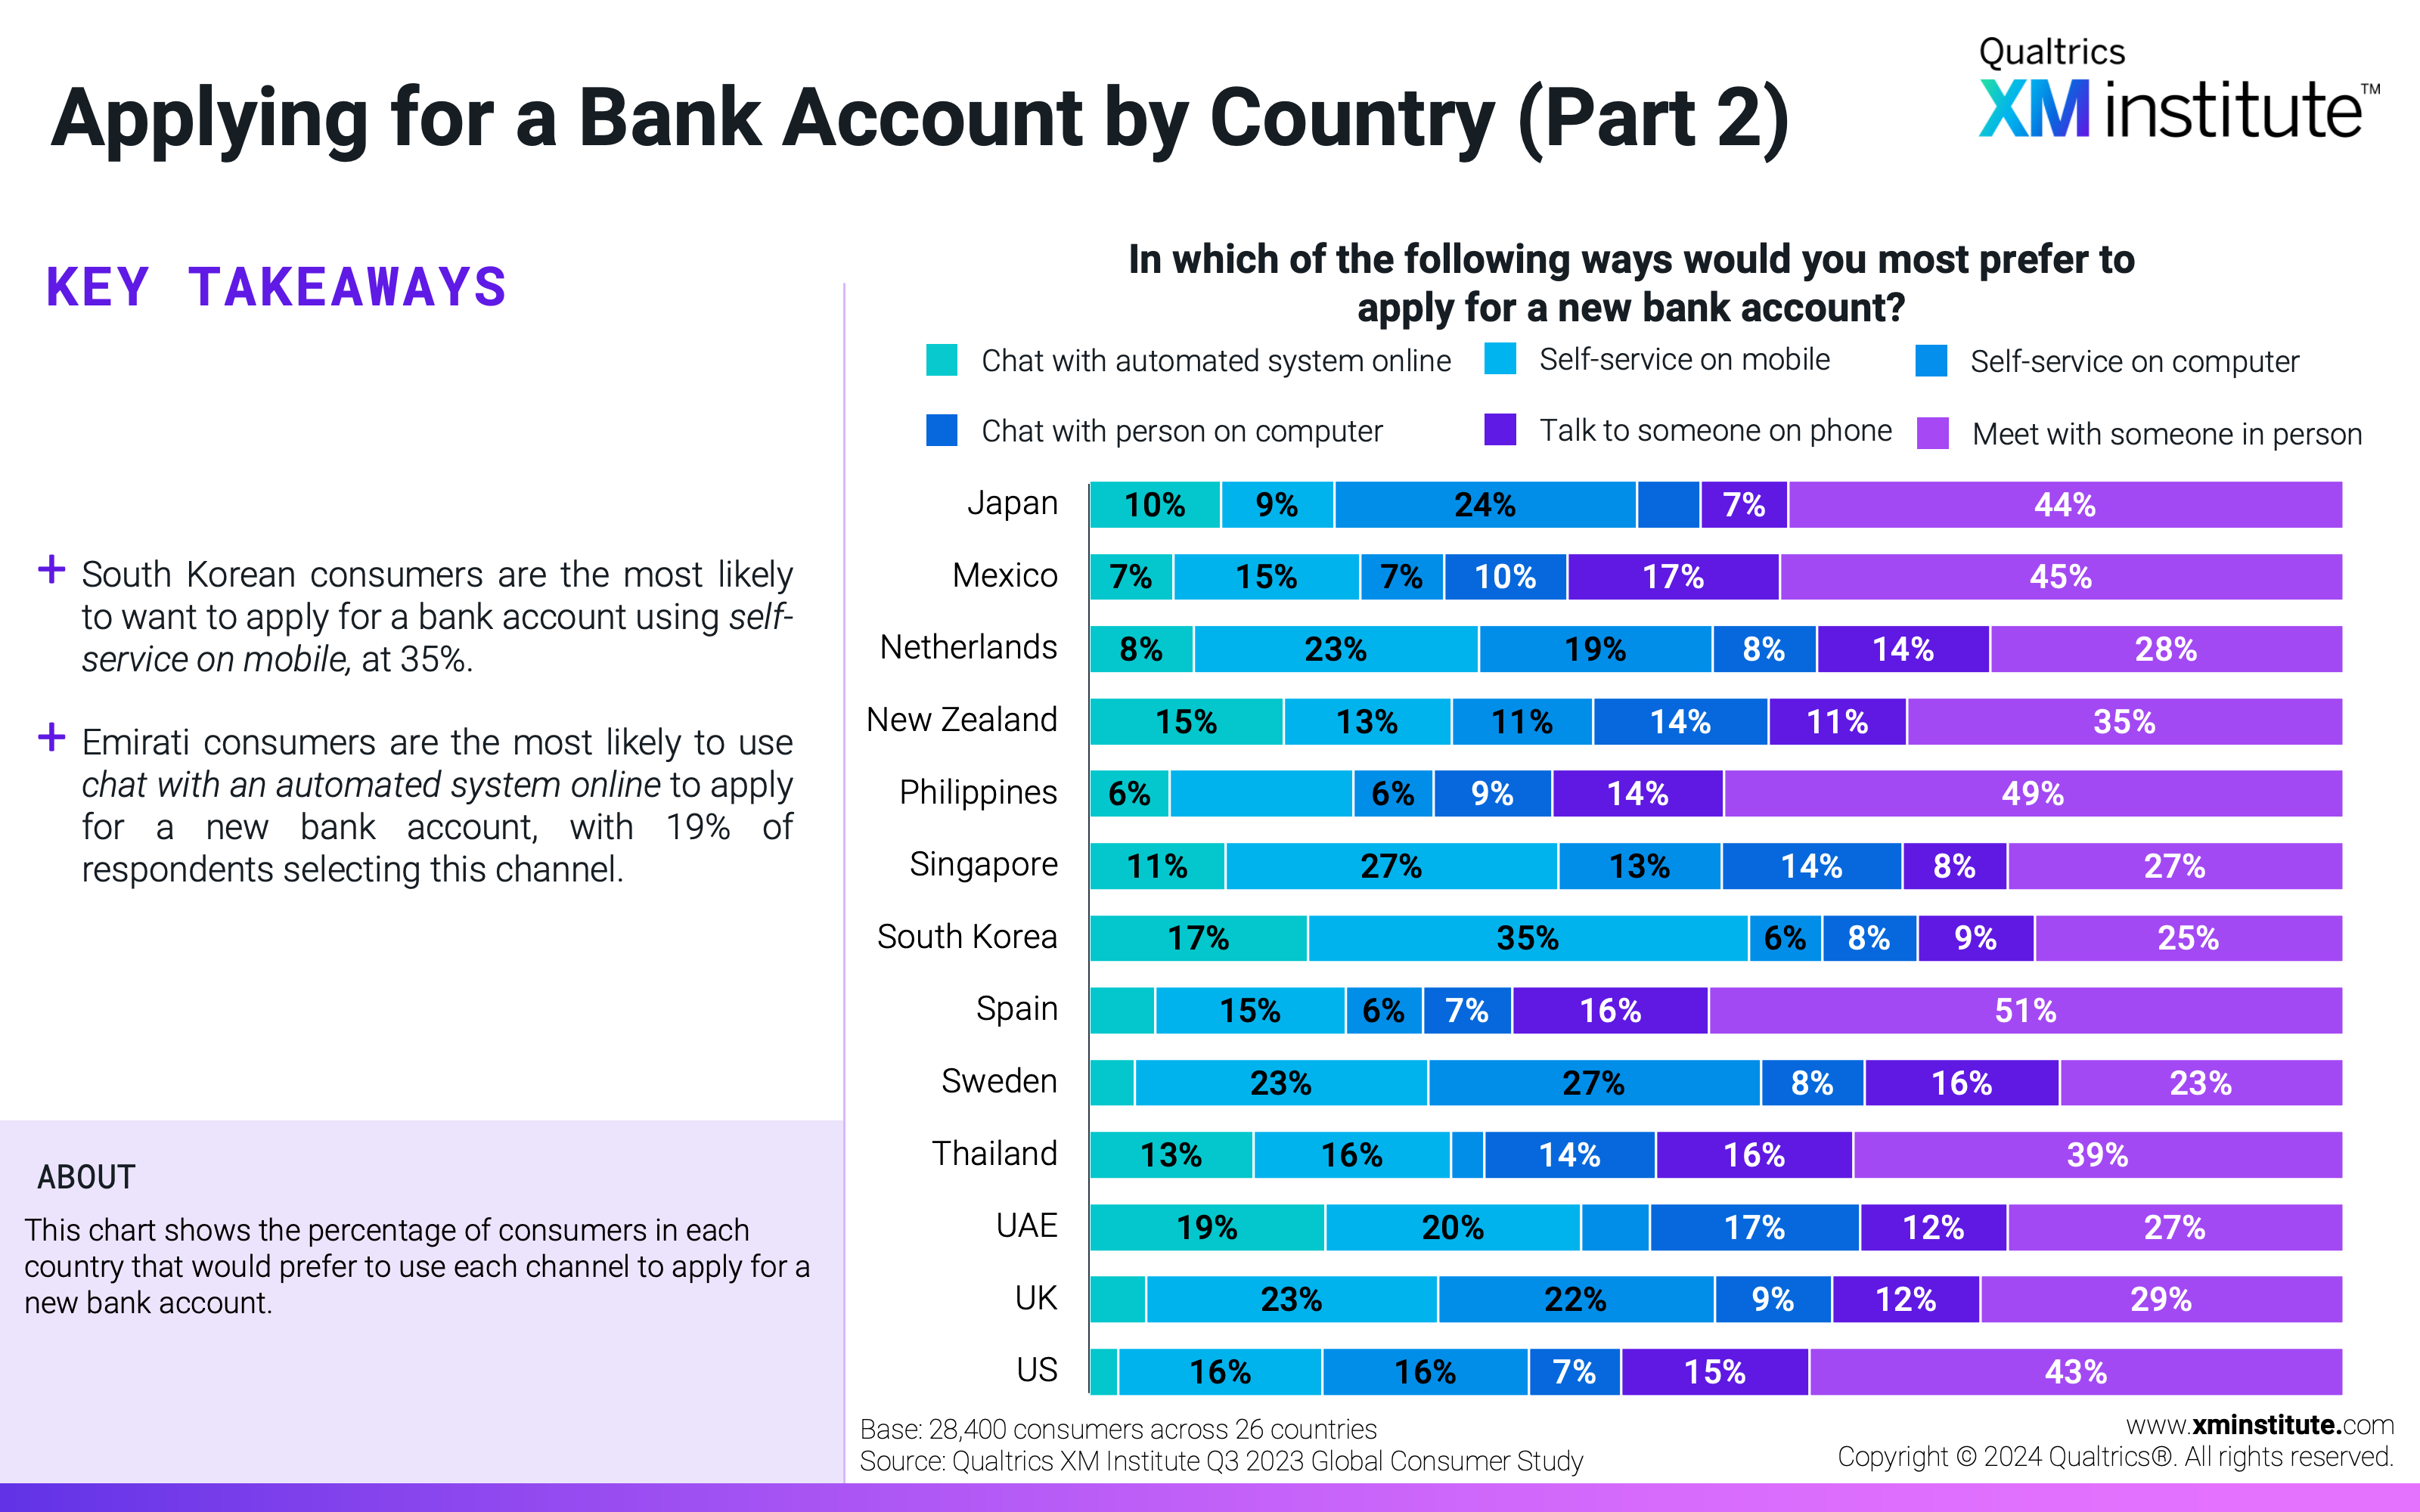
  24. Applying for a Bank Account by Country (Part 2) This chart shows the percentage of consumers in each country that would prefer to use each channel to apply for a new bank account.
  25. Scheduling a Medical Appointment by Age This chart shows the percentage of consumers of each age on average across all countries that would prefer to use each channel to schedule a medical appointment.
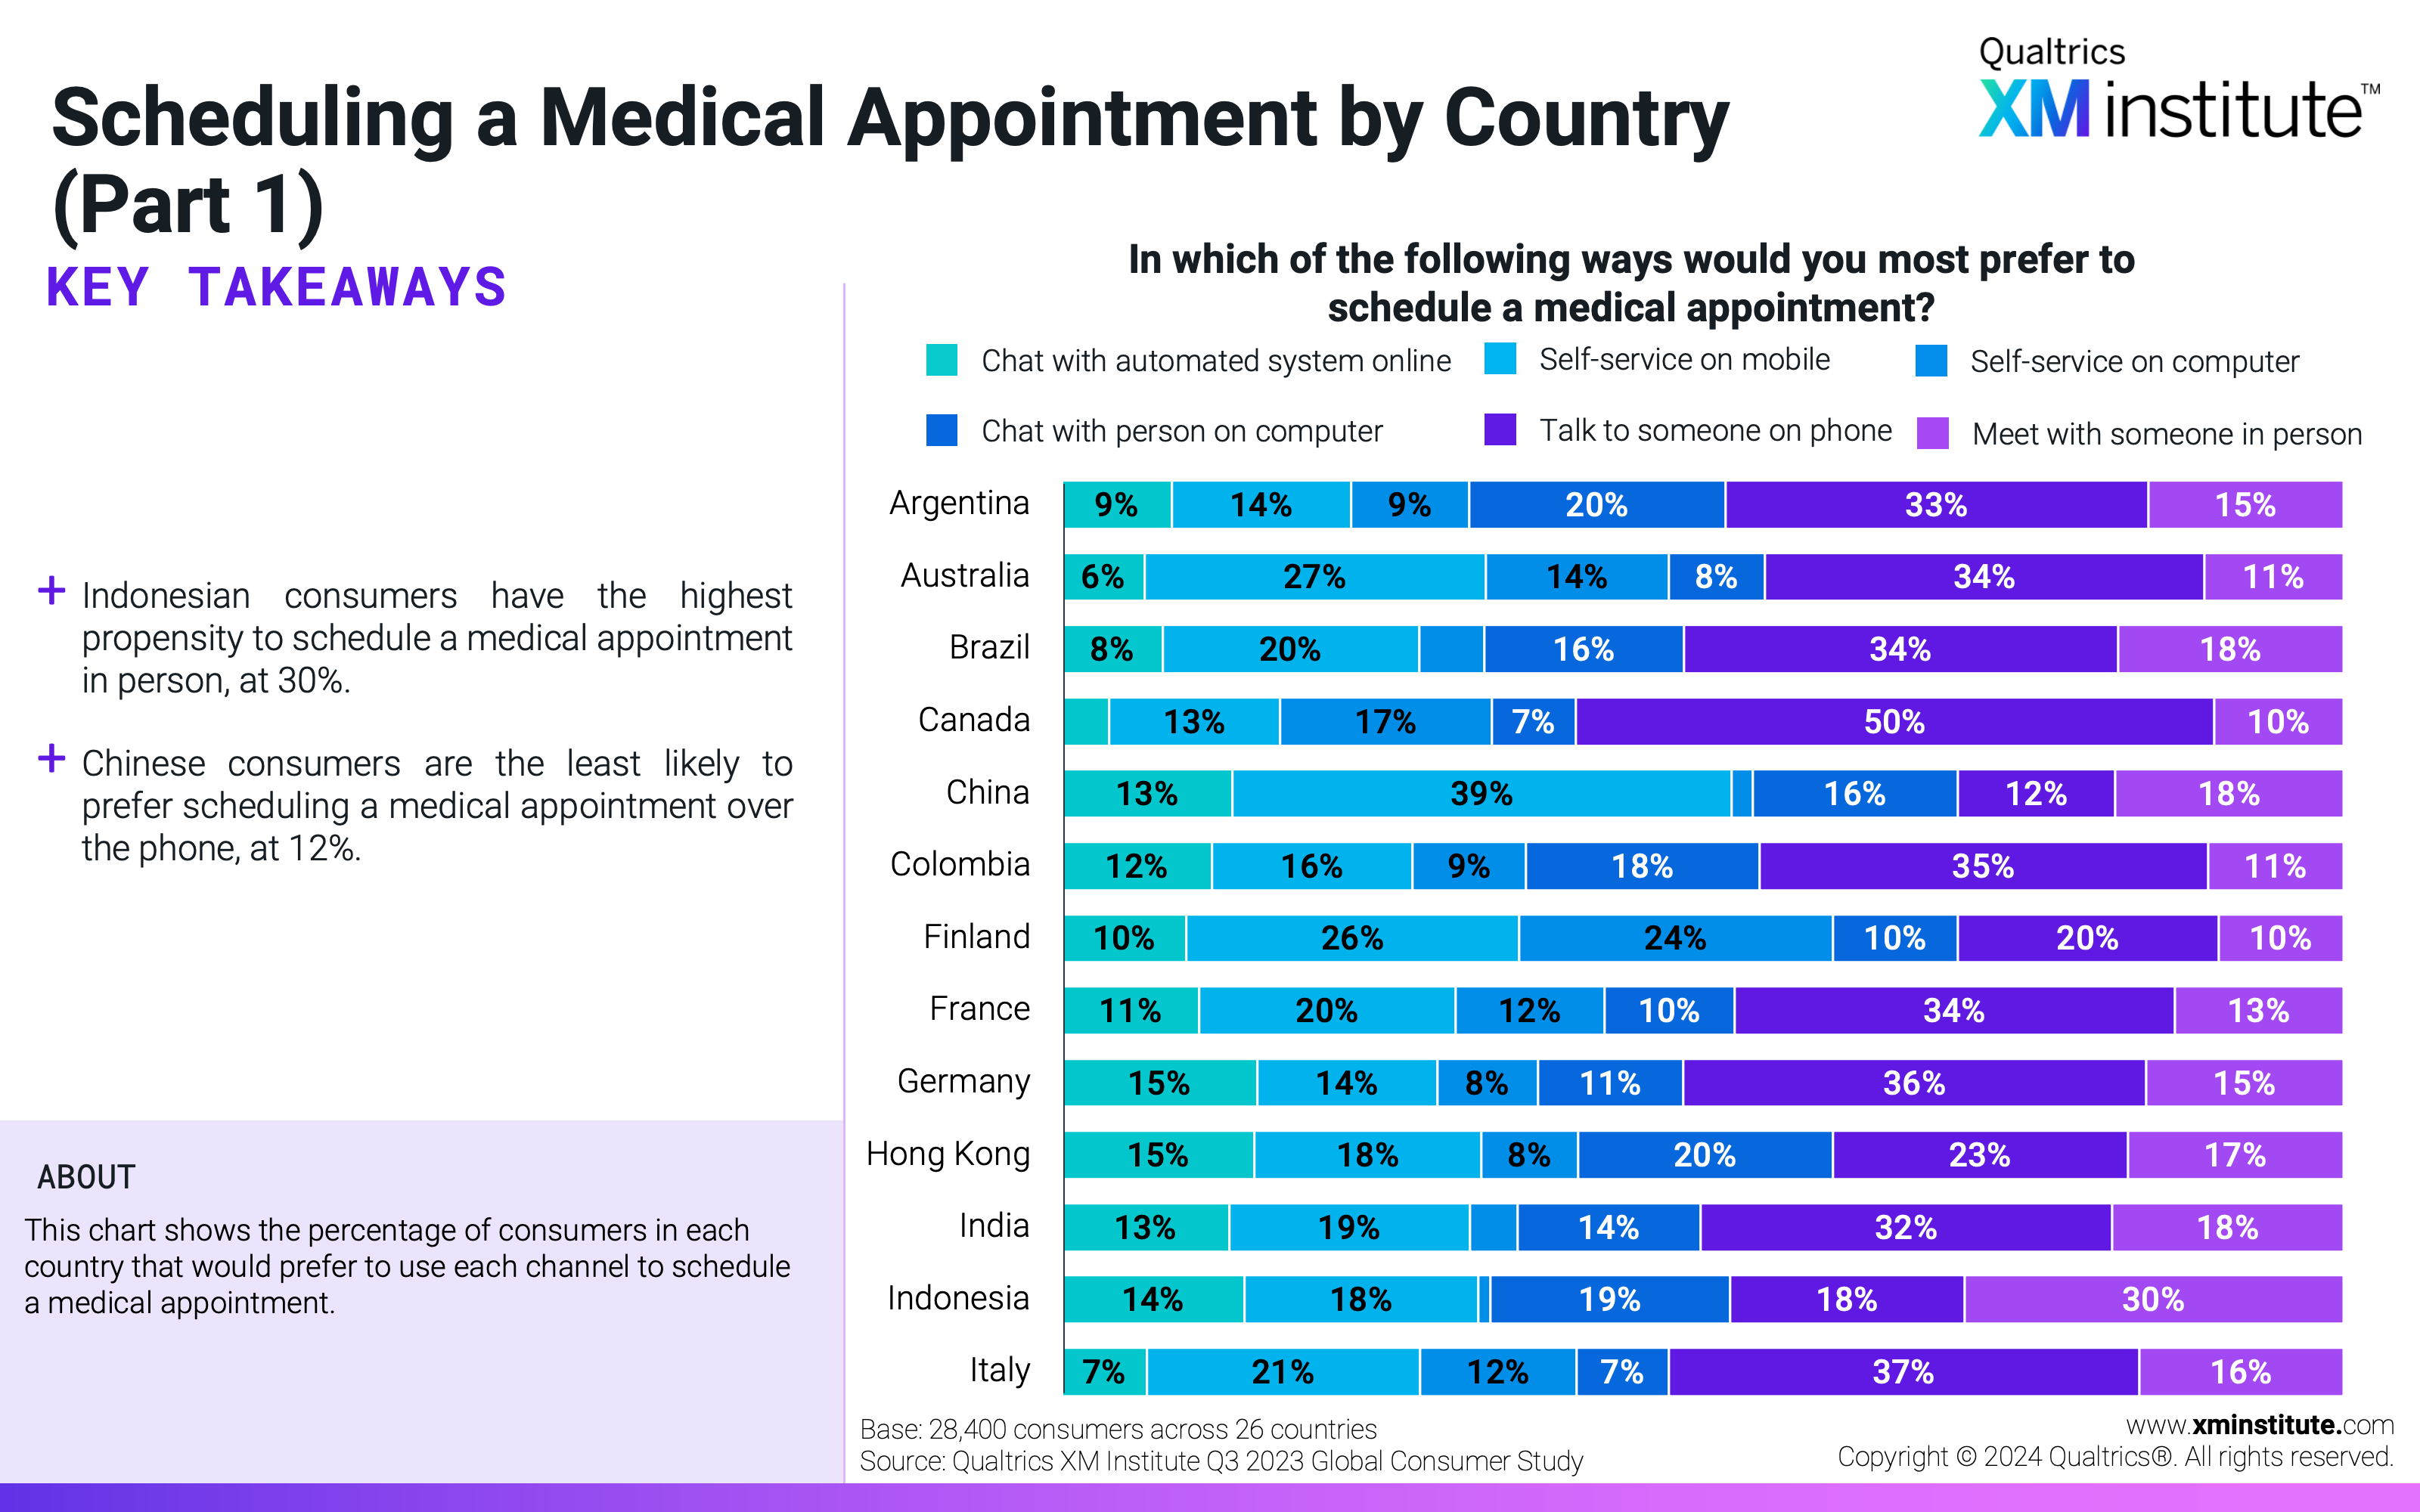
  26. Scheduling a Medical Appointment by Country (Part 1) This chart shows the percentage of consumers in each country that would prefer to use each channel to schedule a medical appointment.
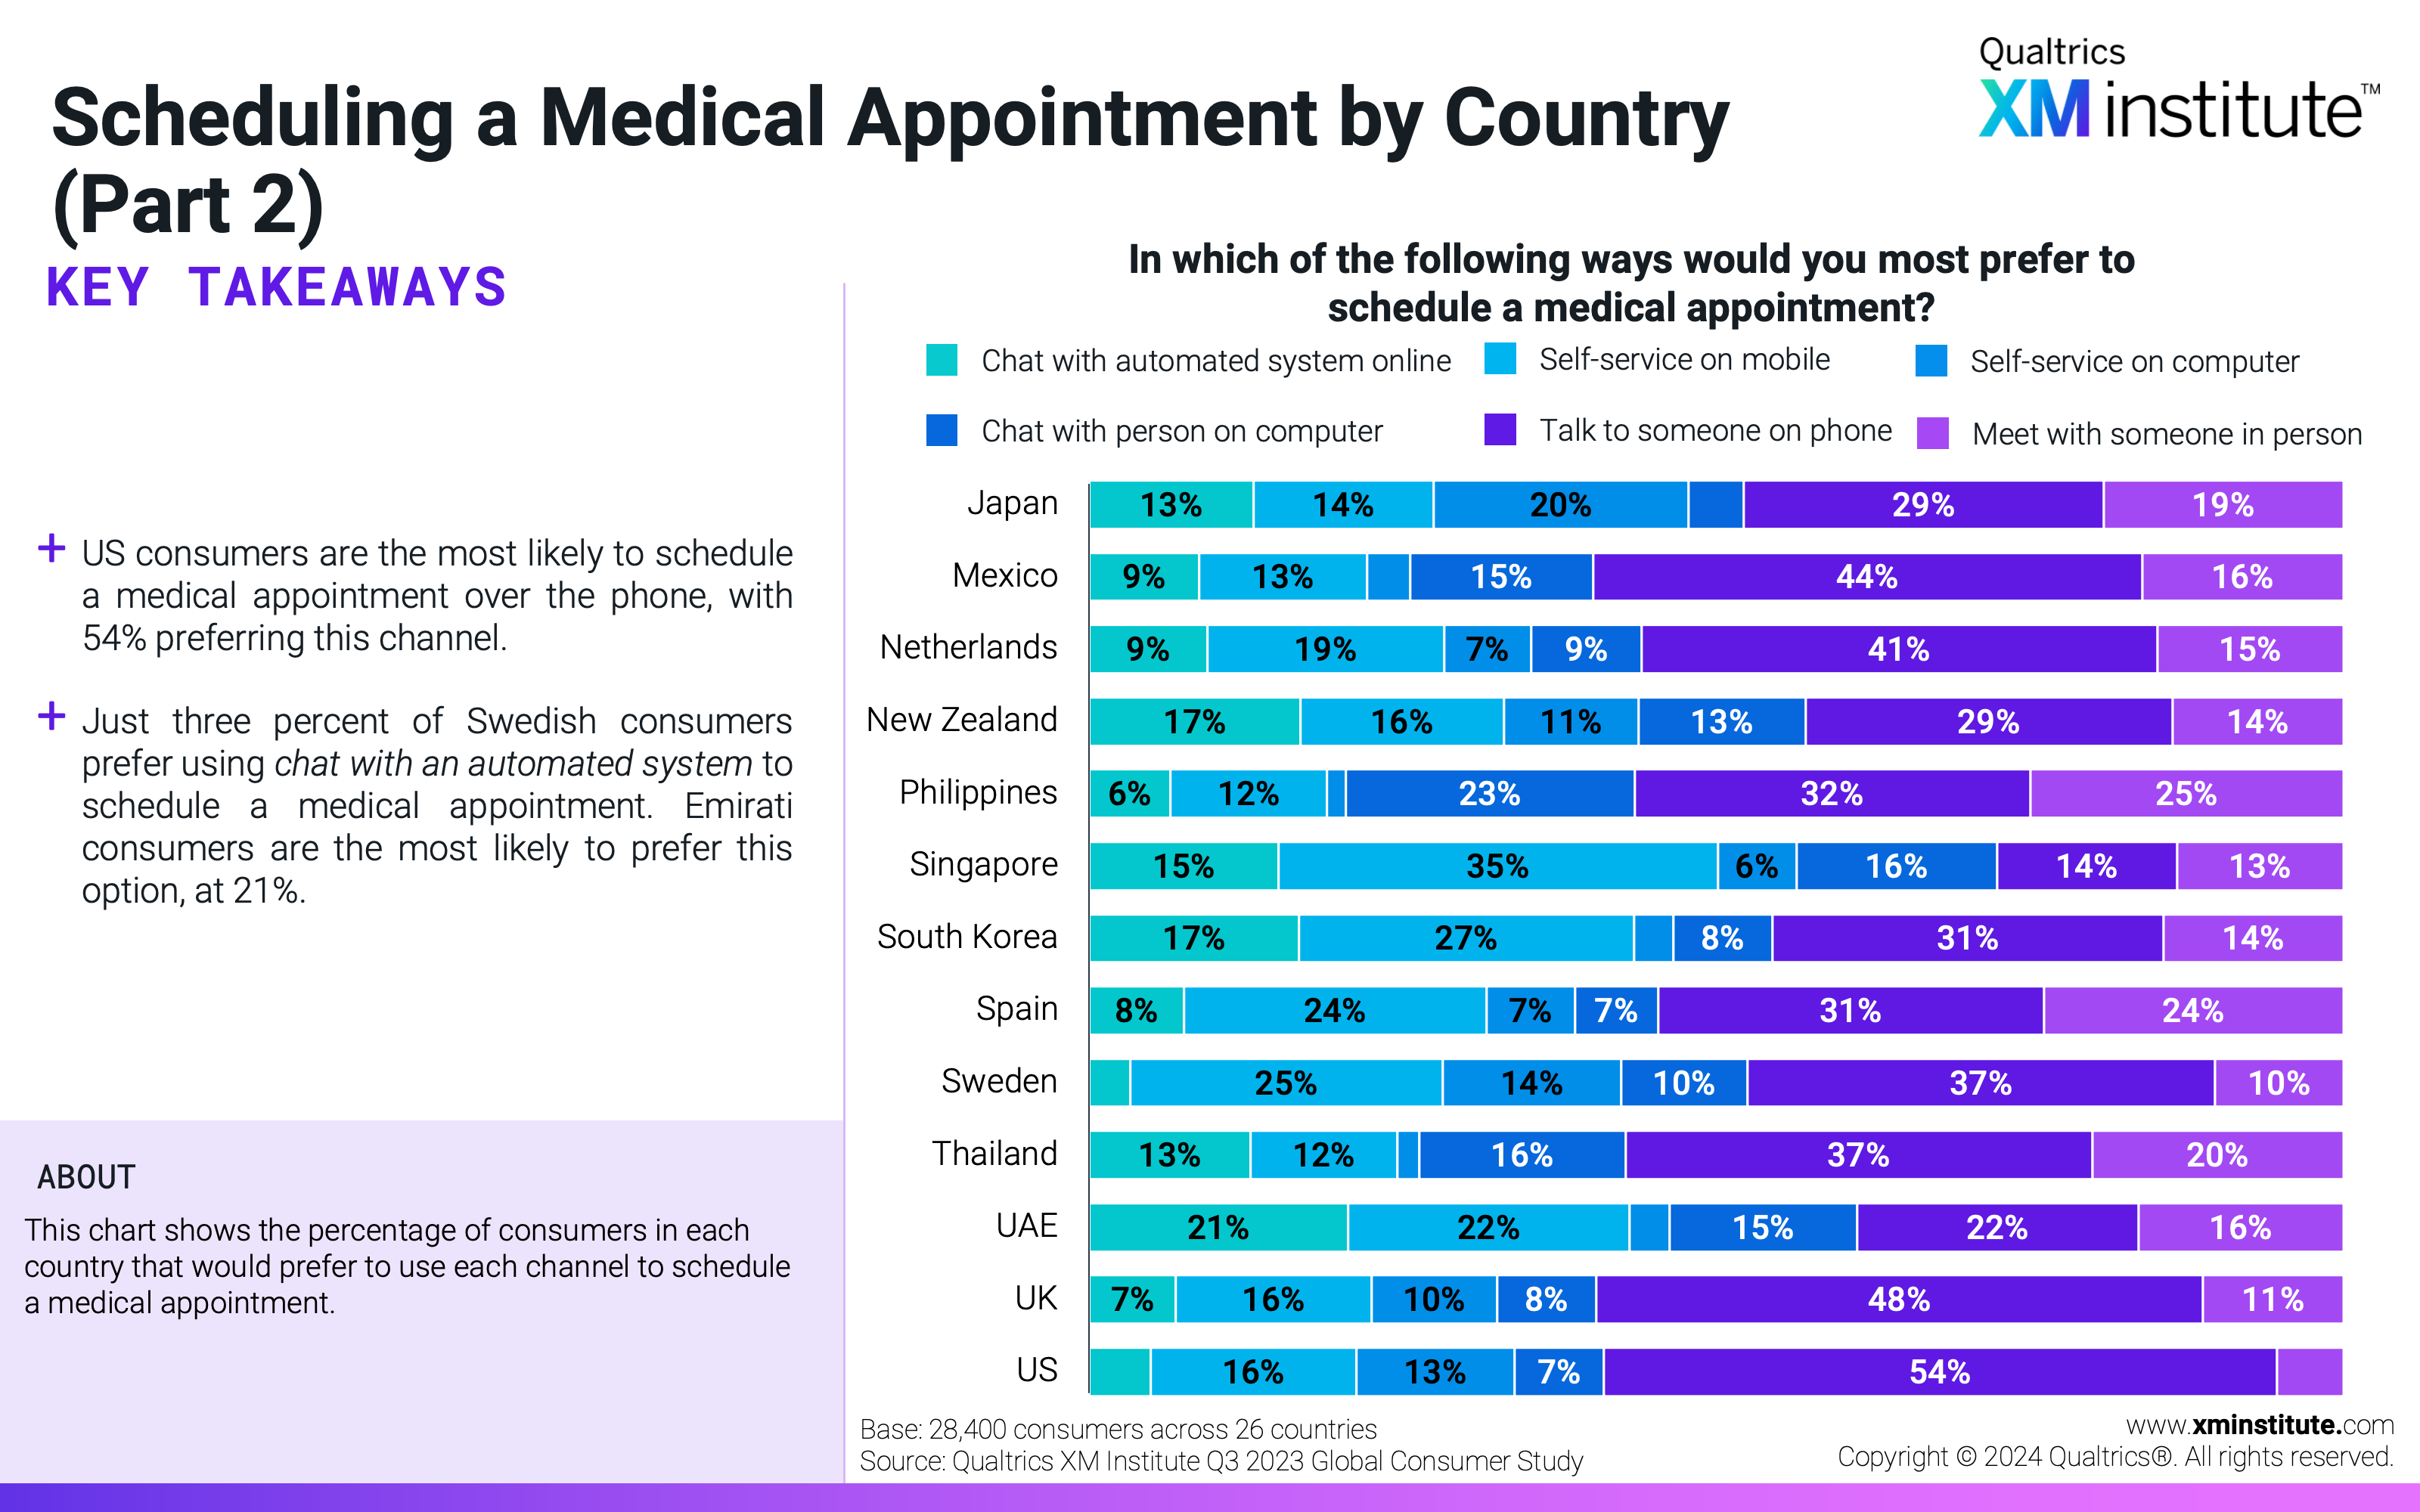
  27. Scheduling a Medical Appointment by Country (Part 2) This chart shows the percentage of consumers in each country that would prefer to use each channel to schedule a medical appointment.
  28. Receiving Medical Advice by Age This chart shows the percentage of consumers of each age on average across all countries that would prefer to use each channel to schedule a medical appointment.
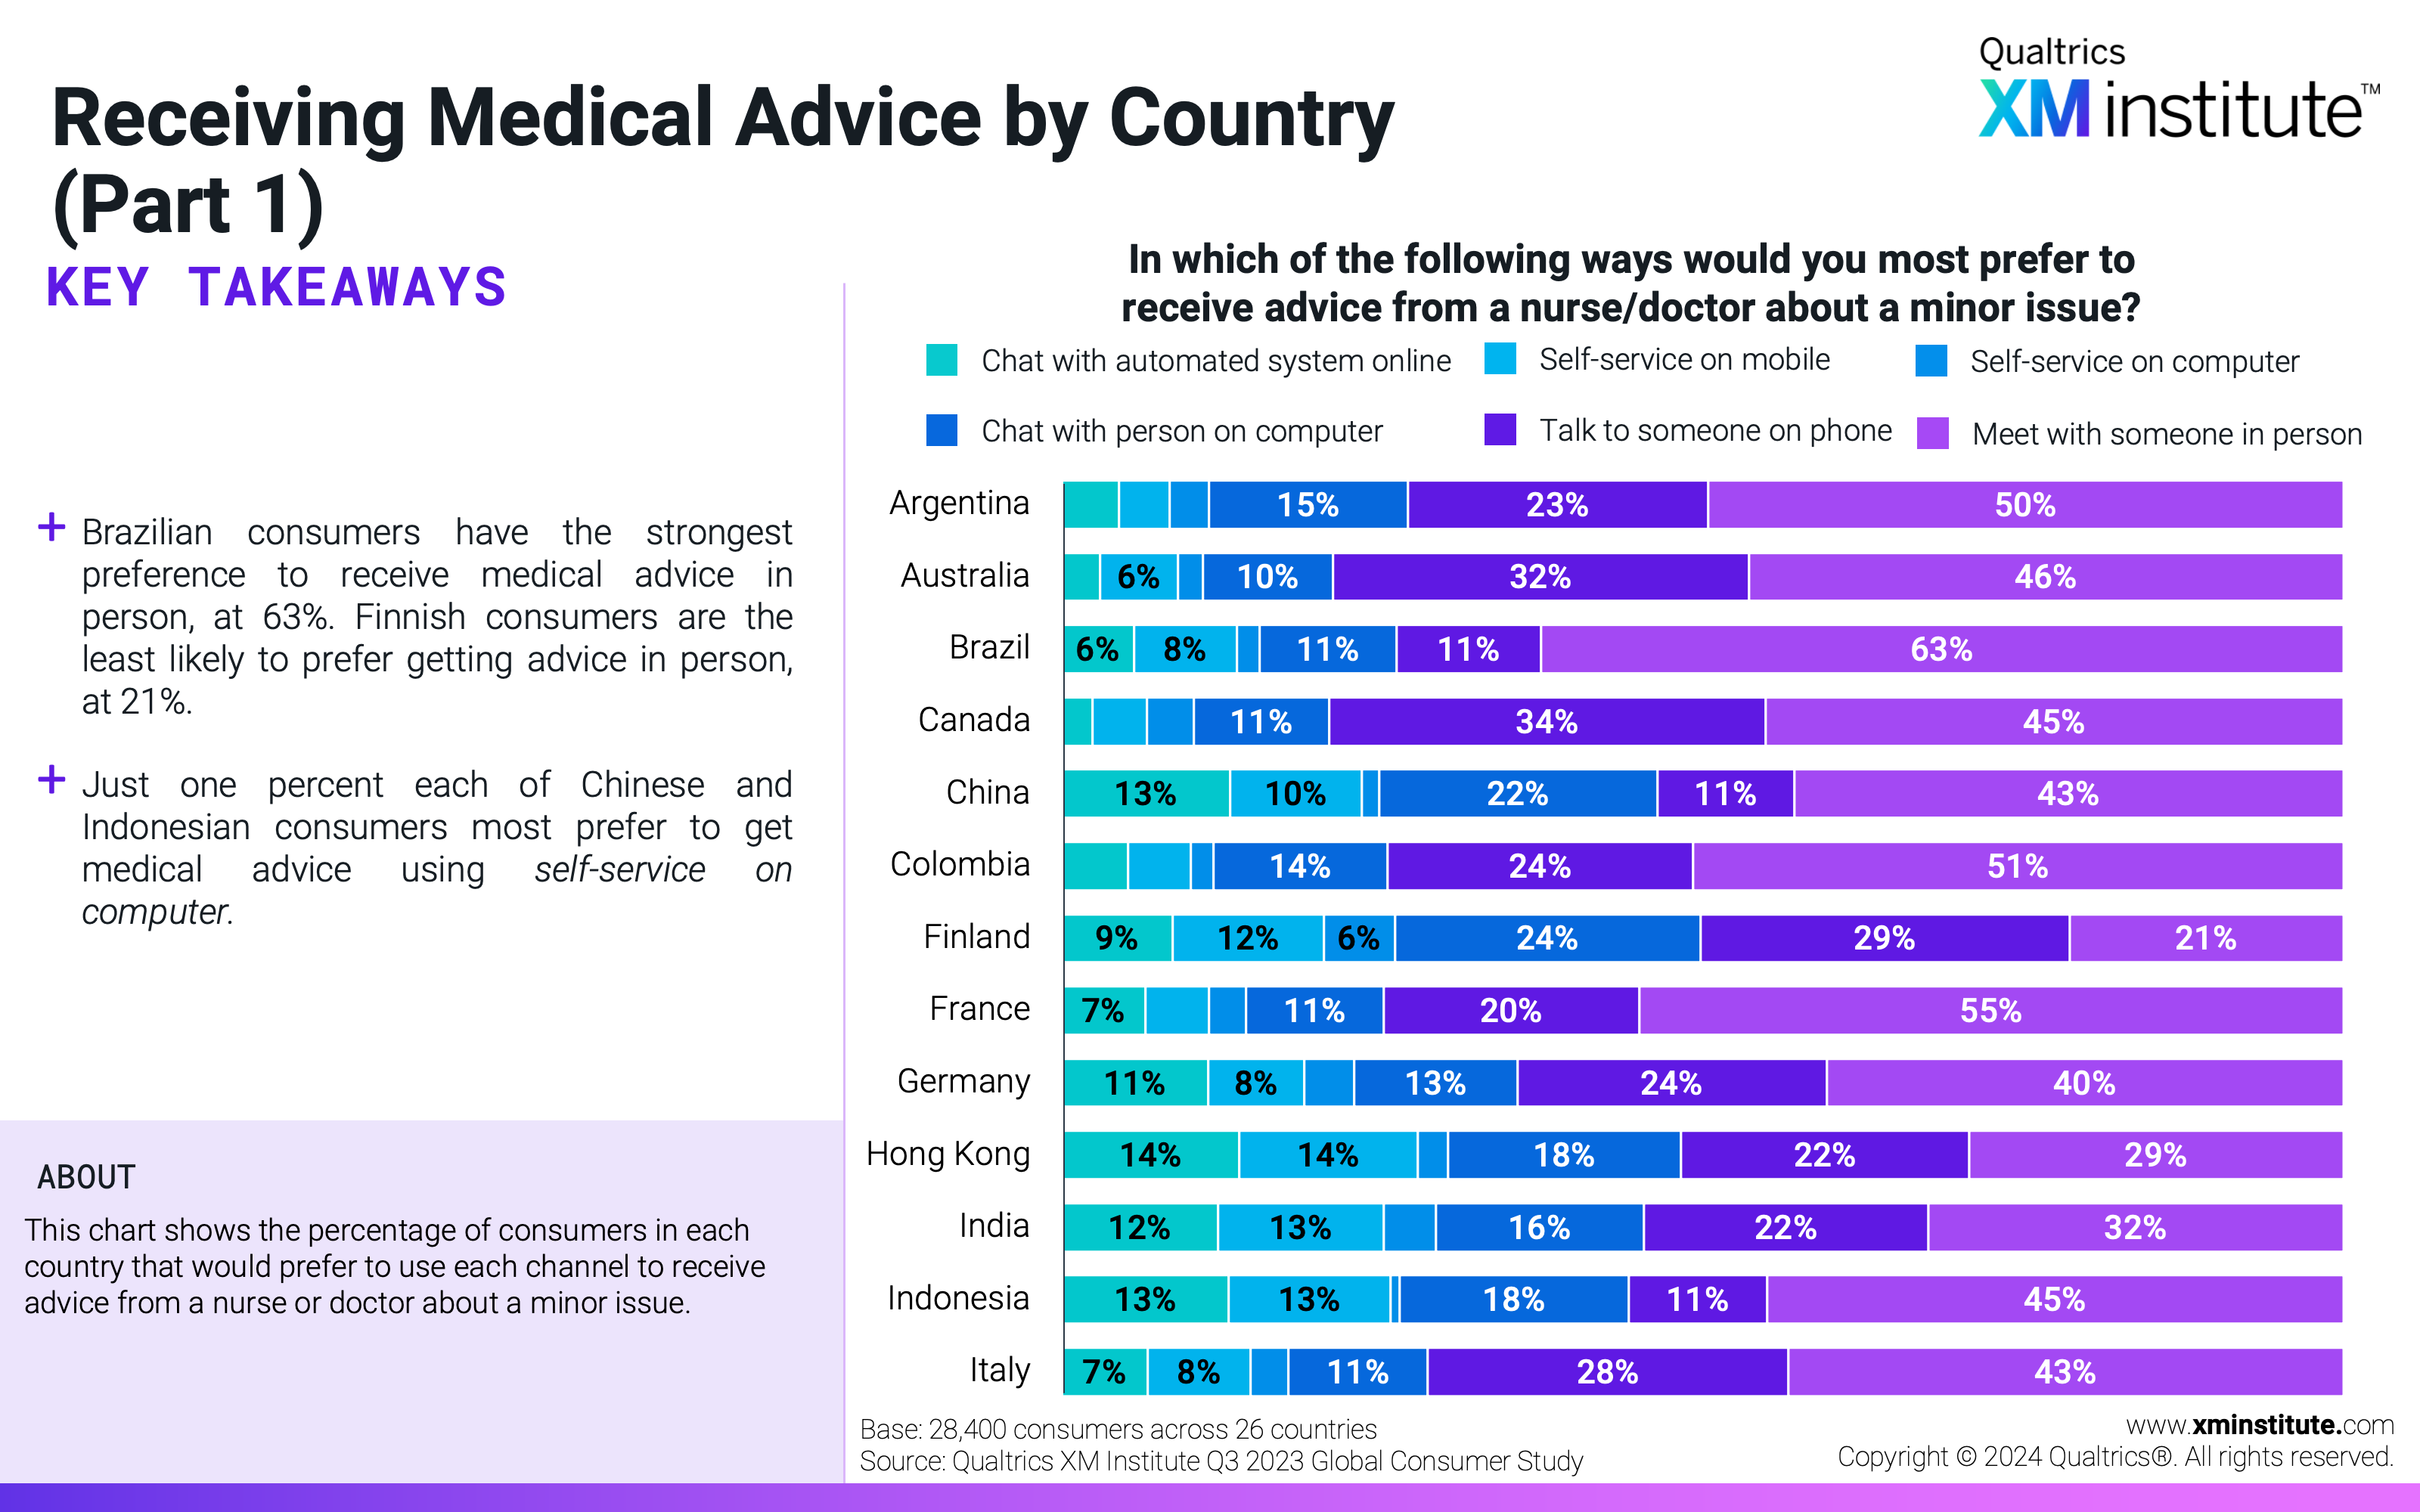
  29. Receiving Medical Advice by Country (Part 1) This chart shows the percentage of consumers in each country that would prefer to use each channel to receive advice from a nurse or doctor about a minor issue.
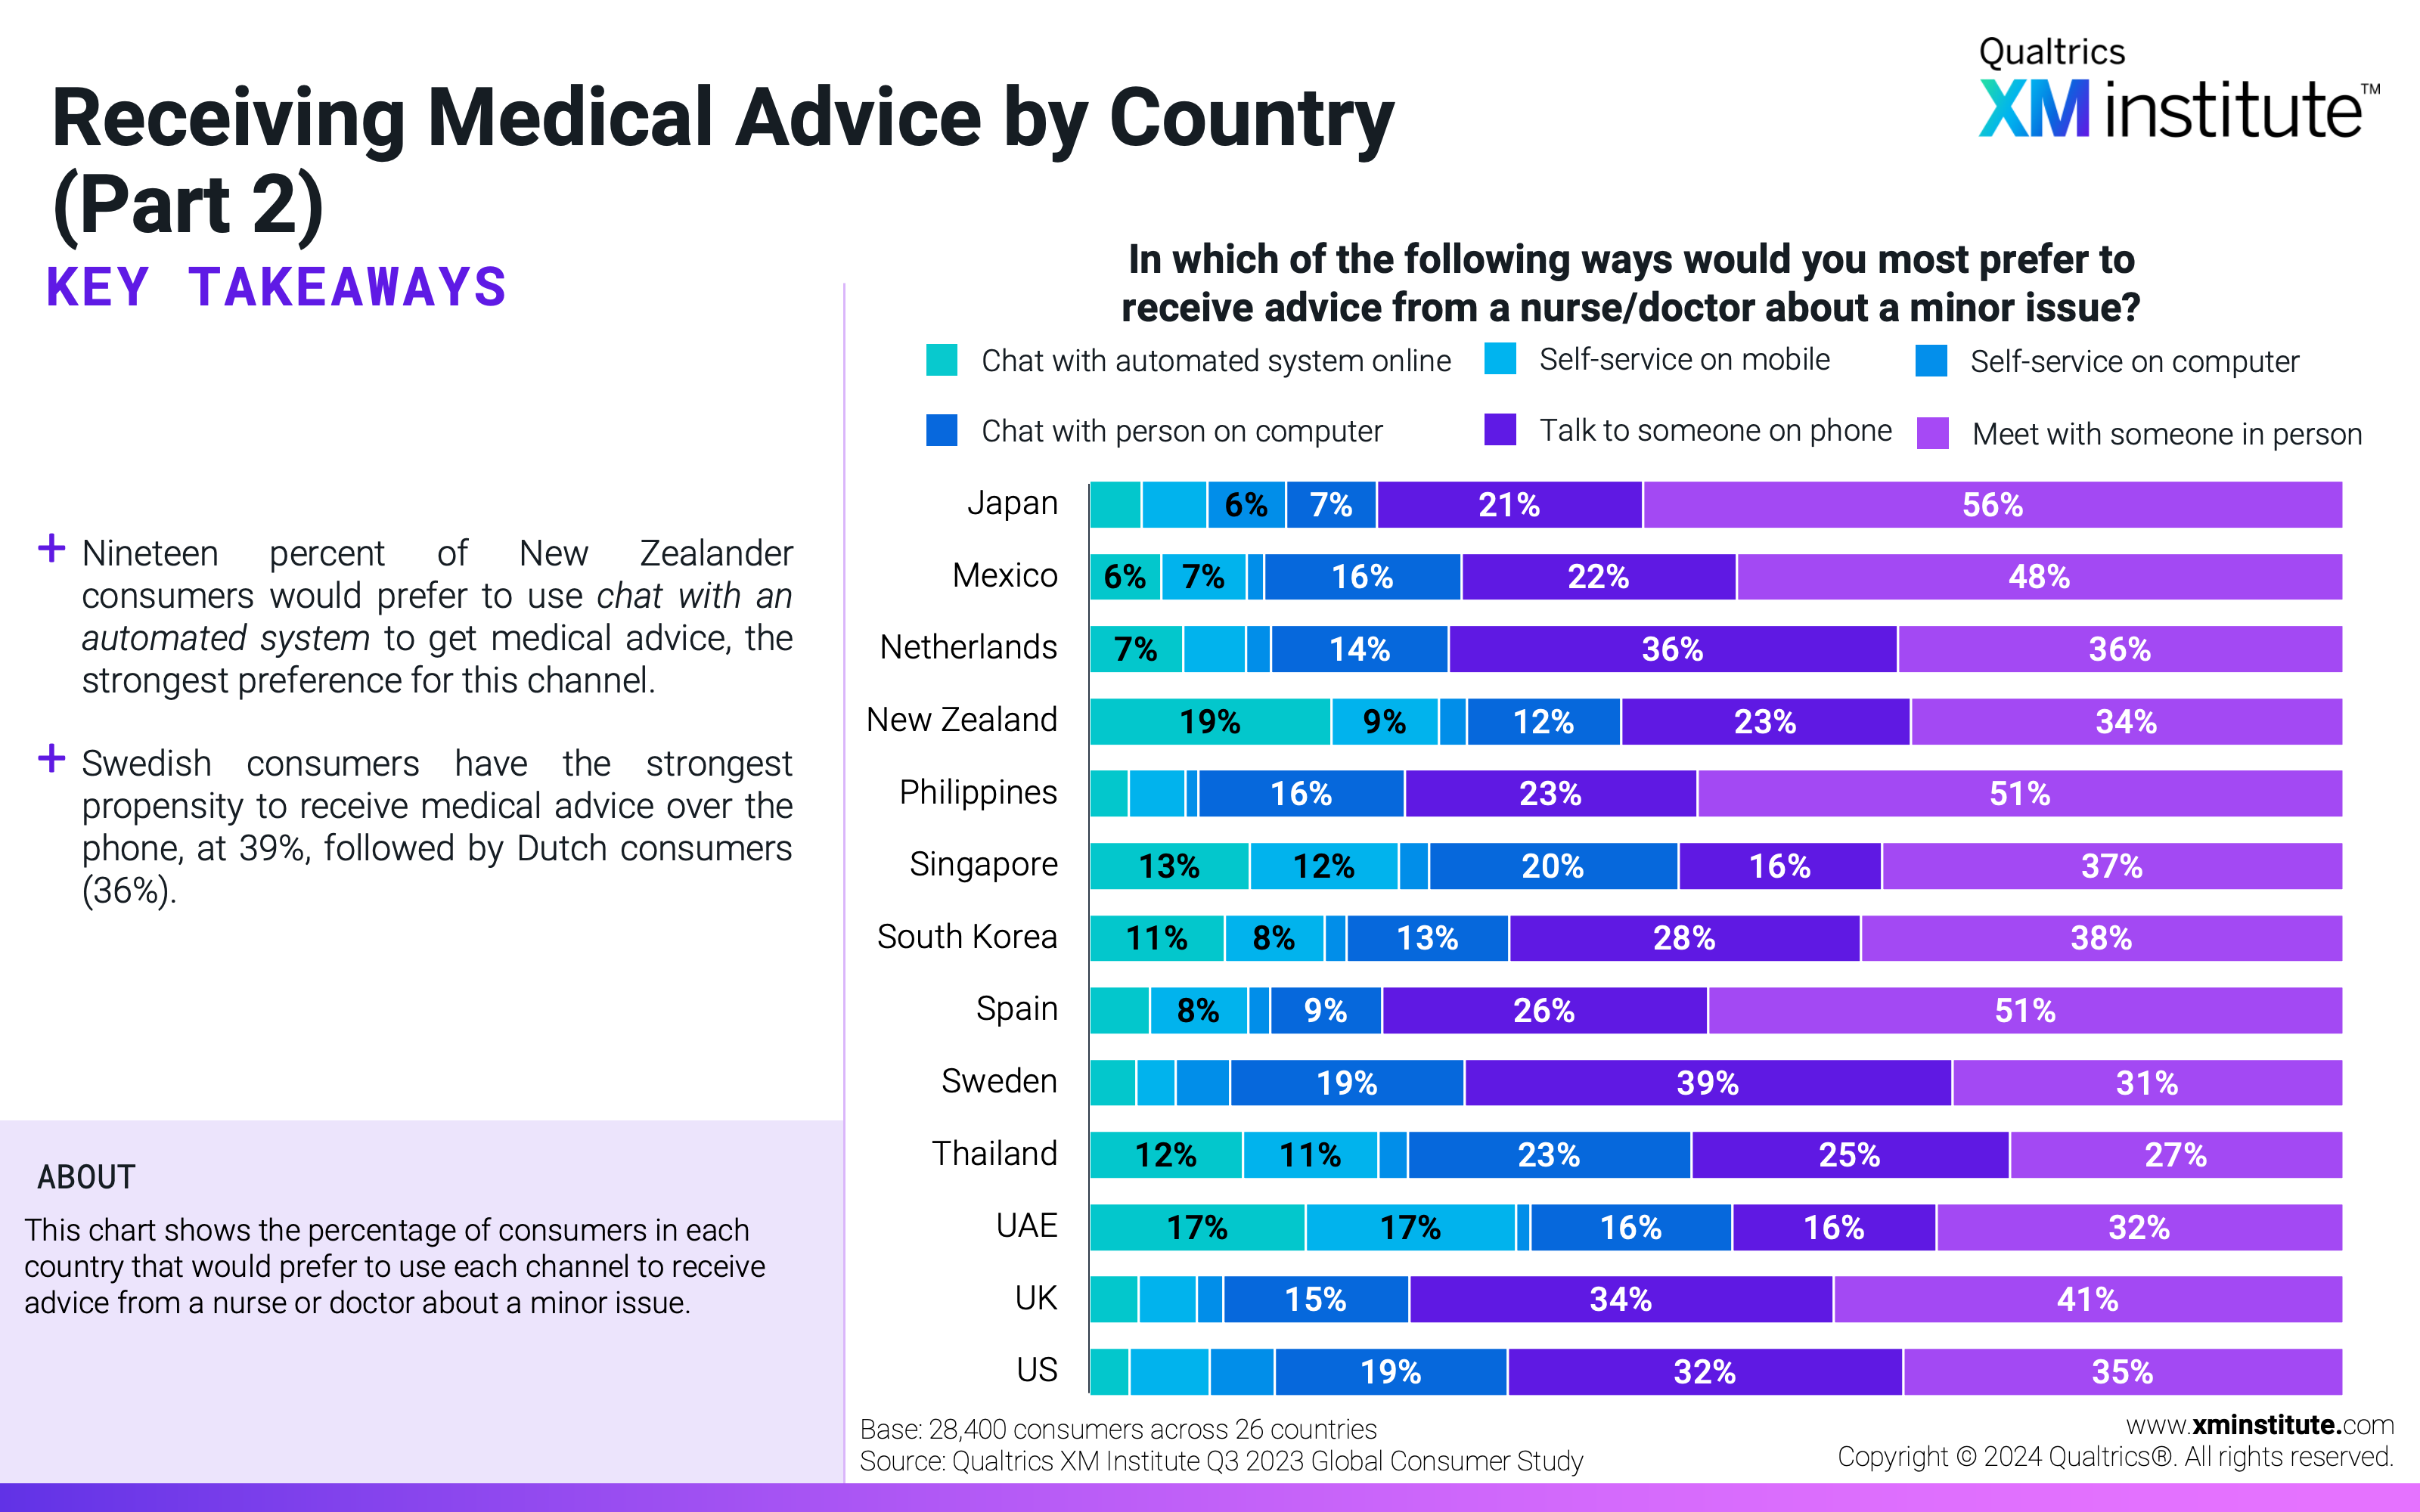
  30. Receiving Medical Advice by Country (Part 2) This chart shows the percentage of consumers in each country that would prefer to use each channel to receive advice from a nurse or doctor about a minor issue.
  31. Methodology This figure shows the methodology for the charts in the previous figures.