Key Findings
As part of Qualtrics XM Institute’s 2023 Global Consumer Study, more than 28,000 consumers told us about their recent bad experiences with organizations across 20 industries and how they changed their spending after that bad experience. To understand year-over-year changes in customer perception and behavior, we compared these results to our findings in the Q3 2022 Global Consumer Study. We found that:
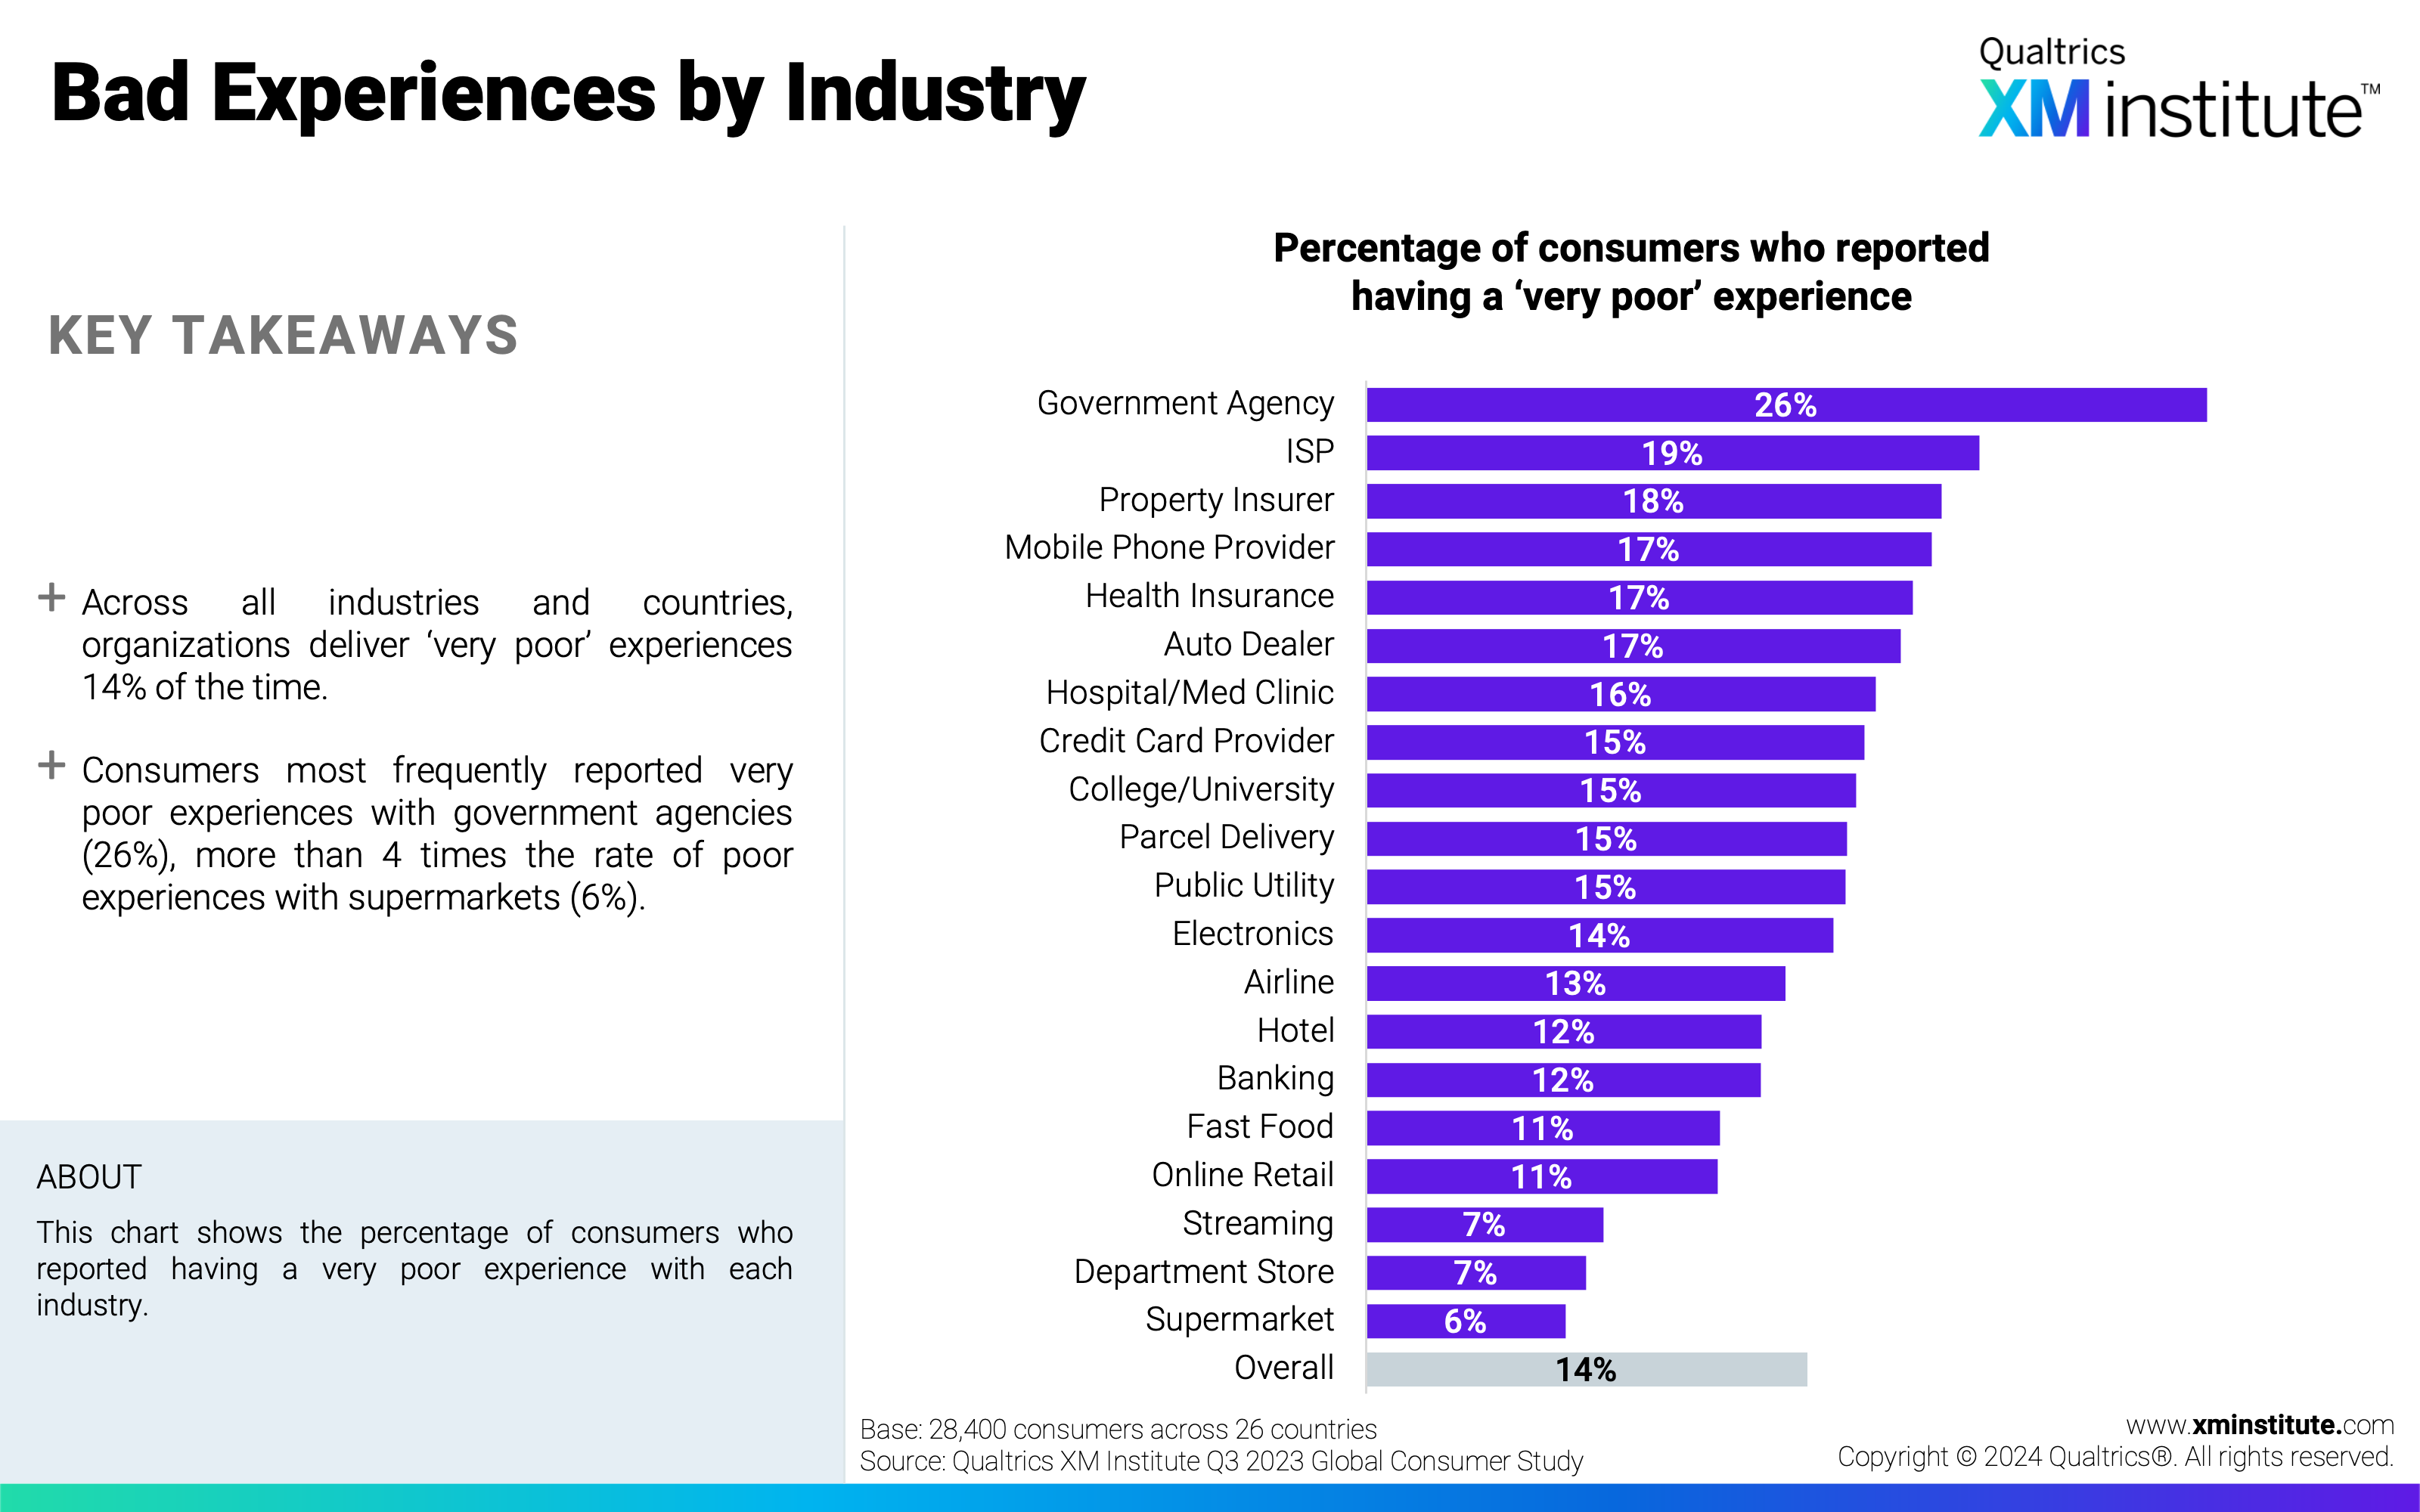
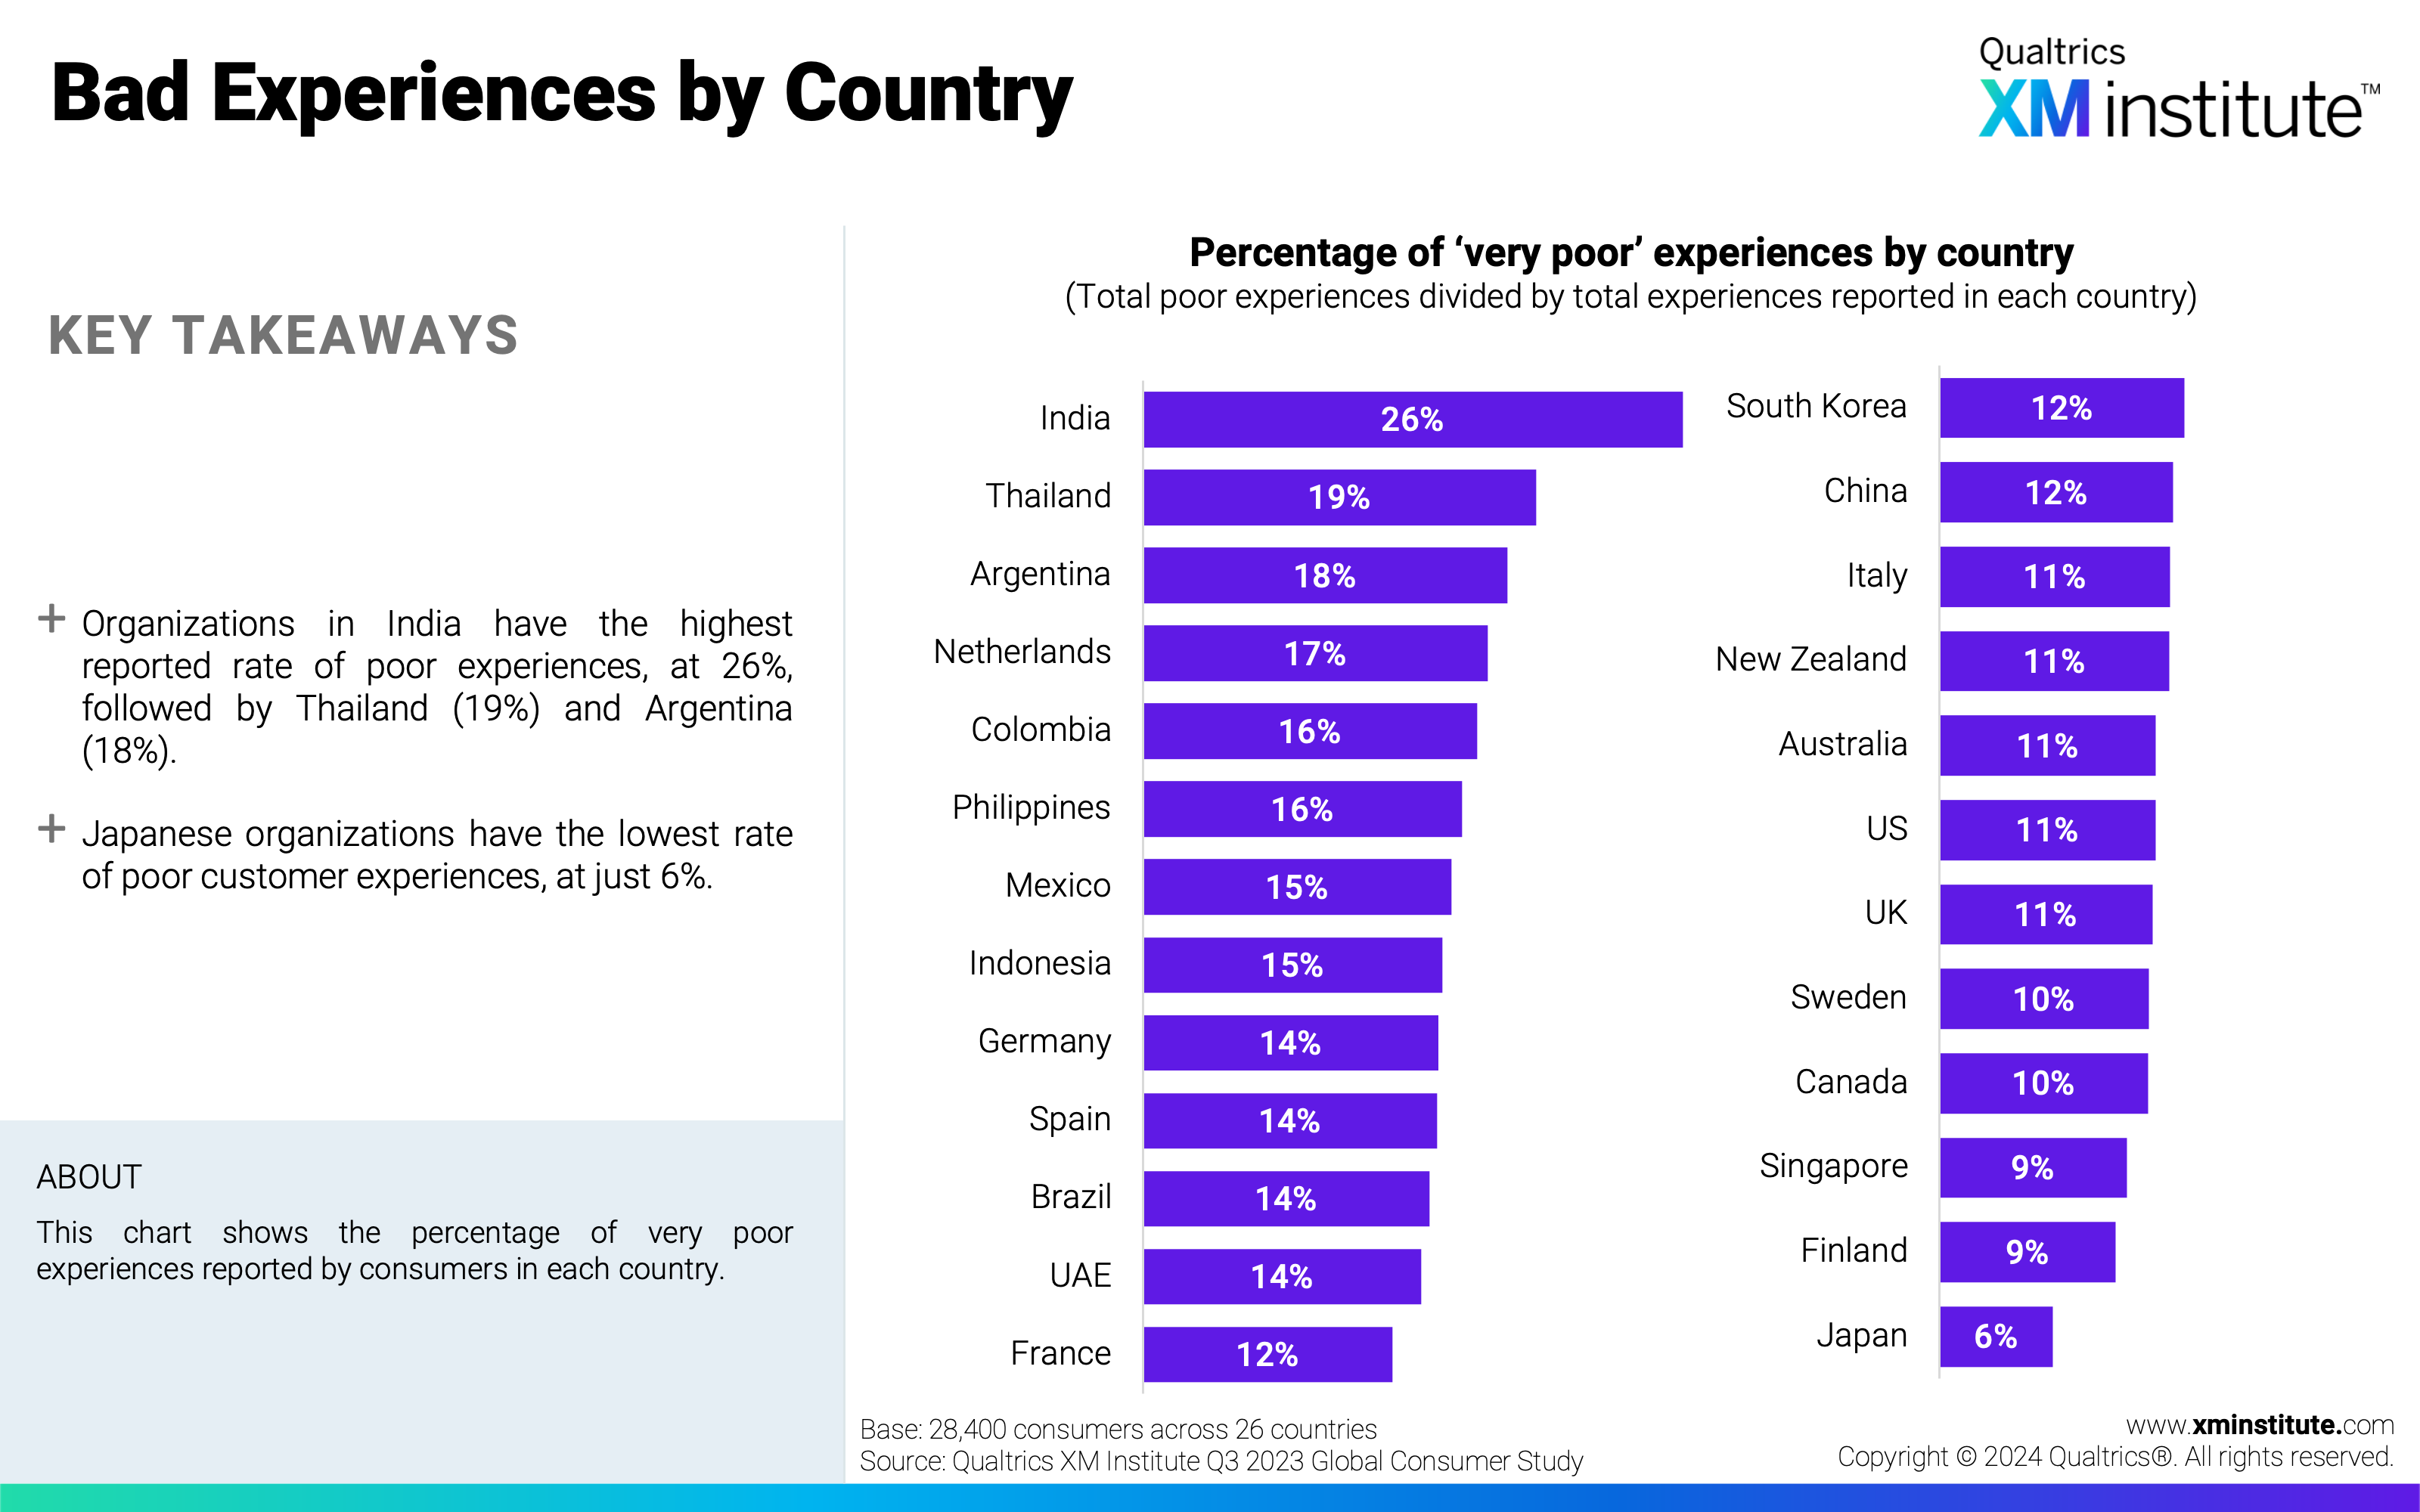
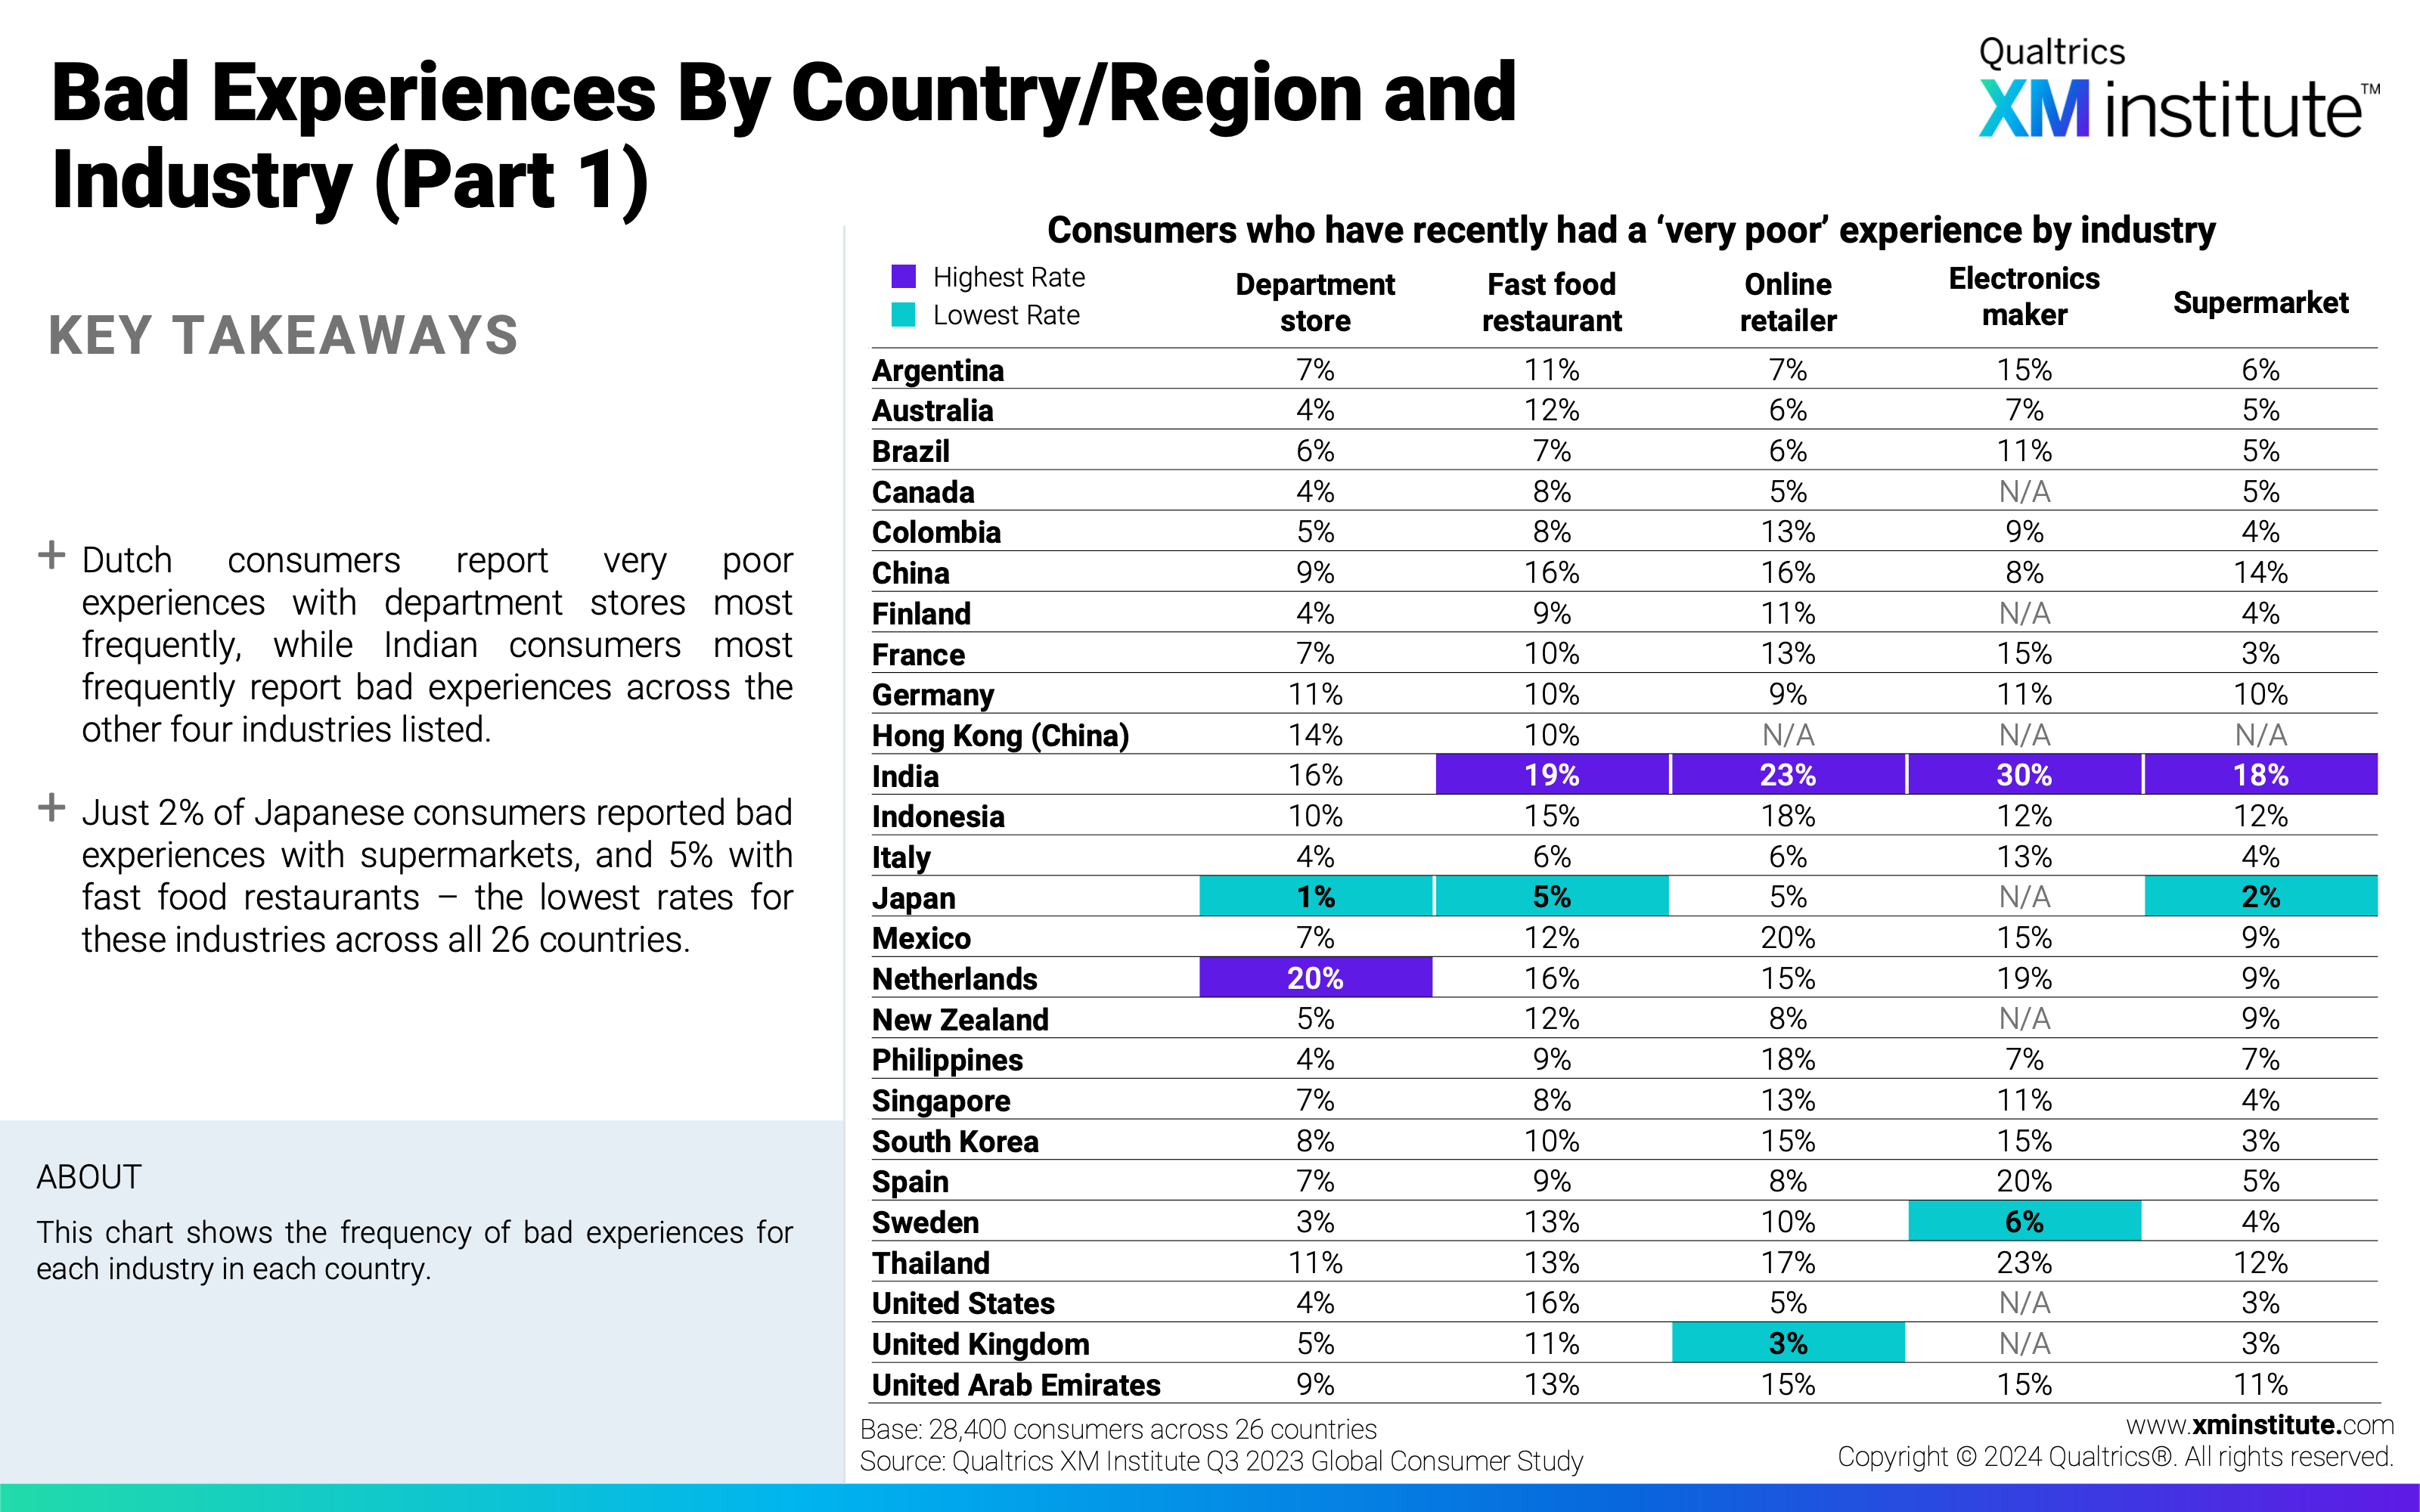
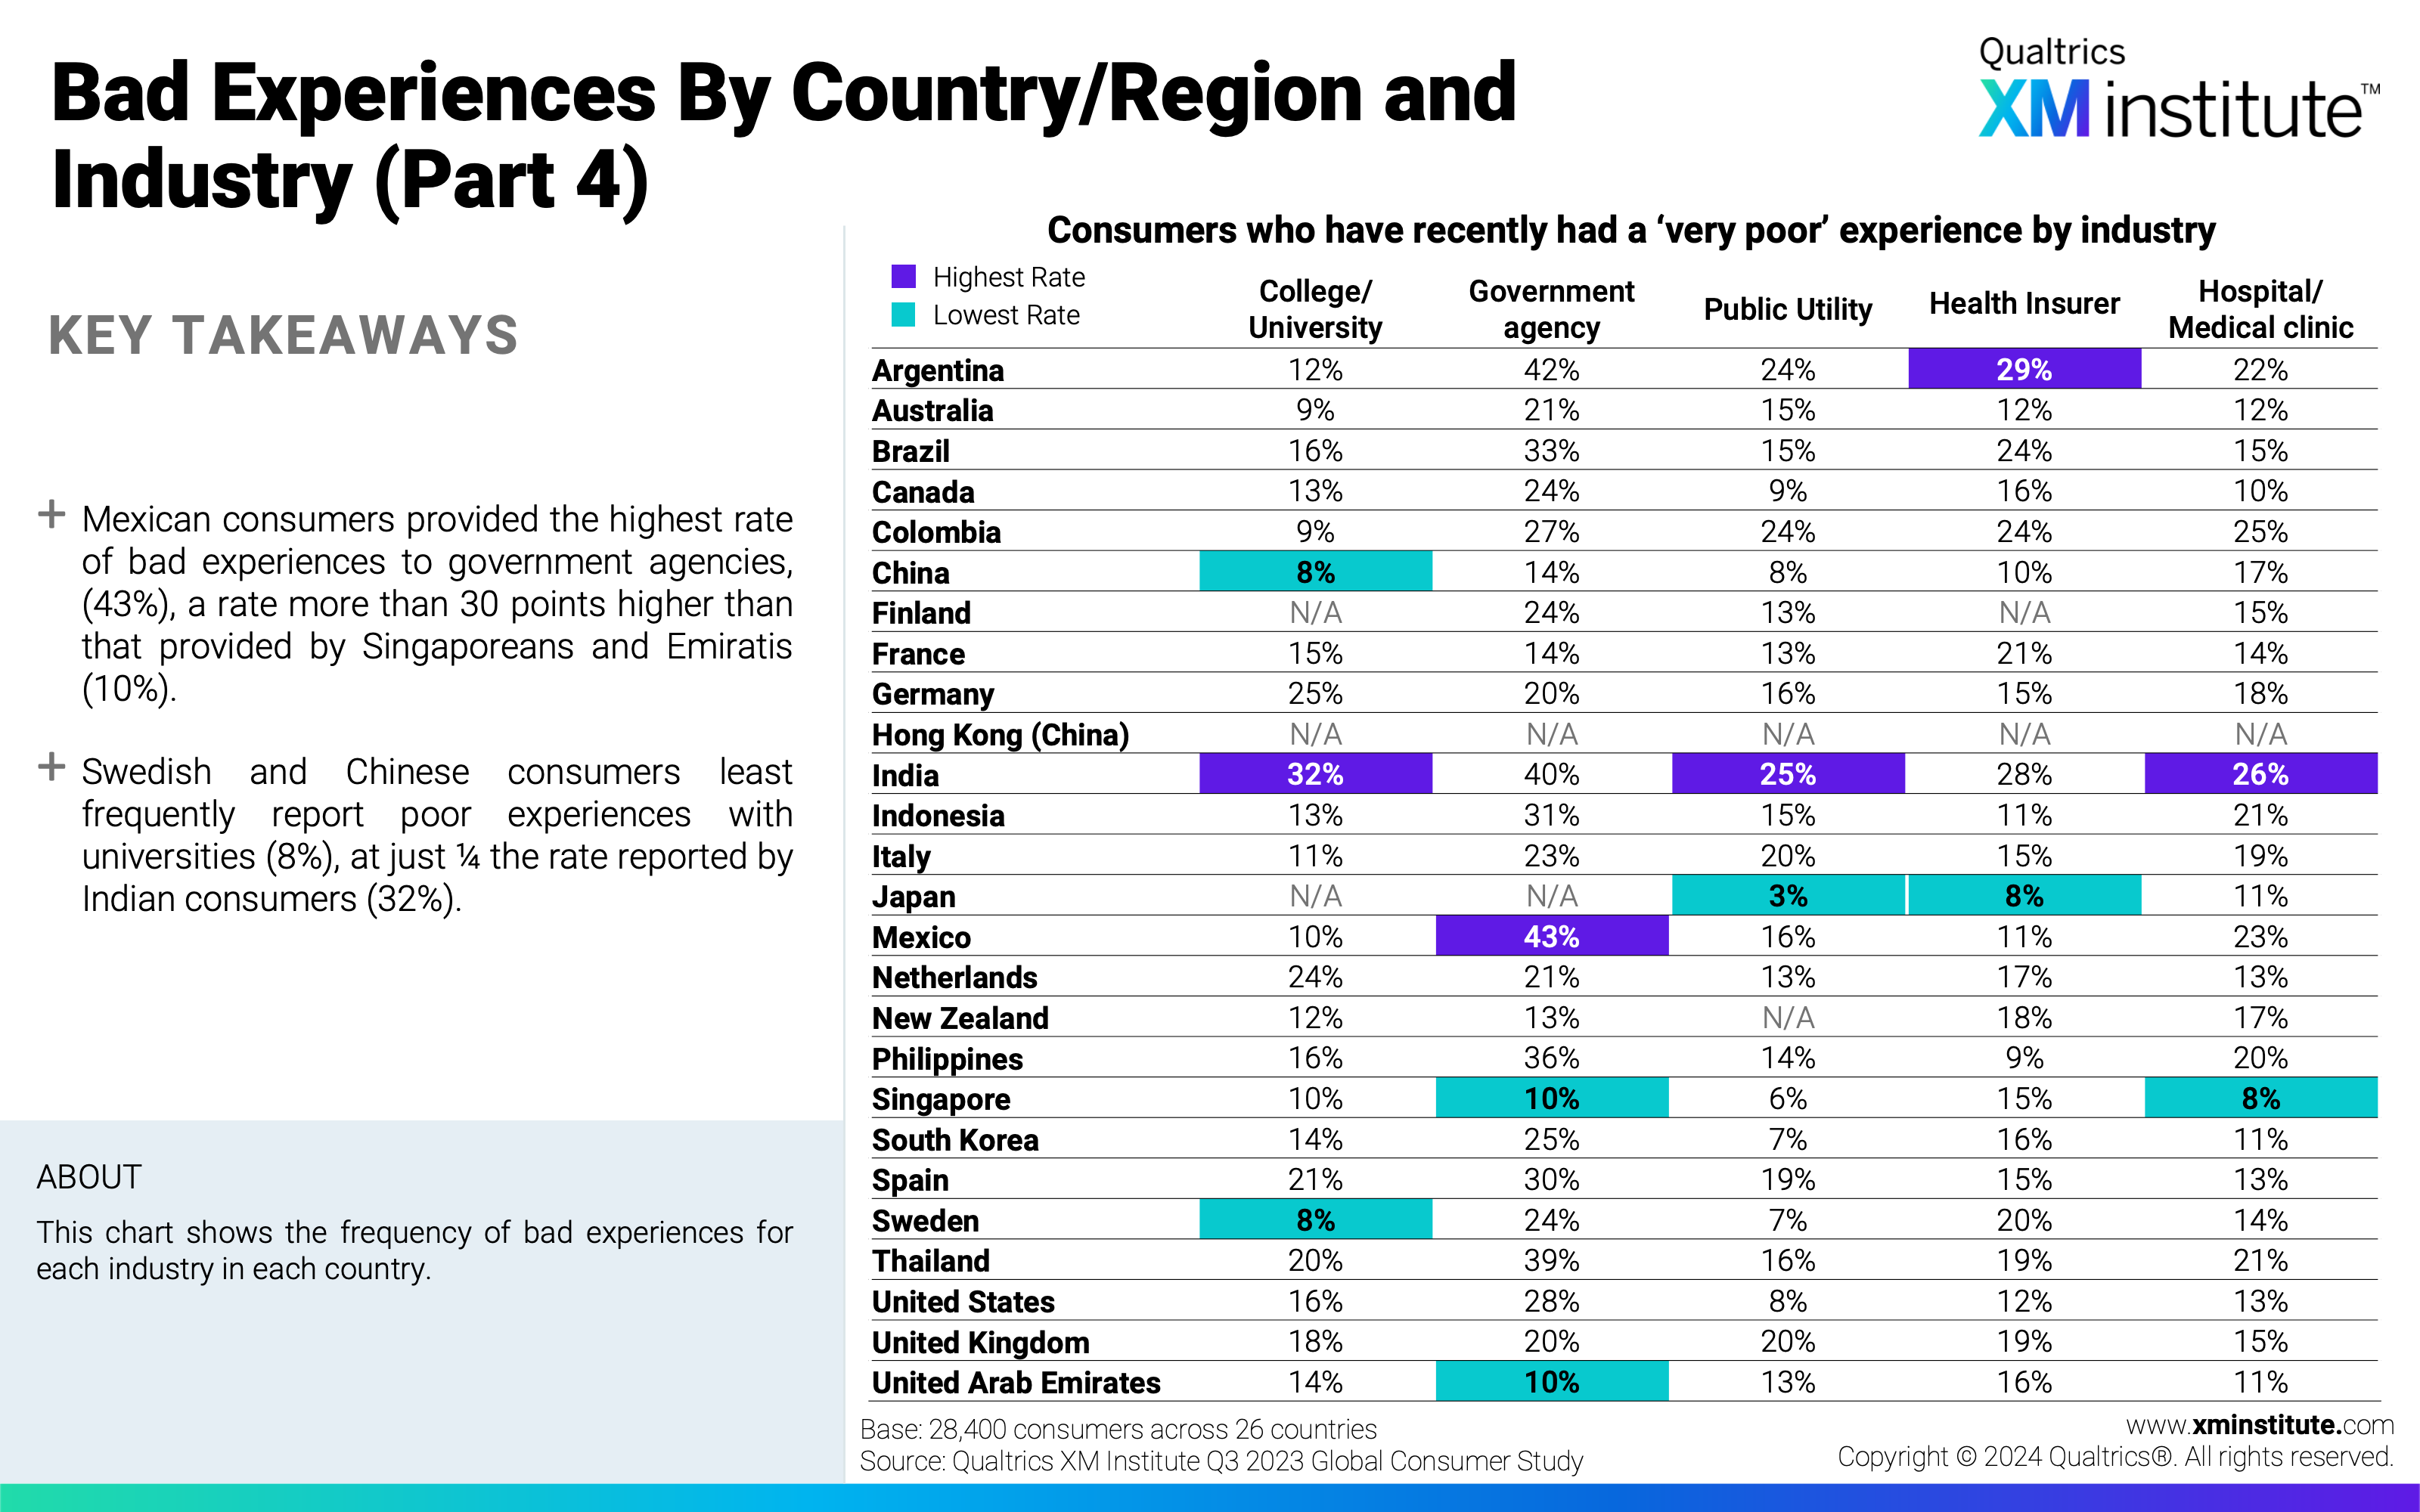
- Organizations disappoint in more than 1 in 10 experiences. Consumers reported that 14% of recent experiences were ‘very poor,’ ranging from 26% in India to 6% in Japan. Government agencies in Mexico provided the highest rate of poor experiences; 43% of people who had an experience with this industry reported having a poor experience.
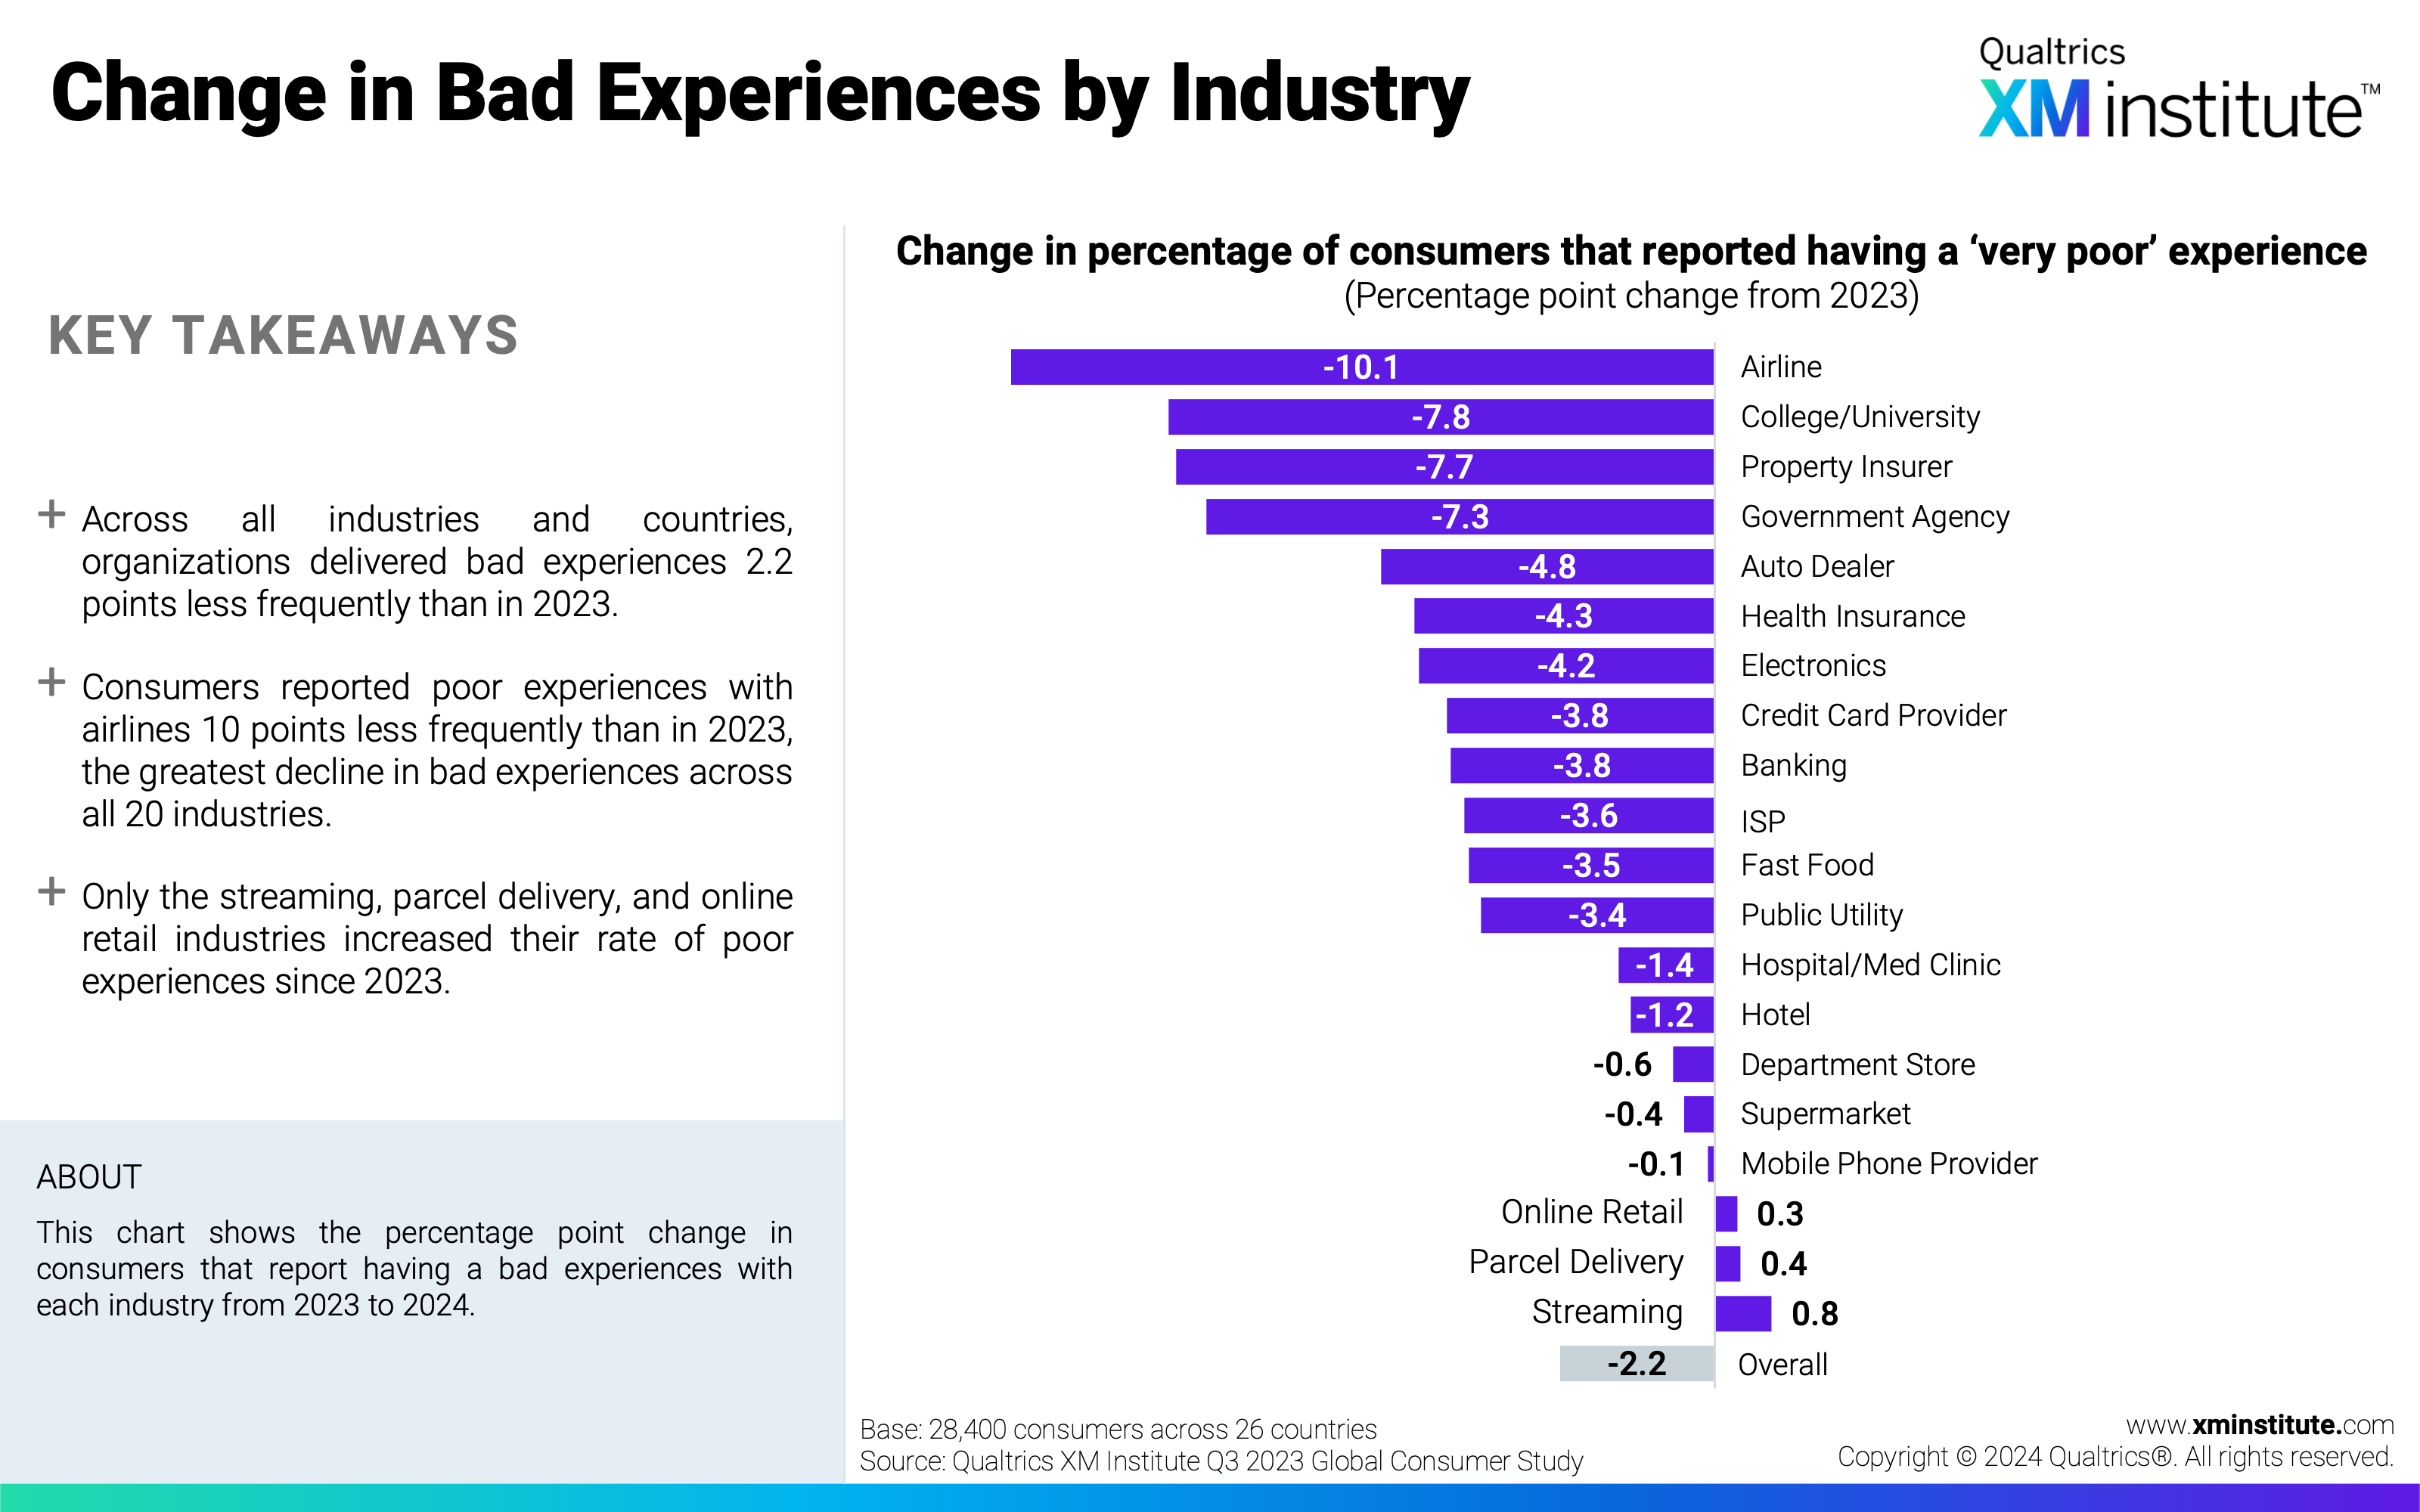
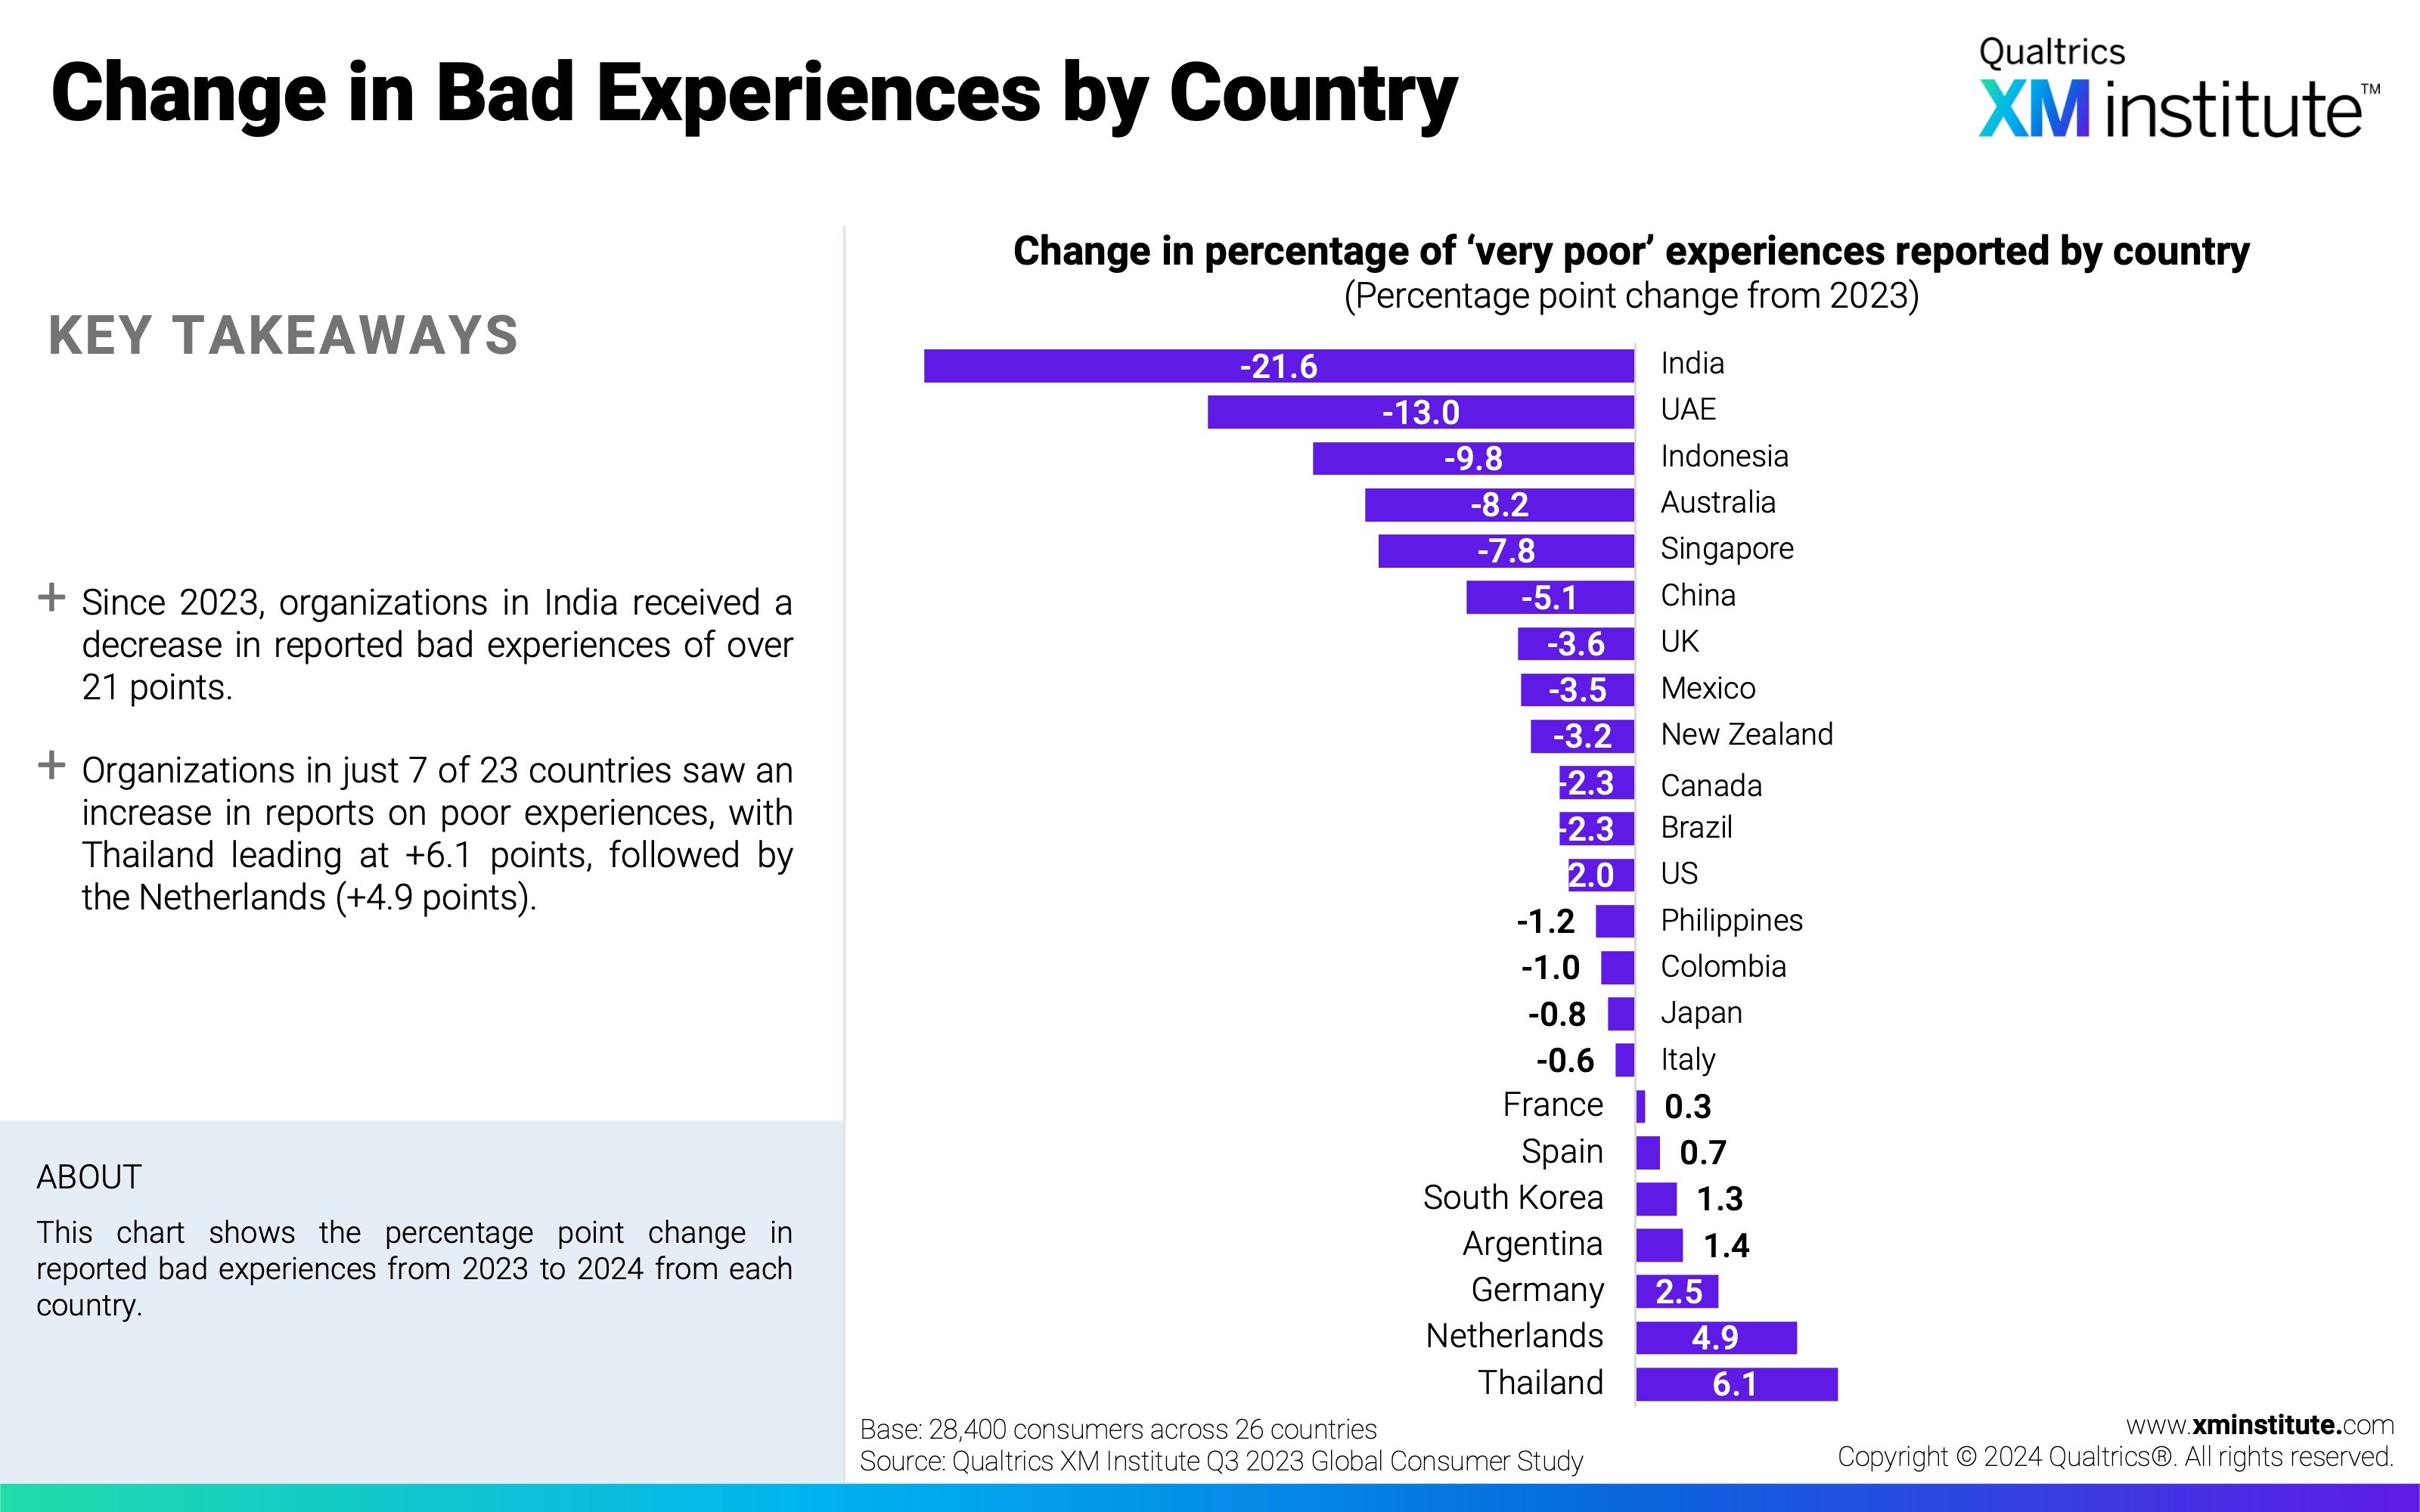
- The frequency of of bad experiences declined. Compared to 2023, organizations delivered poor experiences 2.2 percentage points less frequently. The rate of bad experiences declined for 17 of 20 industries and in 16 of 23 countries. Thai consumers reported the greatest increase in bad experiences (+6.1 points).
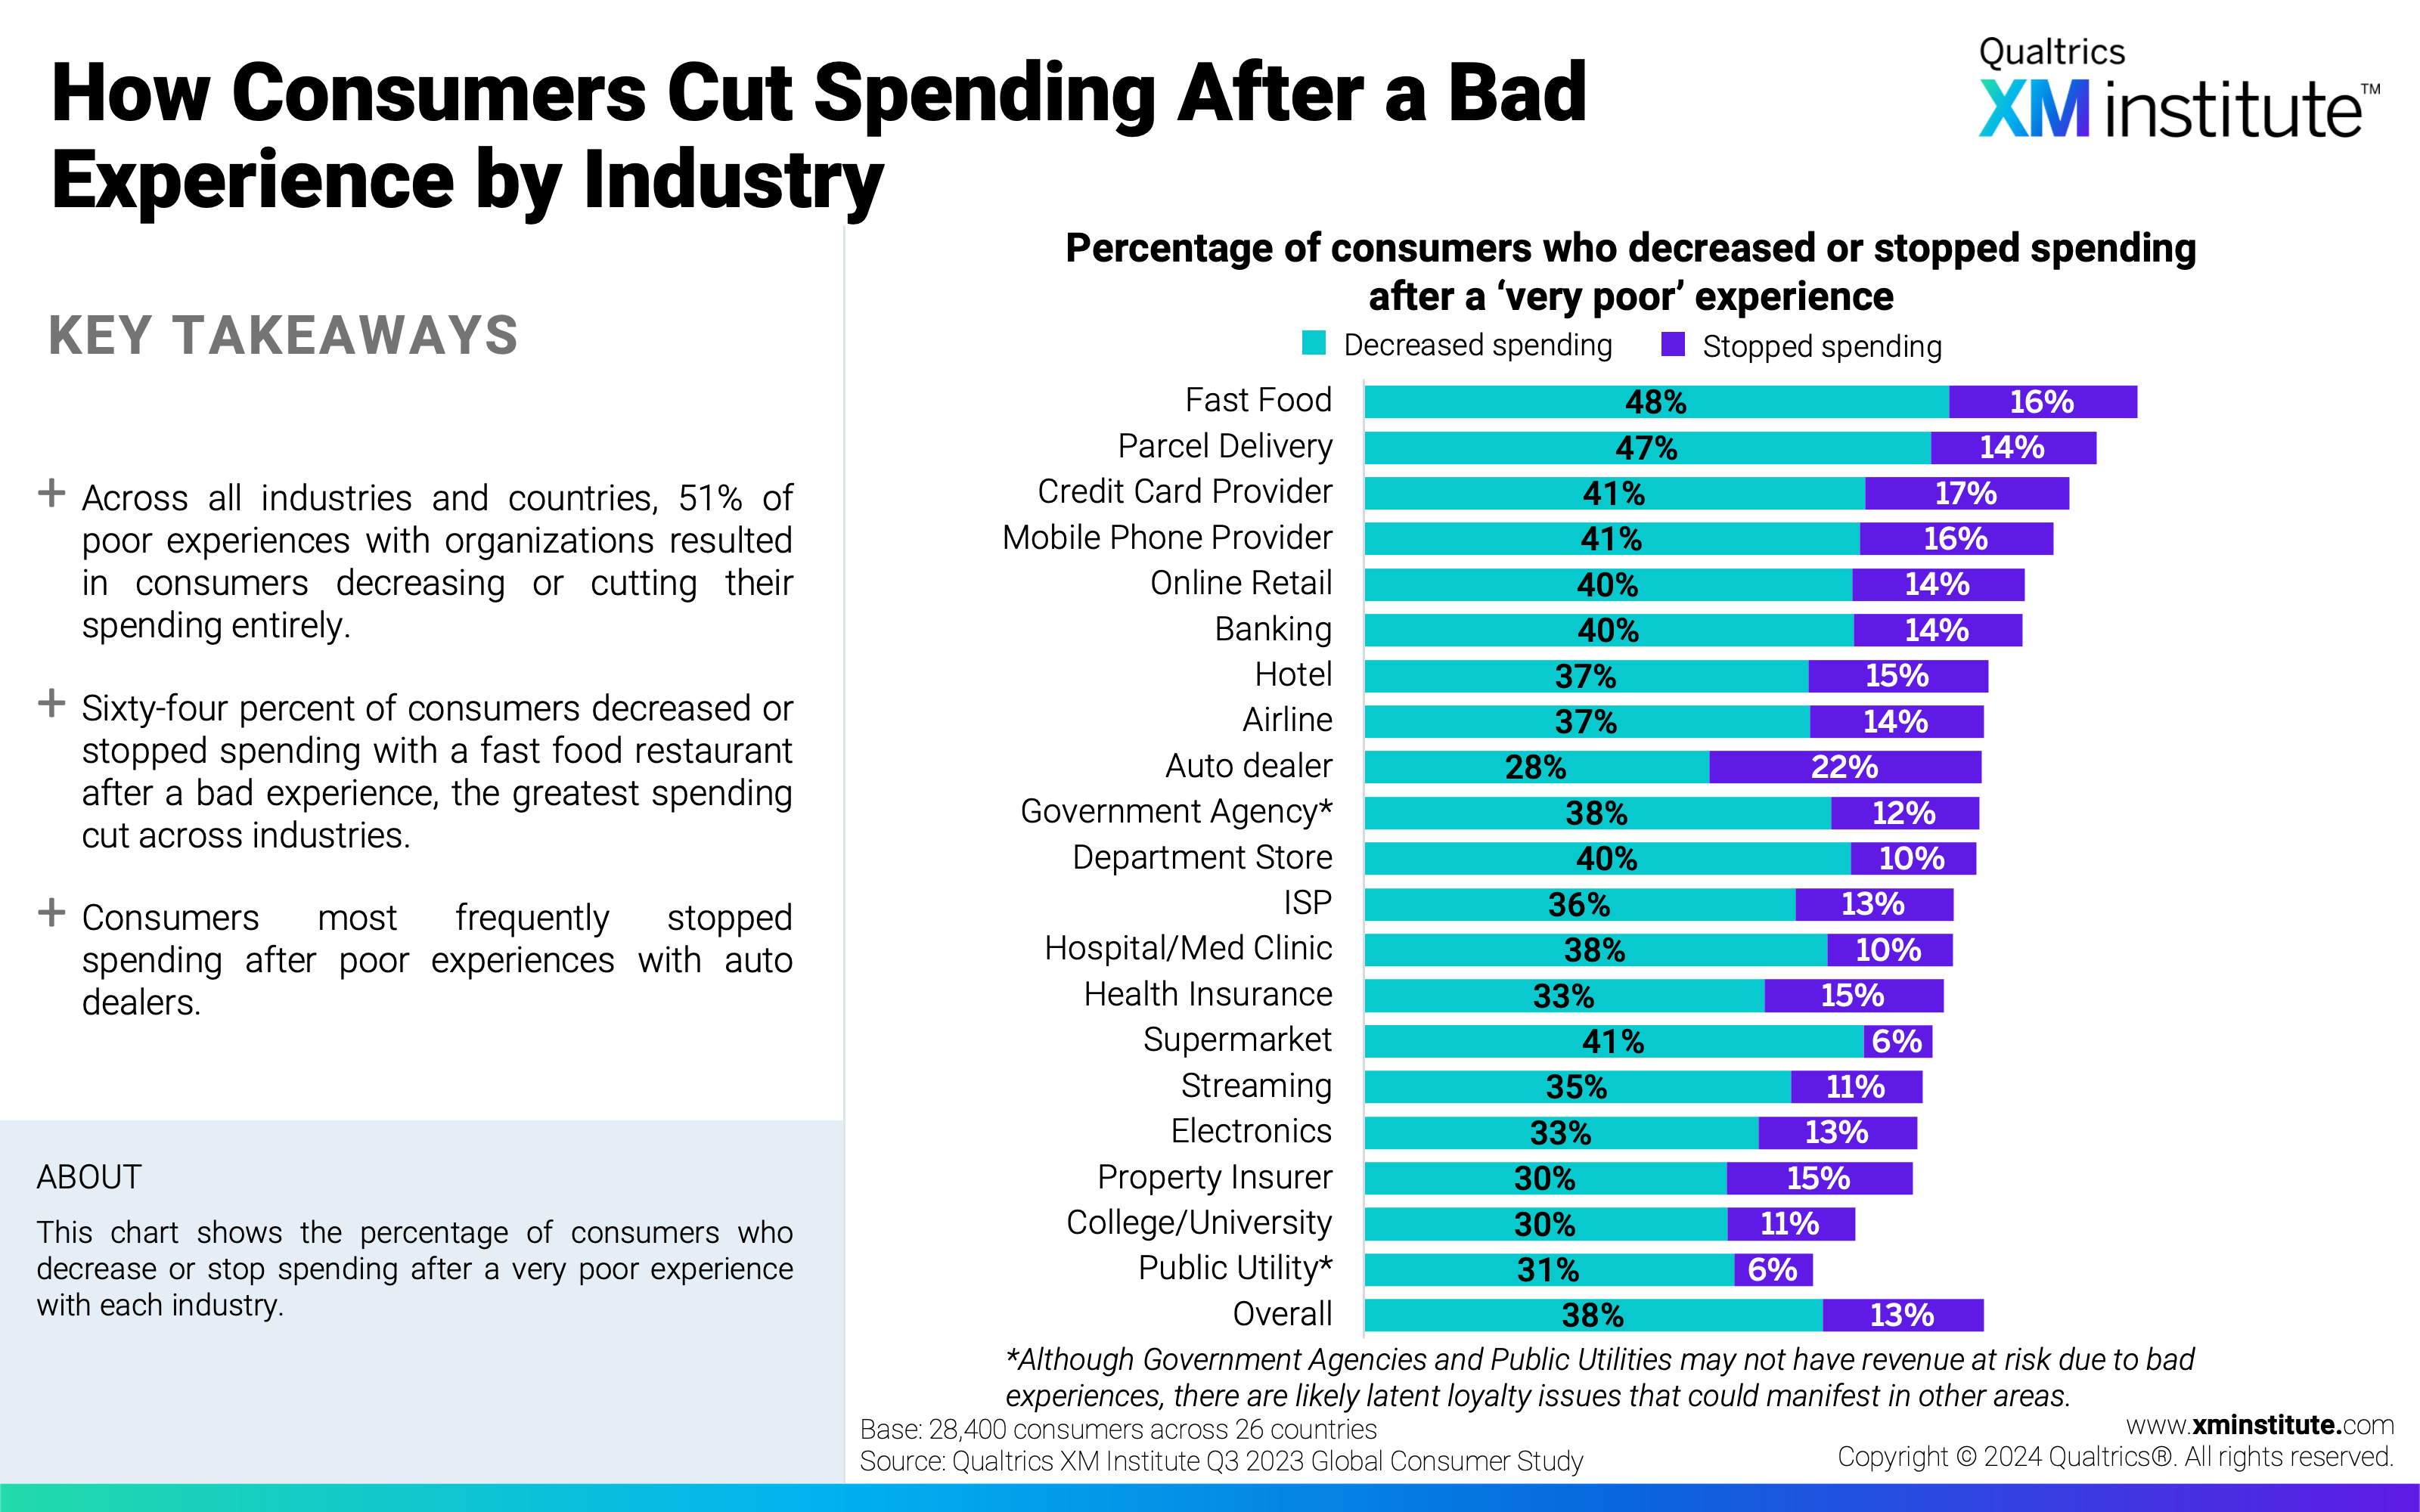
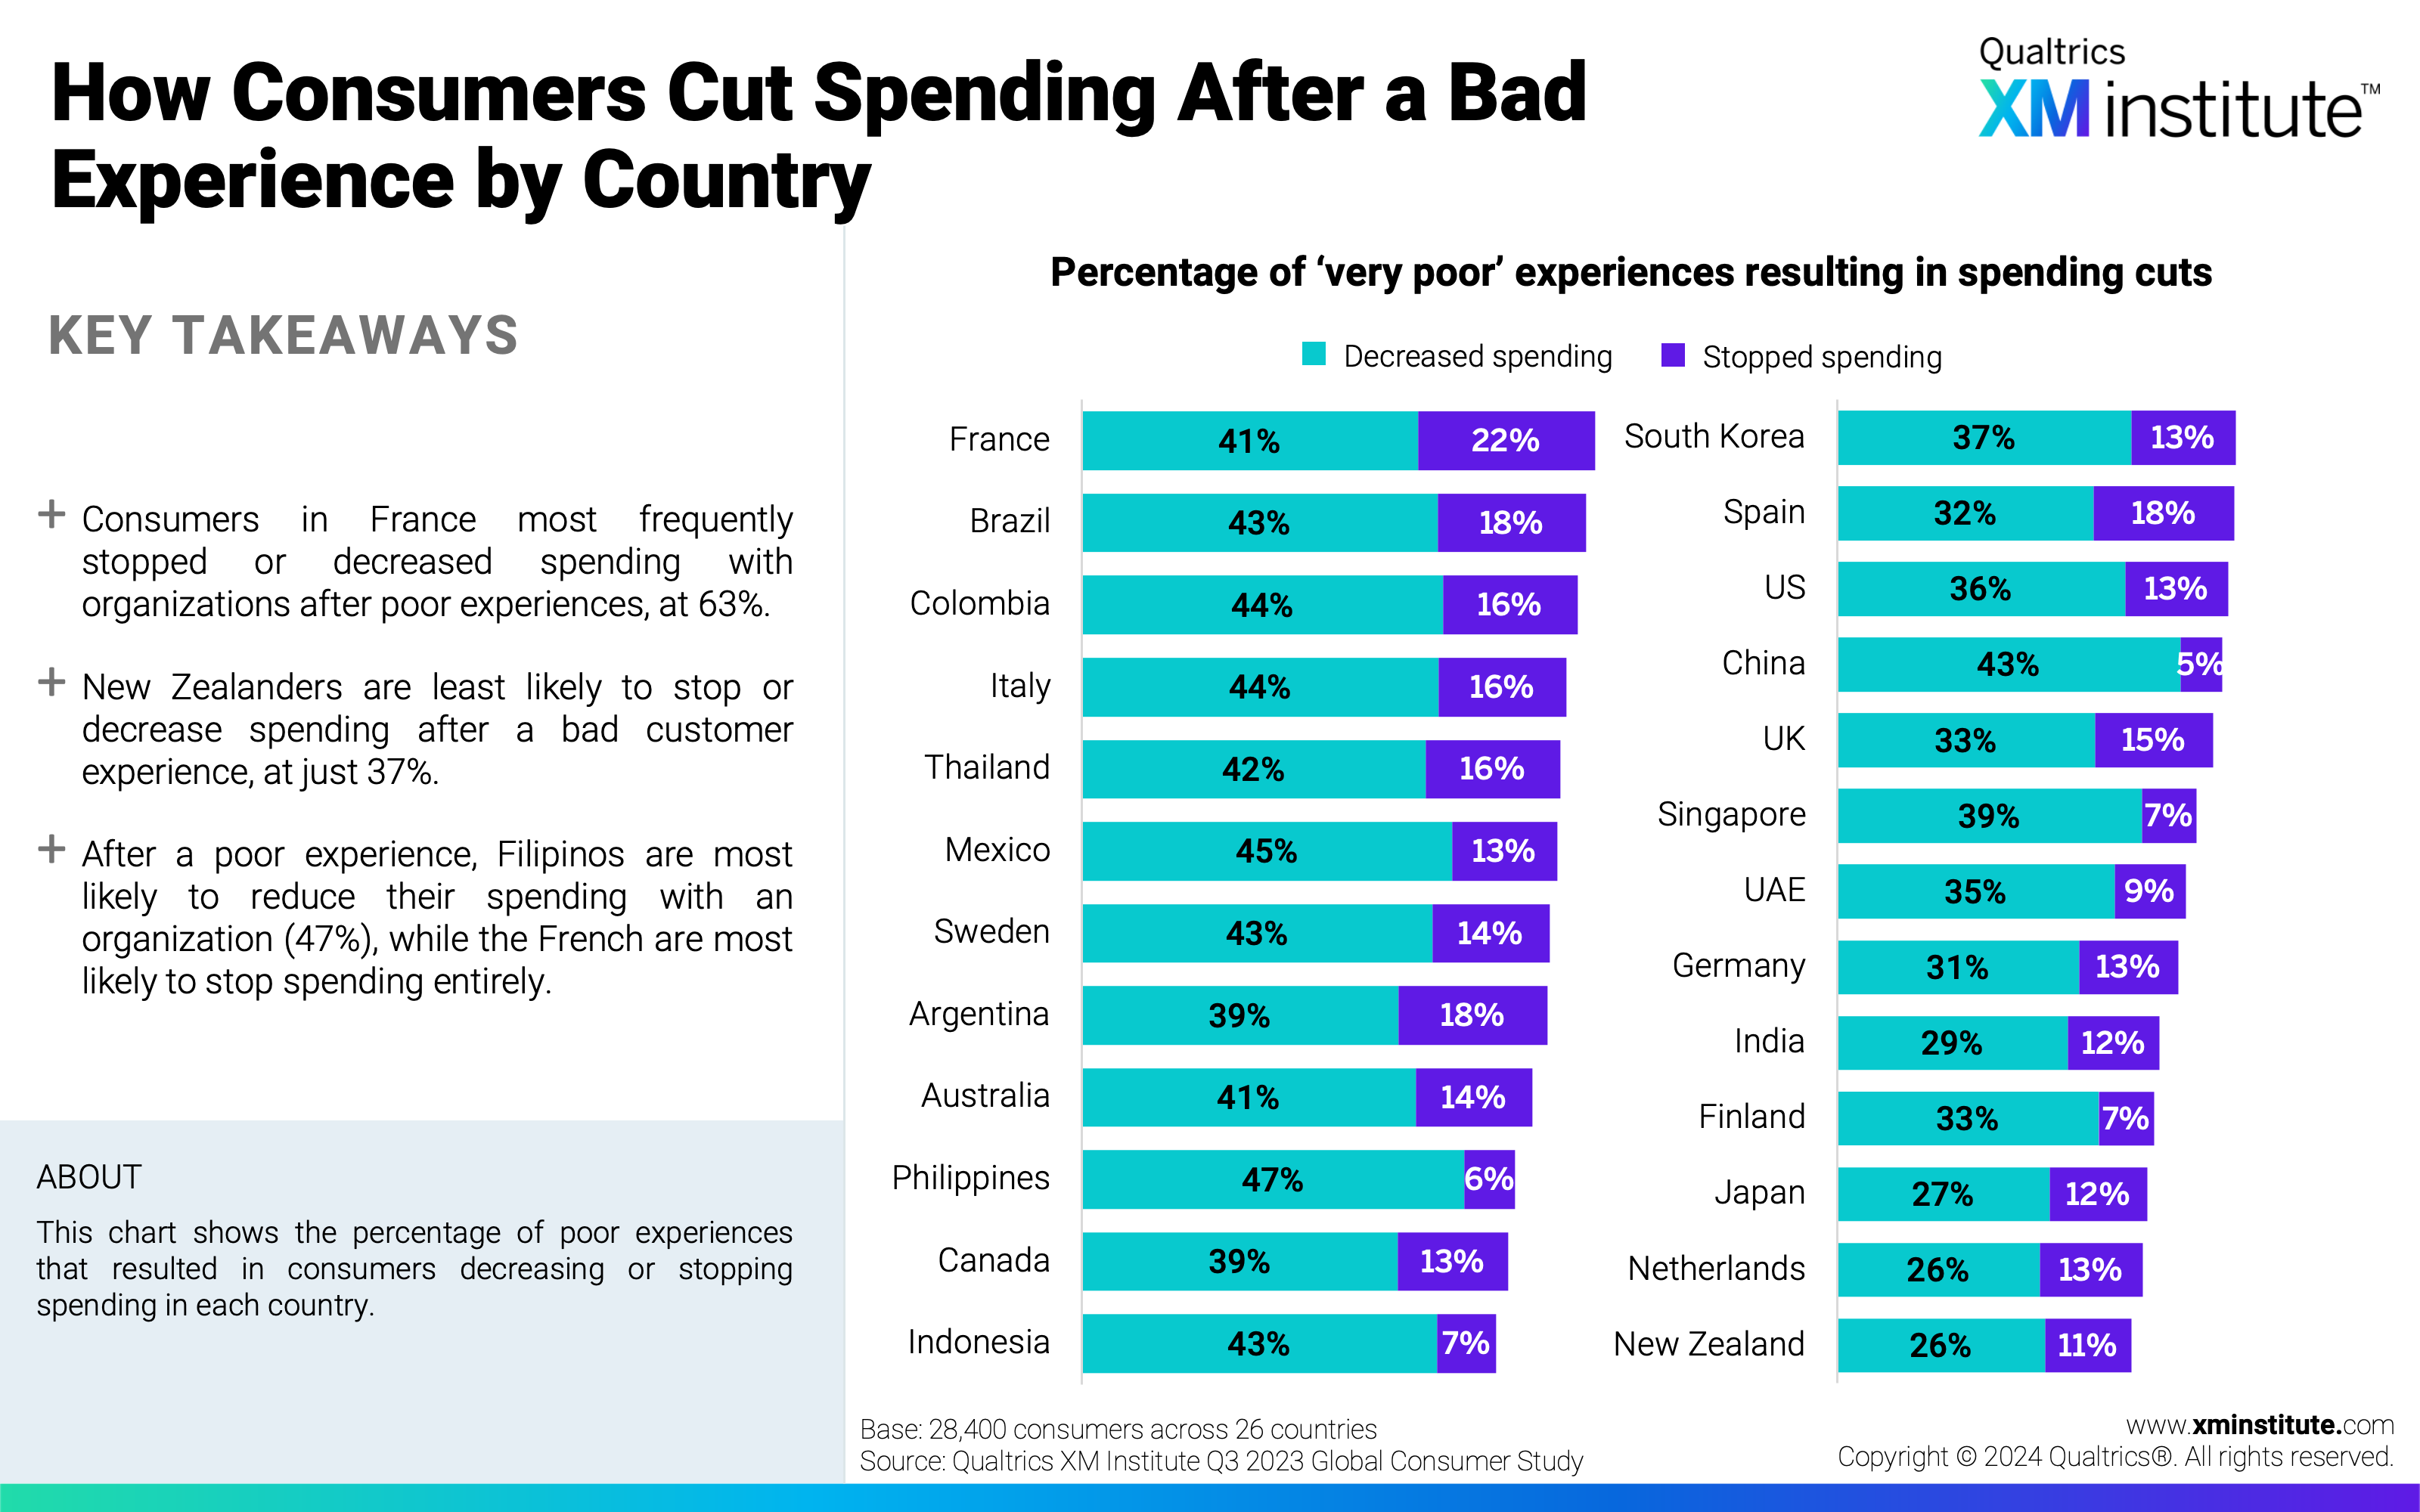
- Consumers cut spending after bad experiences. More than one-third of consumers reduce or stop spending after a poor experience with an organization, ranging from 37% of consumers cutting spending after a bad public utility experience to 64% after a poor fast food experience. French consumers have the highest propensity to cut spending, while New Zealanders are least likely to do so.
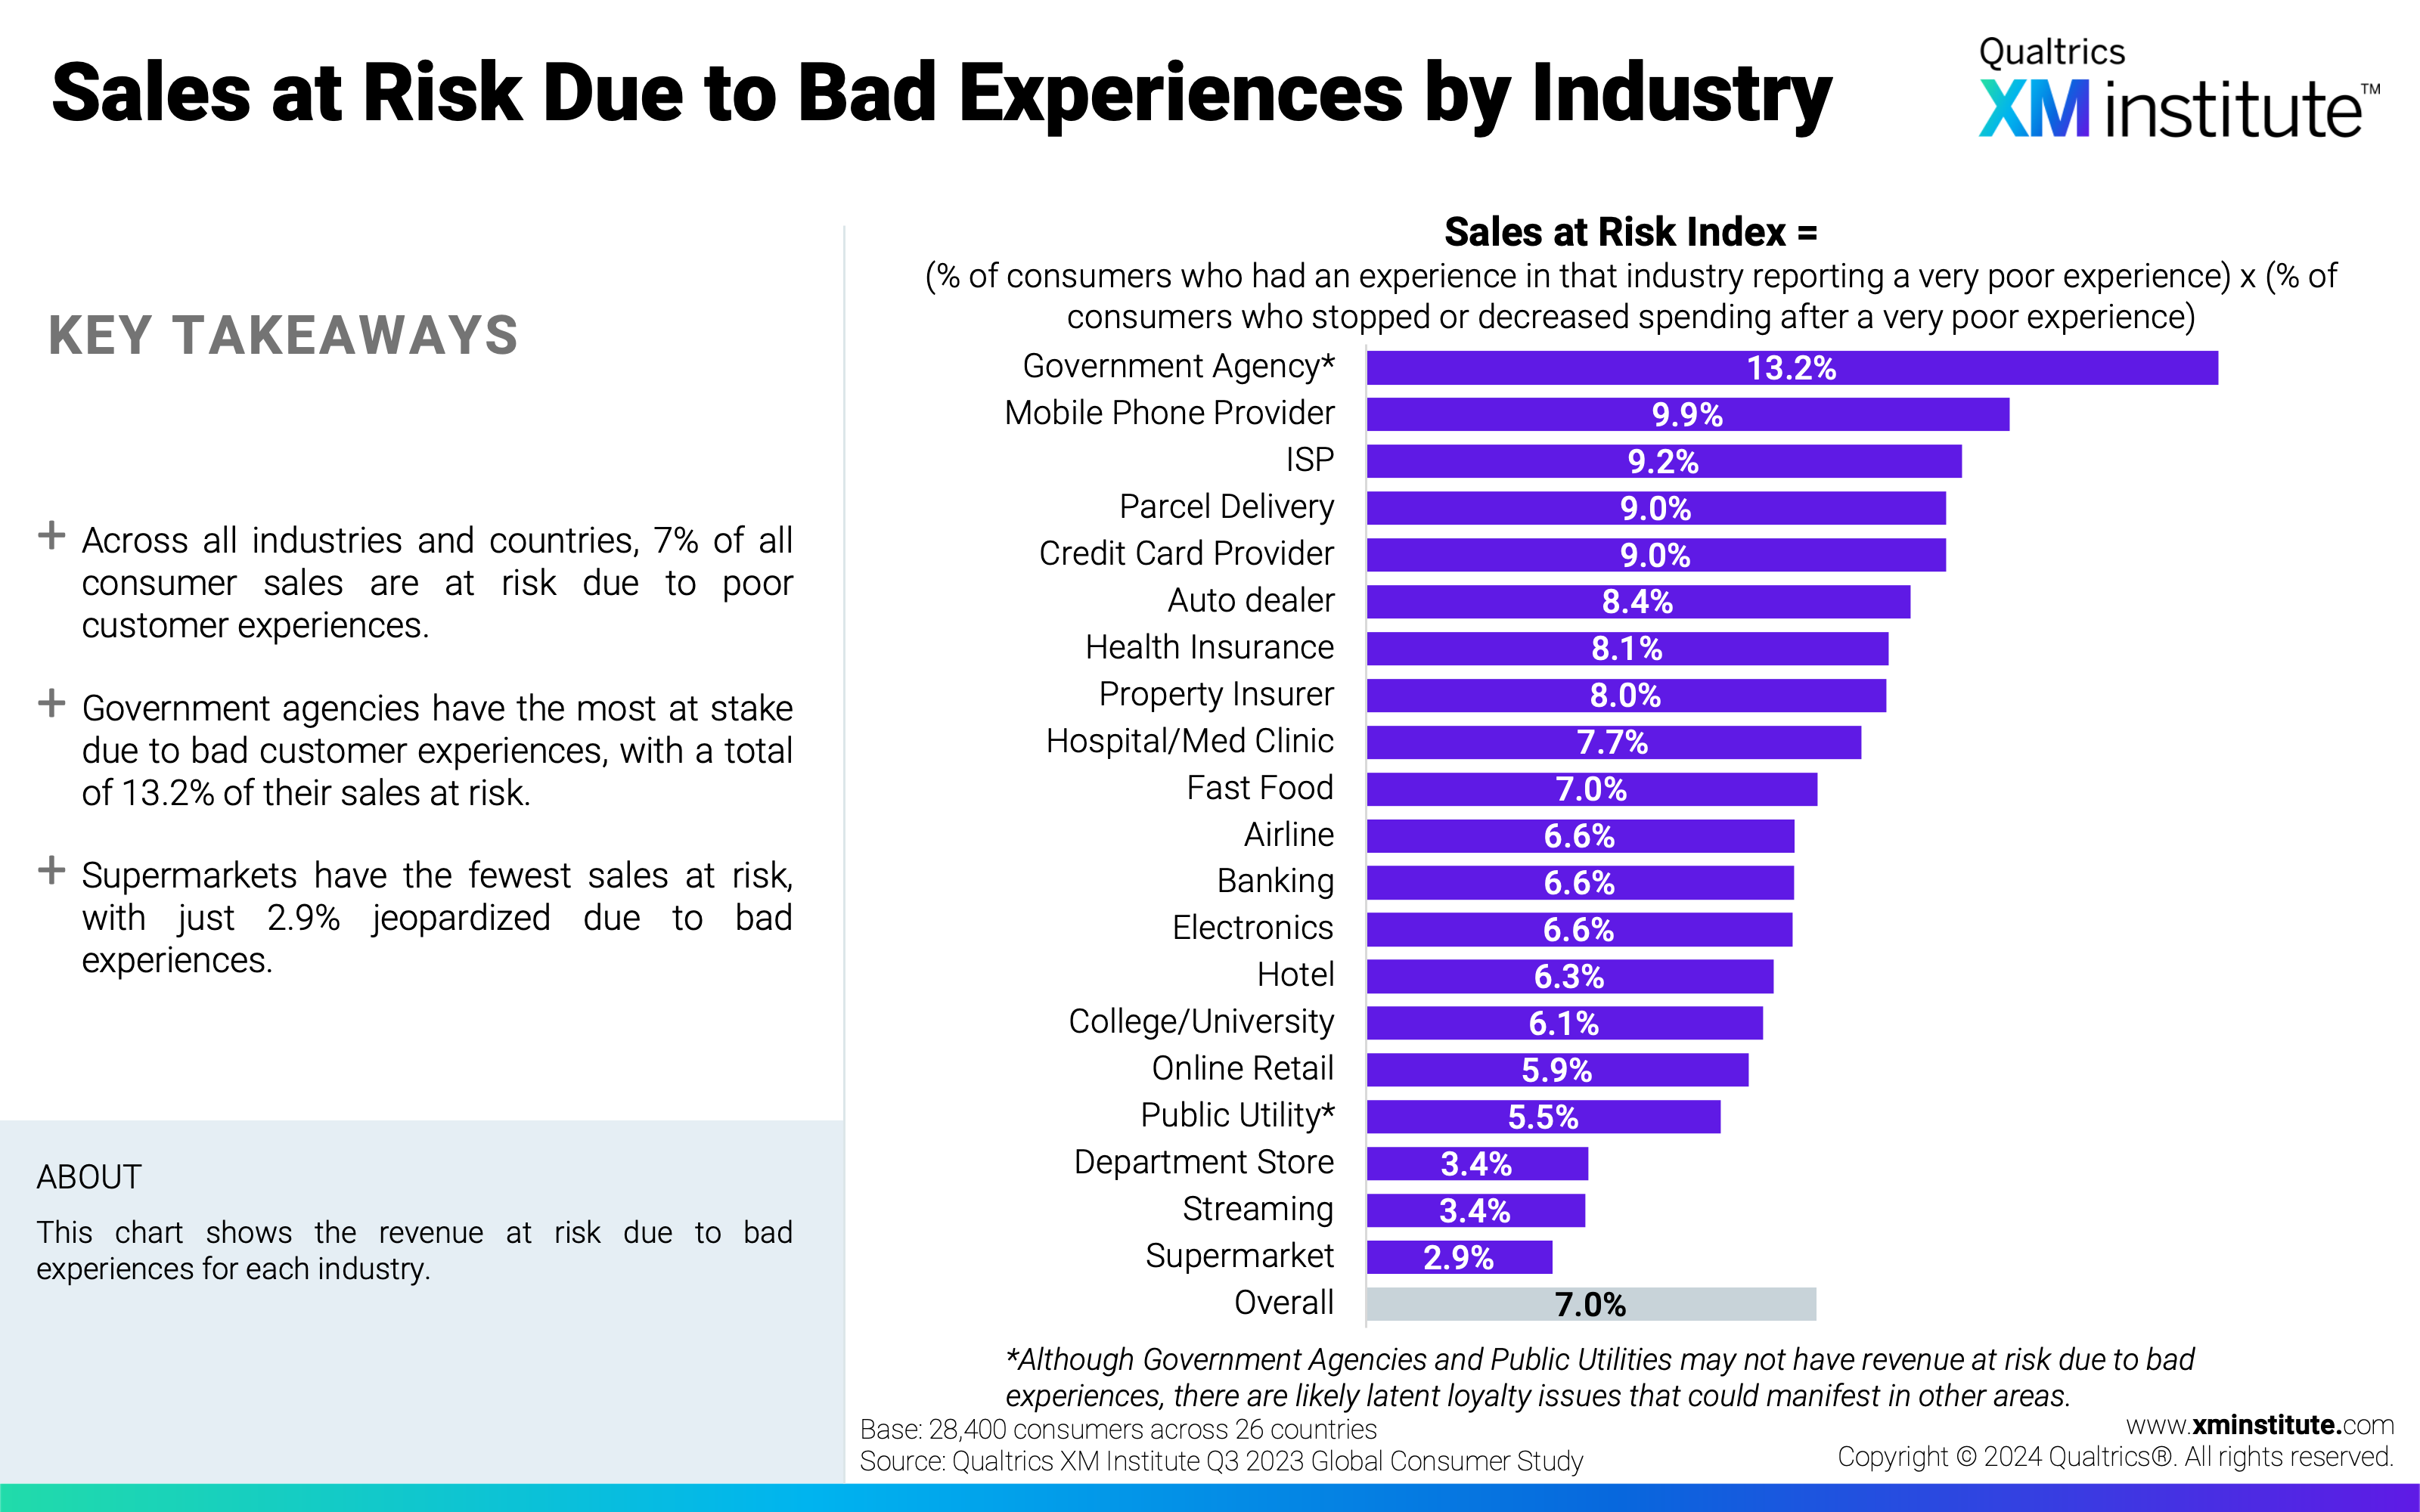
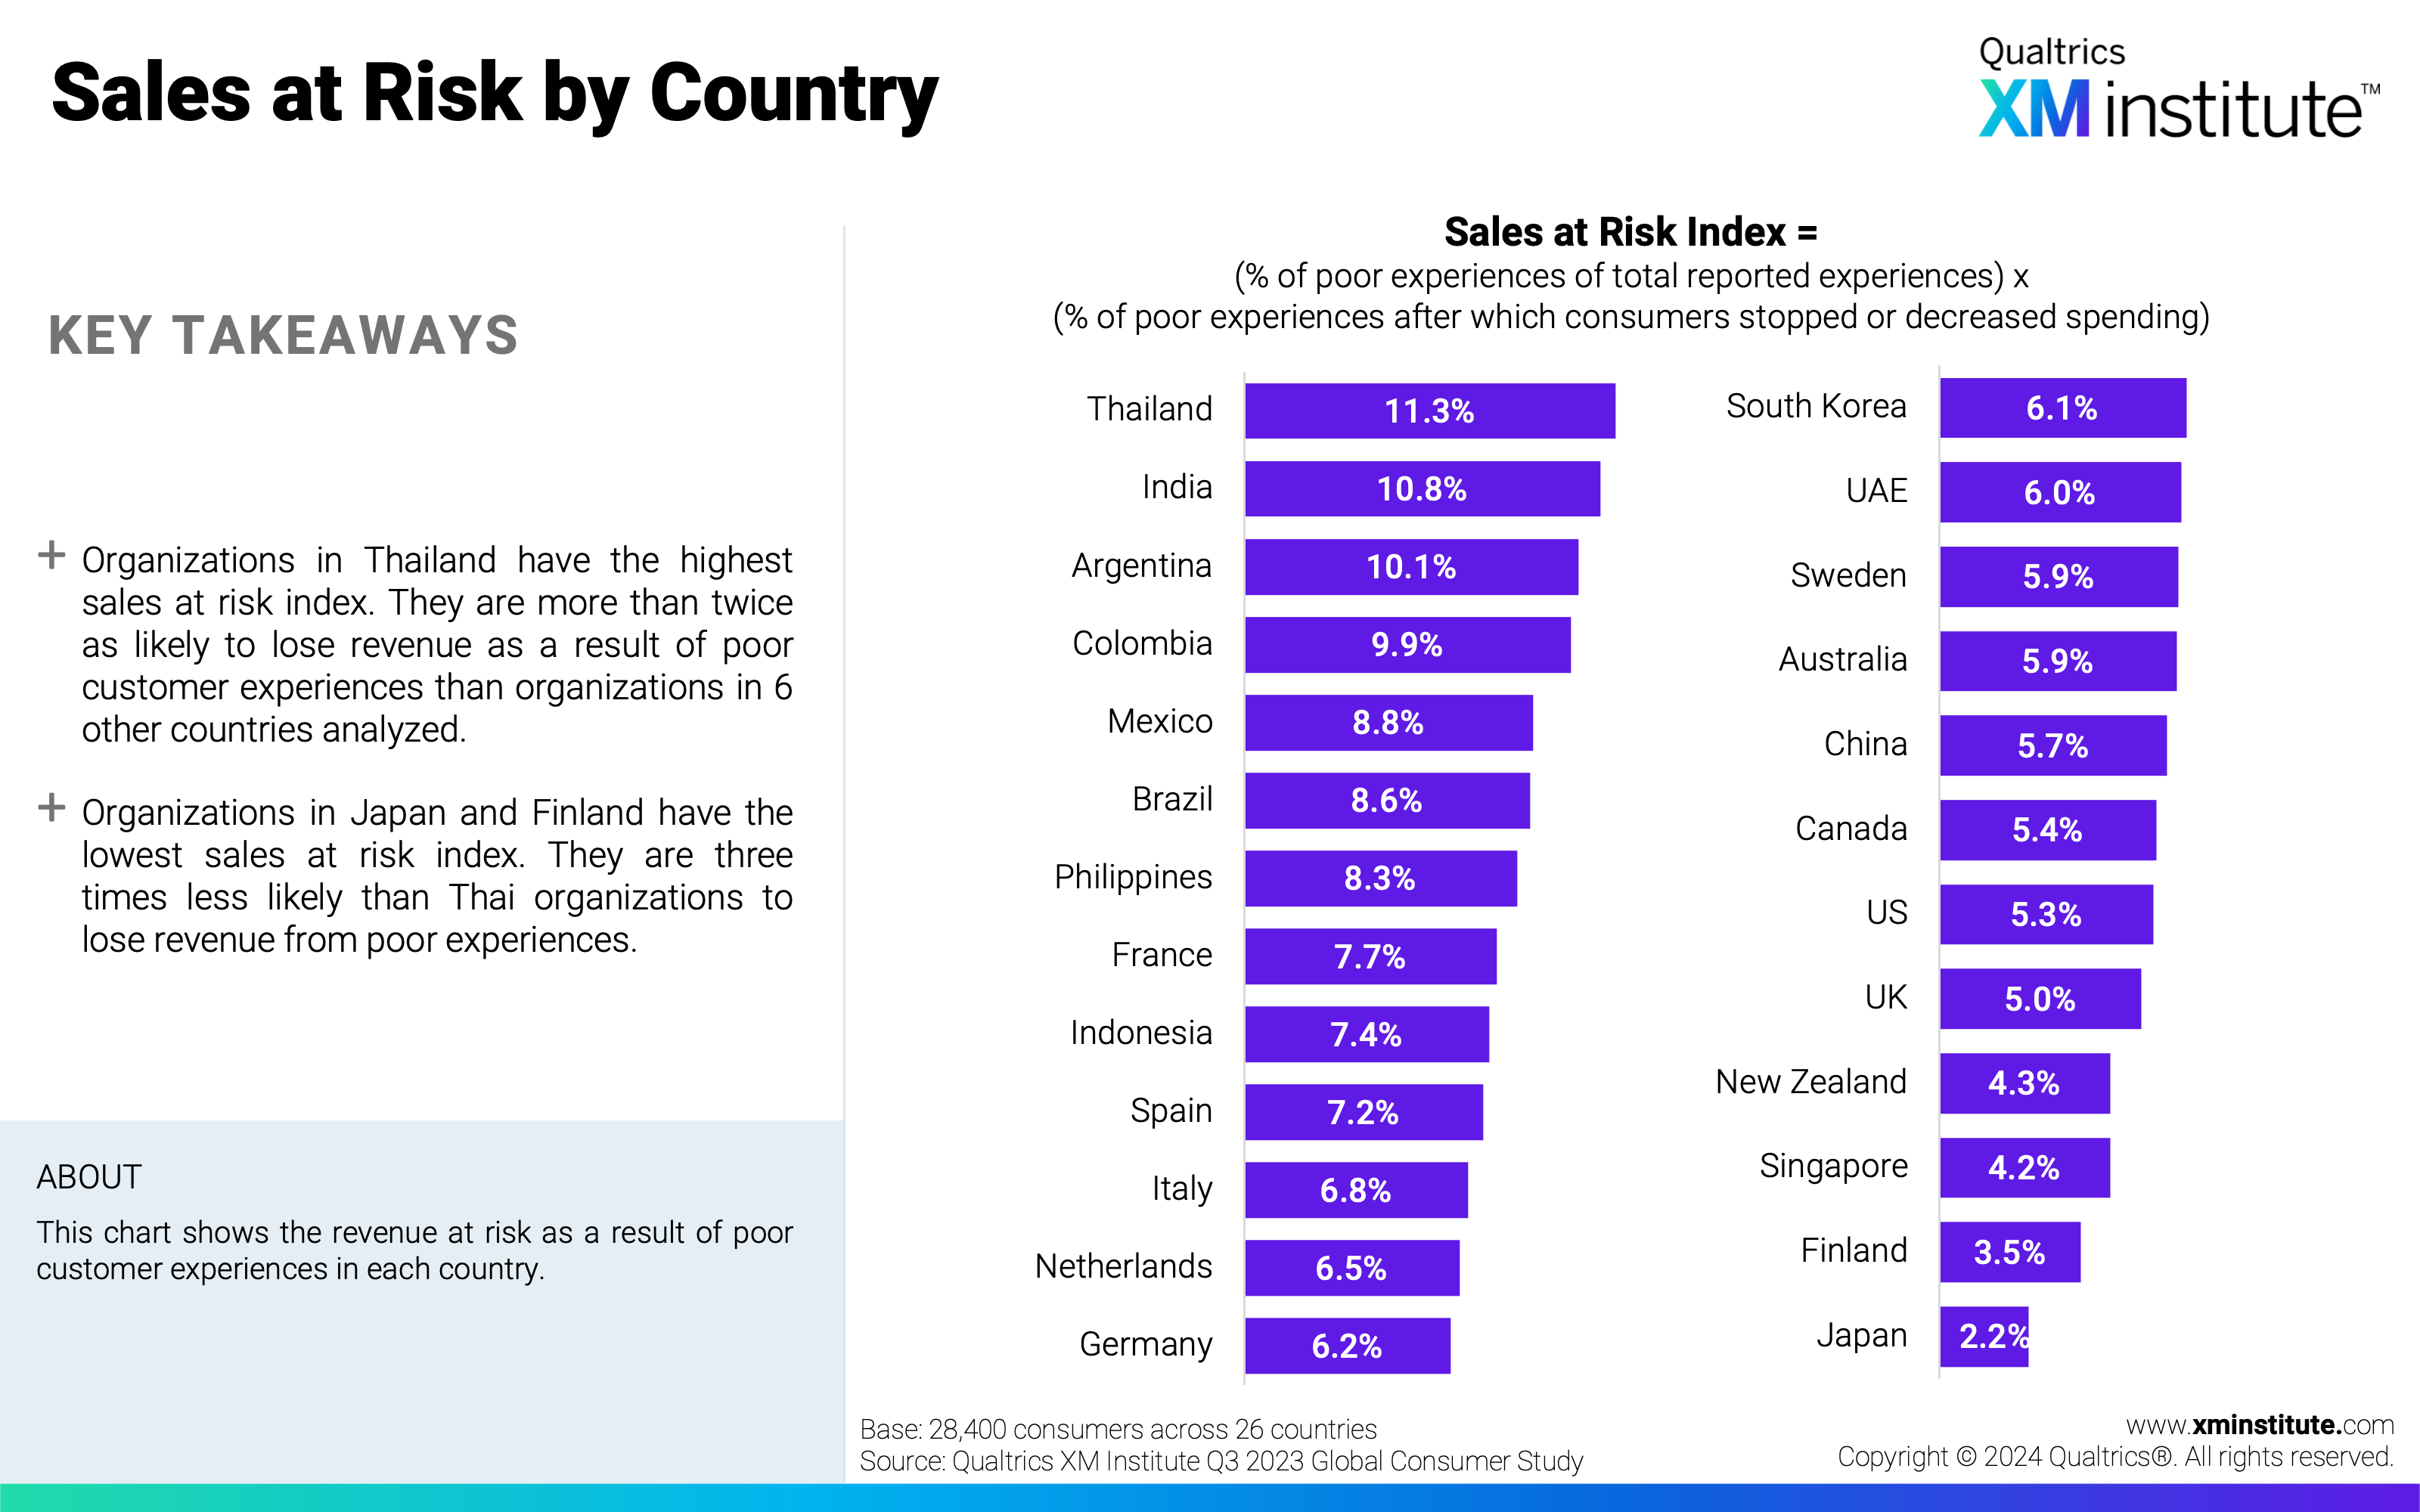
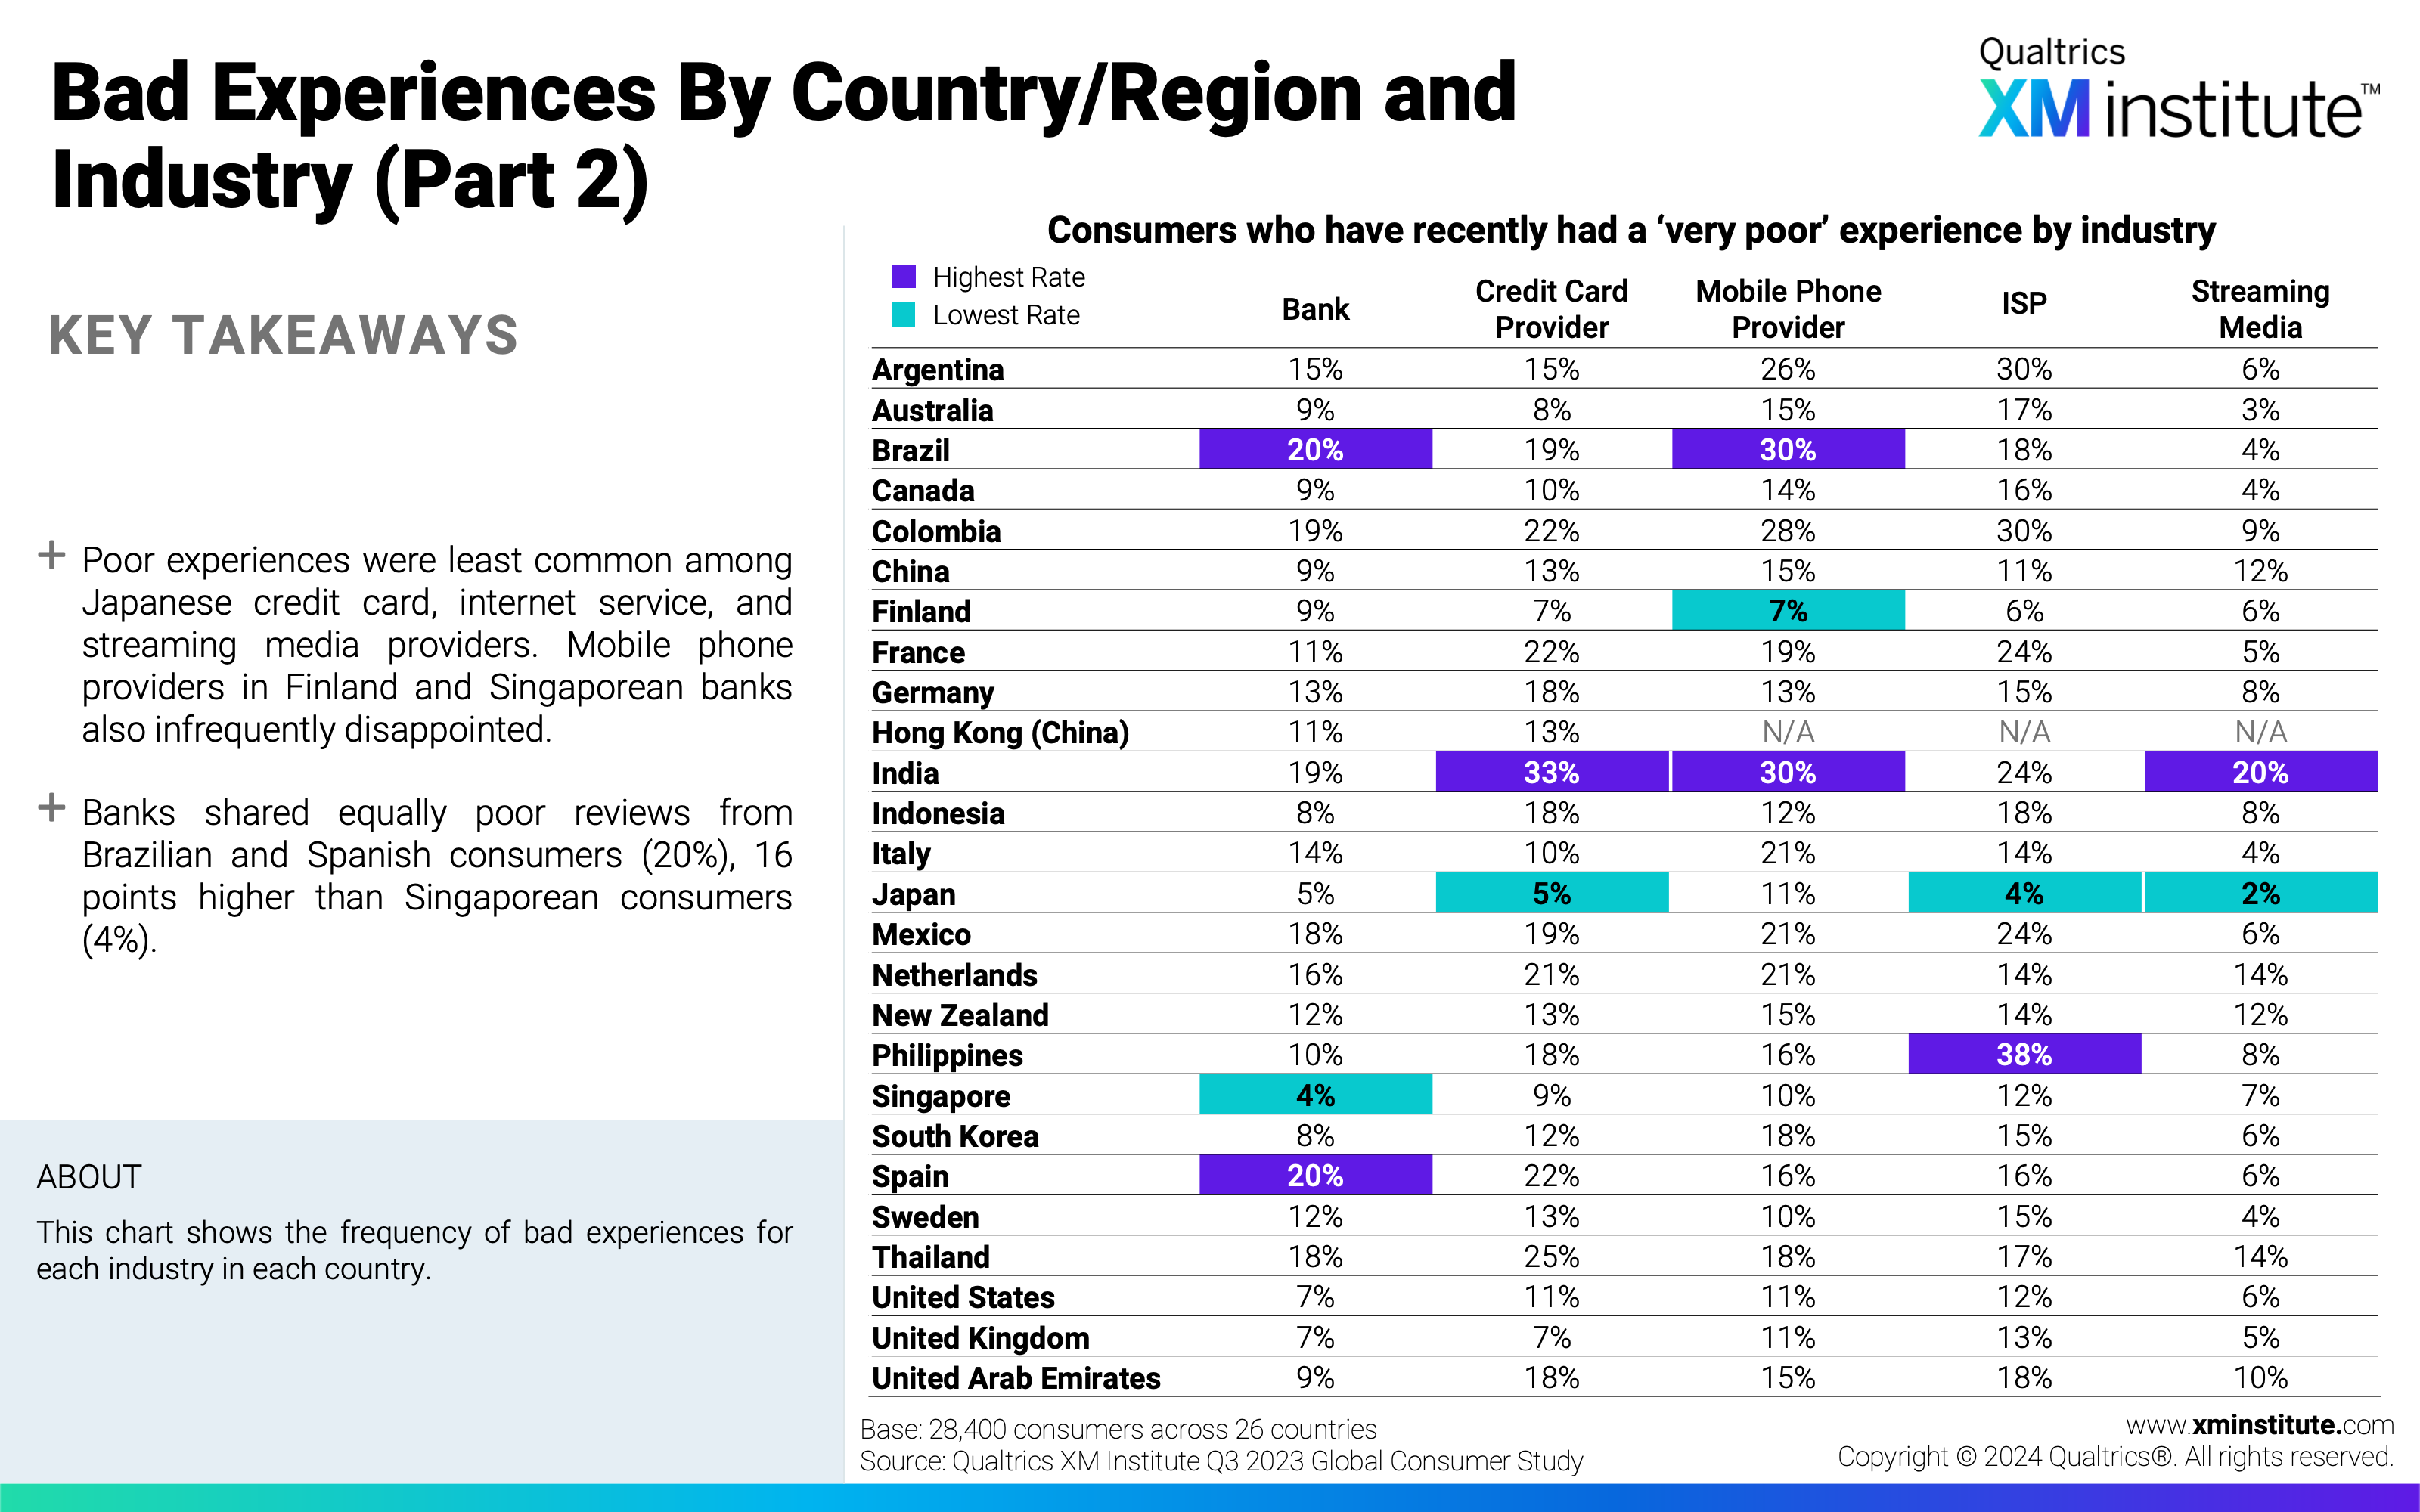
- Bad experiences put sales at risk. Organizations risk losing 7% of their revenue due to poor experiences. After government agencies (13.2%), mobile phone providers have the highest percentage of sales at risk (9.9%), while supermarkets have the least sales at risk (2.9%). Risk is highest for Thai organizations and lowest for those in Japan.
Figures
Here are the figures in this Data Snapshot:
- Bad Experiences by Industry
- Change in Bad Experiences by Industry
- How Consumers Cut Spending After a Bad Experience by Industry
- Sales at Risk Due to Bad Experiences by Industry
- Bad Experiences by Country
- Change in Bad Experiences by Country
- How Consumers Cut Spending After a Bad Experience by Country
- Sales at Risk by Country
- Bad Experiences by Country/Region and Industry (Part 1)
- Bad Experiences by Country/Region and Industry (Part 2)
- Bad Experiences by Country/Region and Industry (Part 3)

- Bad Experiences by Country/Region and Industry (Part 4)
- Methodology