The Connection Between Customer Experience and Loyalty
Previous XM Institute research has found that organizations around the world plan to invest in improving customer experience (CX), which makes sense given the strong link between CX and loyalty.1 To explore this connection between CX and customer loyalty, we asked 10,000 U.S. consumers about both their experiences with and loyalty to 319 U.S. companies across 20 industries.2 We then analyzed their responses, and the results show improved CX correlates to:3
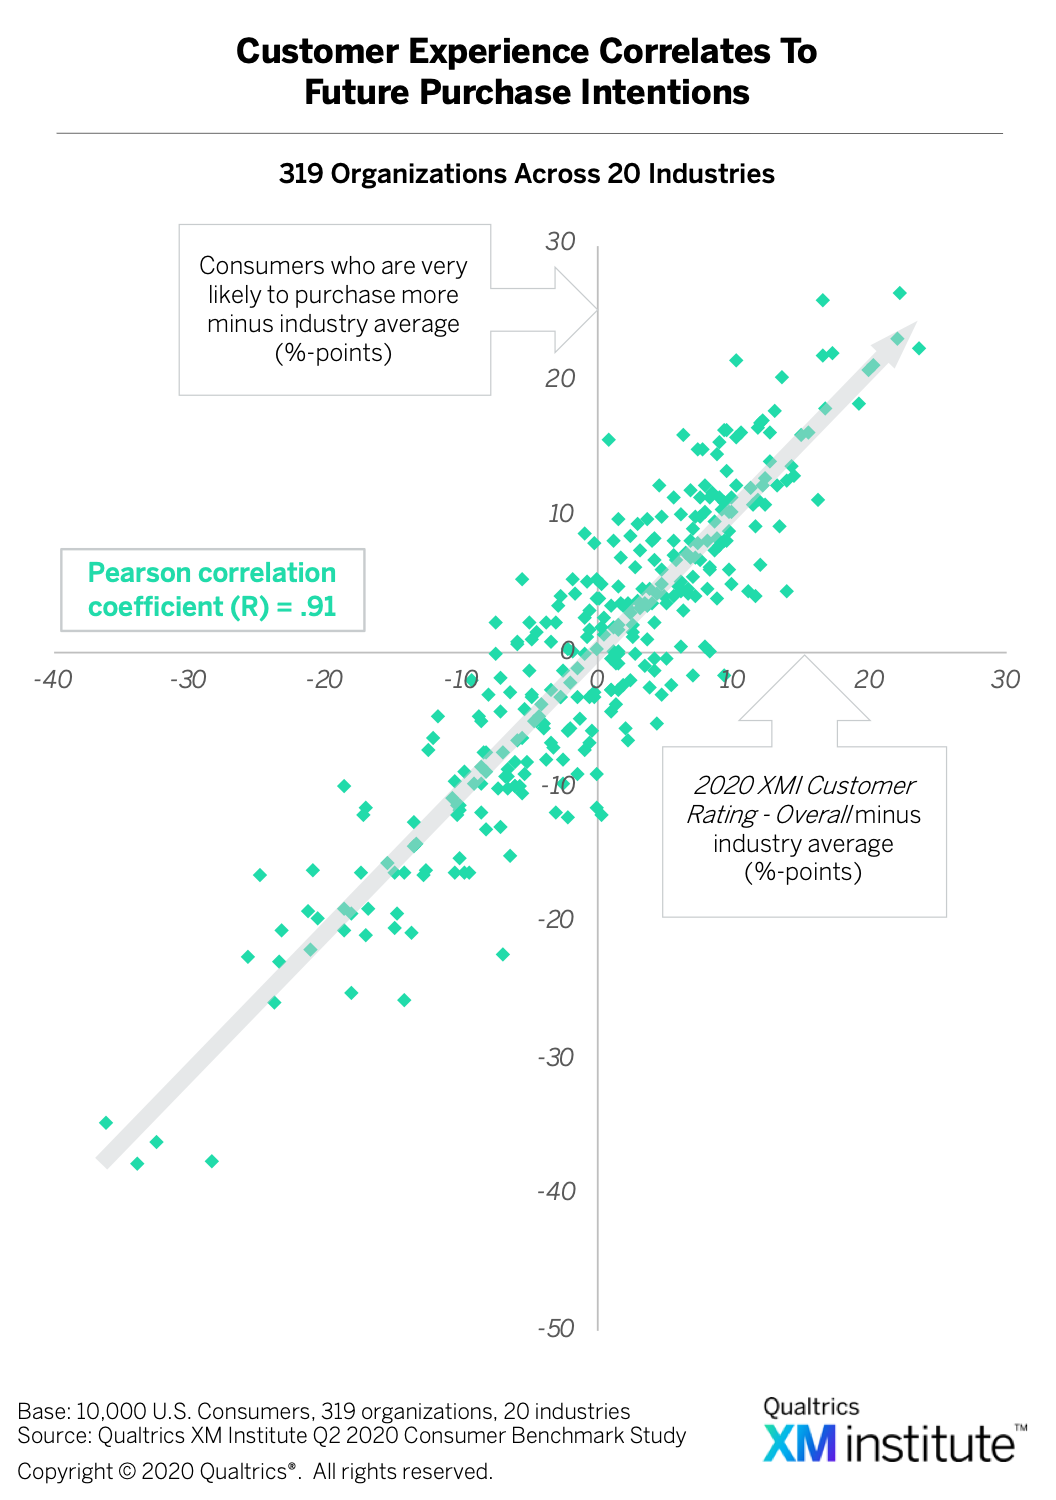
- Additional purchases. We compared the likelihood of consumers to purchase more products or services from each of the 319 U.S. companies to each firm’s Customer Ratings Score. We found that there is a strong, positive relationship between likelihood to purchase more and the Customer Ratings Score with a correlation coefficient of .91
 .4
.4 - More recommendations. We found a strong, positive relationship between CX and Net Promoter Score (NPS®) with a correlation coefficient of .88
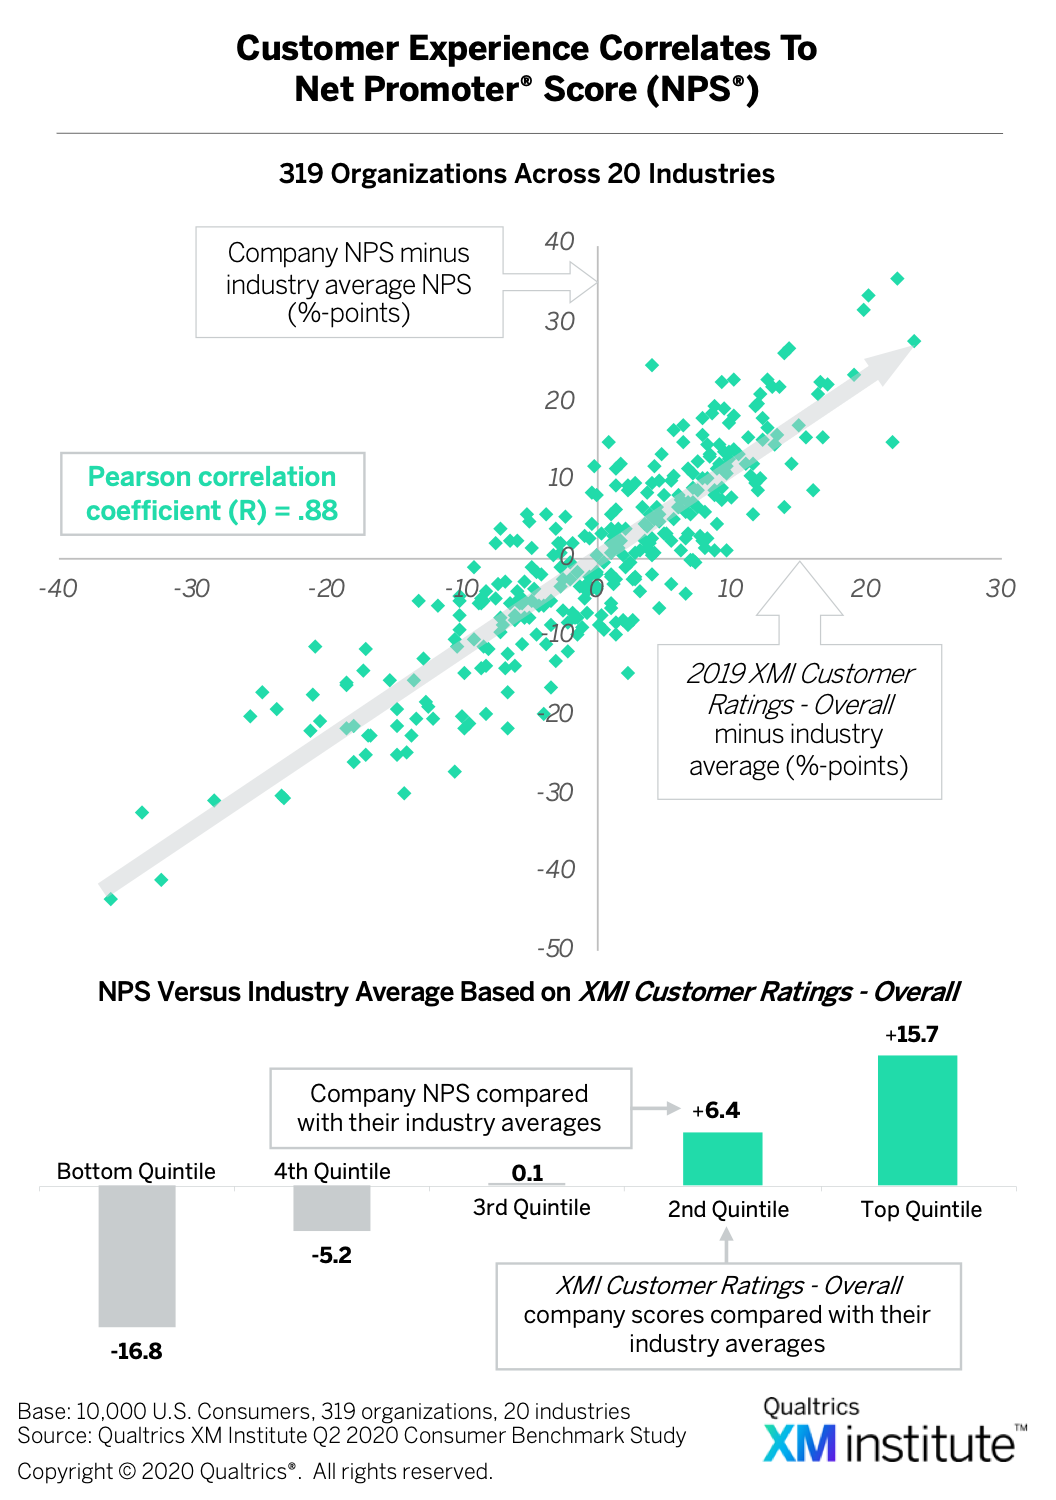 .5 The average NPS of companies in the highest quintile of the Customer Ratings is nearly 16 points above industry average and more than 32 points higher than the average NPS of companies in the bottom quintile.
Loyalty and the Three Elements of Customer Experience
In addition to comparing overall CX to different loyalty behaviors, we also investigated the effects that each of the three elements of a customer’s experience – success, effort, and emotion – have on four loyalty behaviors: purchasing more, recommending, forgiving, and trusting 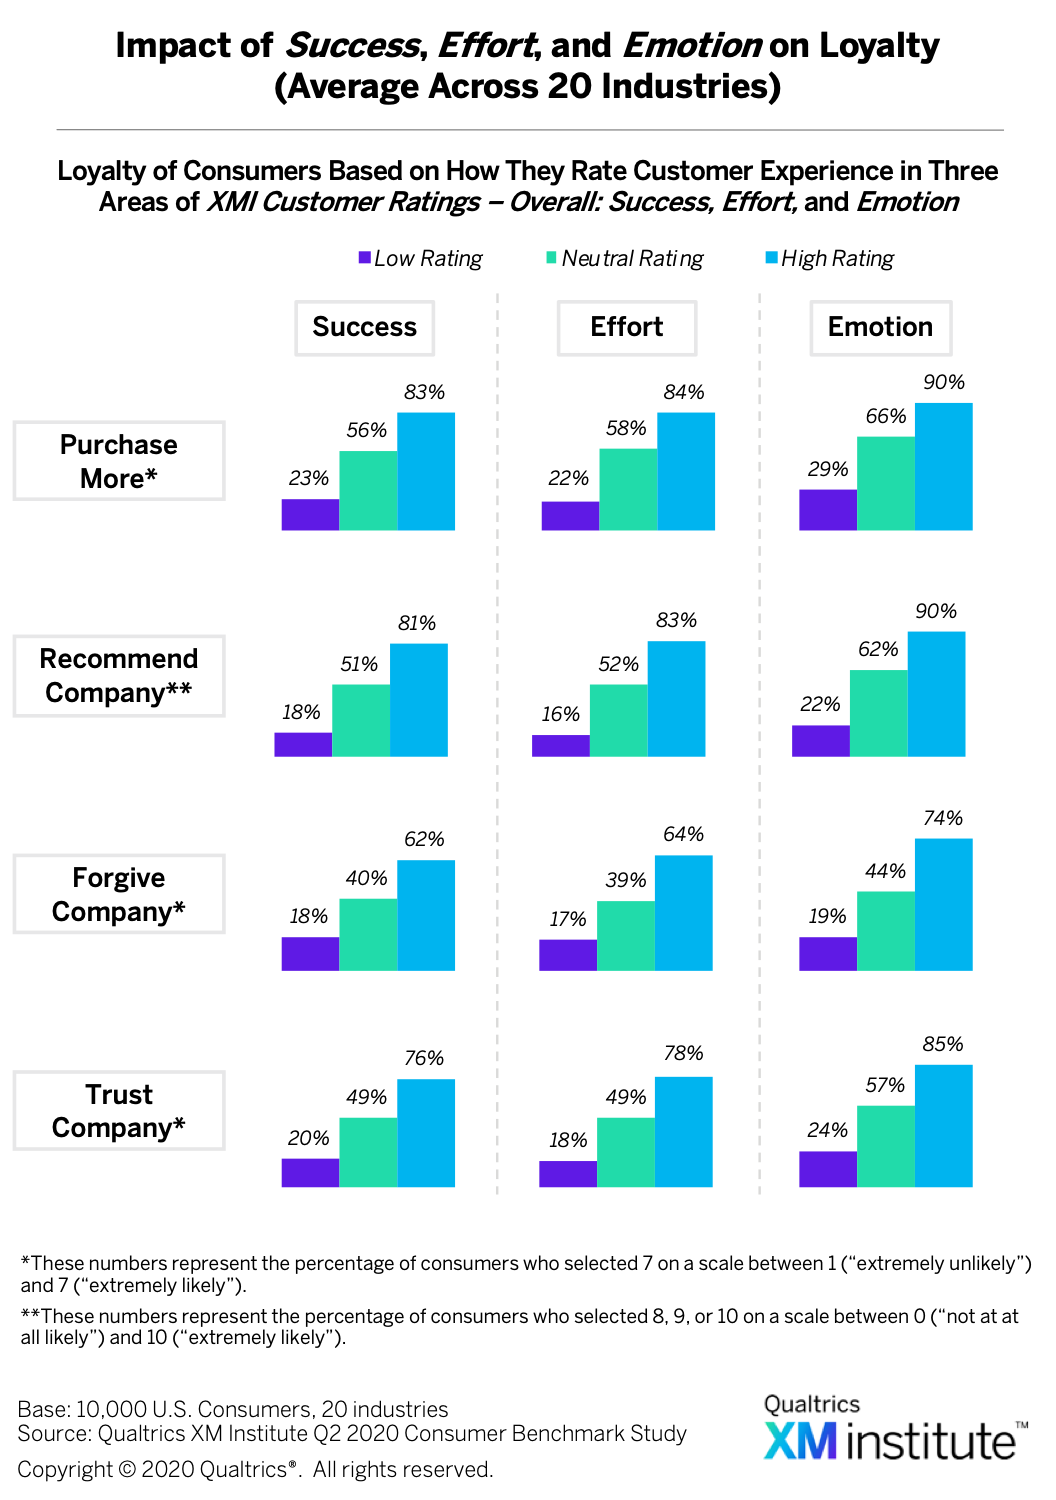 . The analysis examines consumer attitudes across all companies and industries and is based on whether consumers gave the organization a low, medium, or high CX rating. While our analysis shows that all three CX elements correlate to loyalty, we found that:
- Emotion has the largest impact. While improving any one component of CX increases all four measures of loyalty, an improvement in emotion provides the biggest benefit. Consumers with a high rating in emotion are more likely to exhibit all four loyalty behaviors than consumers with a high rating in either success or effort.
- Effort and Success have similar, positive effects. The effort and success components have a similar impact across all four loyalty behaviors, and both most strongly correlate with a consumer’s likelihood to purchase more from a company in the future. Eighty-four percent of consumers who gave a high effort rating are likely to make additional purchases; this number drops to 58% for consumers with only a neutral effort rating. For success, these values are 83% and 56%, respectively.
CX and Loyalty Across 20 Industries
As part of our analysis, we examined consumer loyalty to companies across 20 industries based on how consumers rated their experiences with those companies 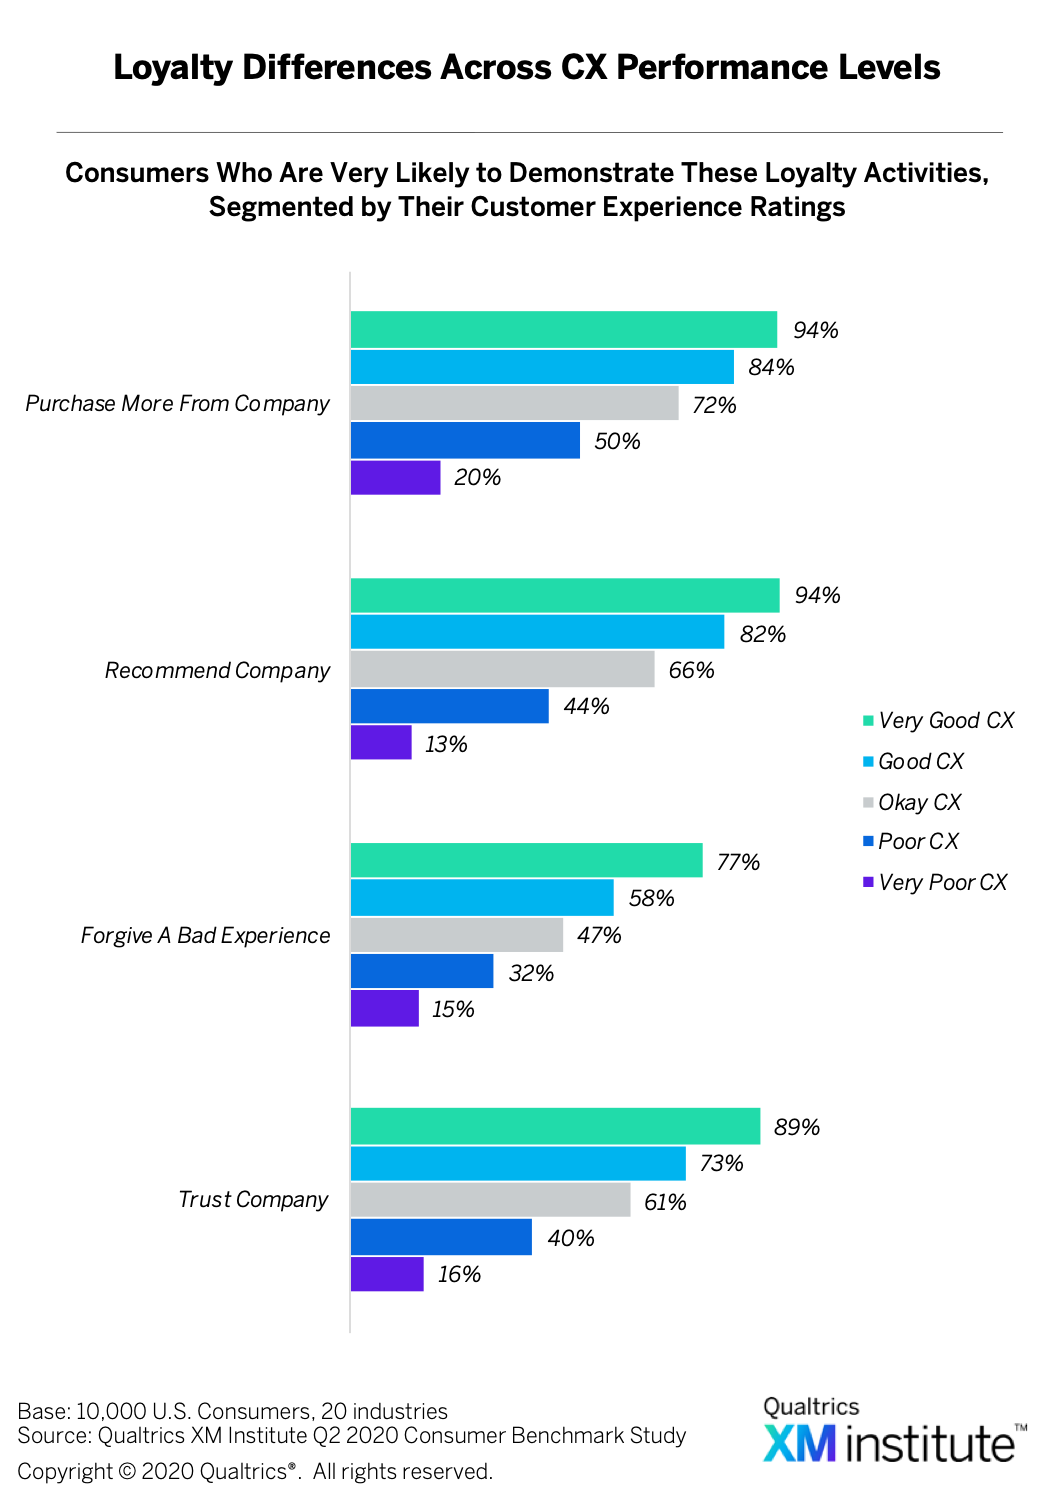 . When we considered the cross-industry averages, we discovered that CX influences how likely the customer is to:
- Purchase more from a company. Ninety-four percent of consumers who give a company a “very good” CX rating are likely to purchase more products or services from that company in the future. In comparison, only one in five of those who gave a company a “very poor” CX rating say the same
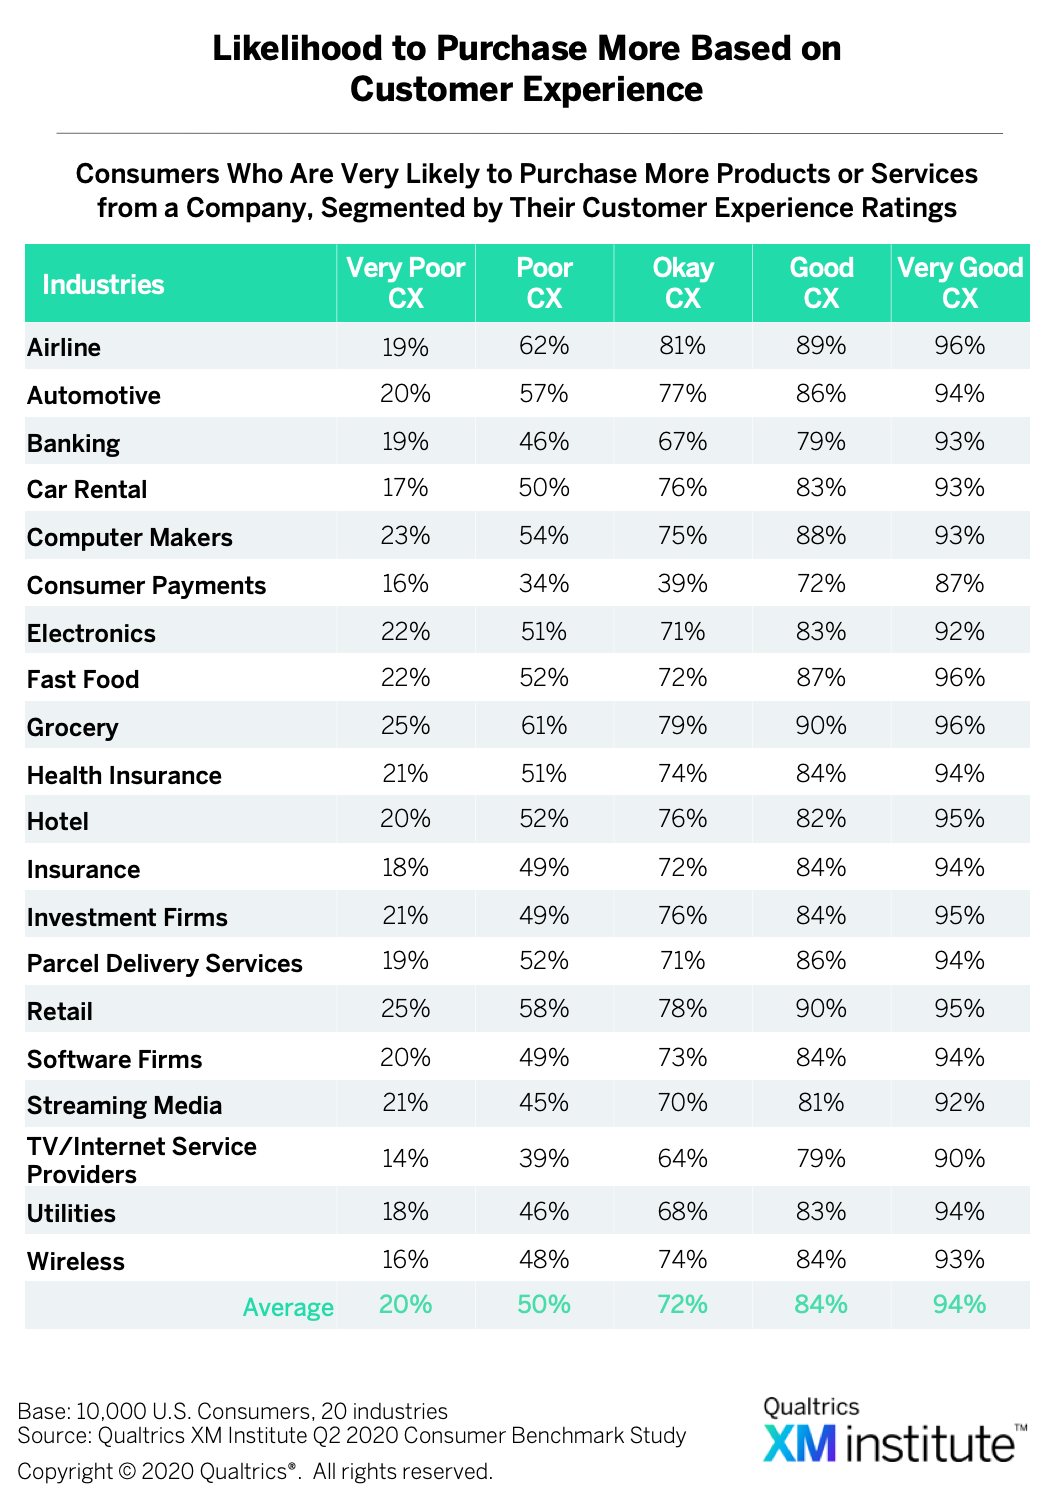 . This ranges from a high of 96% for “very good” CX in the Airline and Grocery industries to a low of 14% for “very poor” CX in the TV/Internet Service Provider industry.
 - Recommend a company. Ninety-four percent of consumers who give a company a “very good” CX rating are likely to recommend the company while only 13% of those who gave a company a “very poor” CX rating say the same
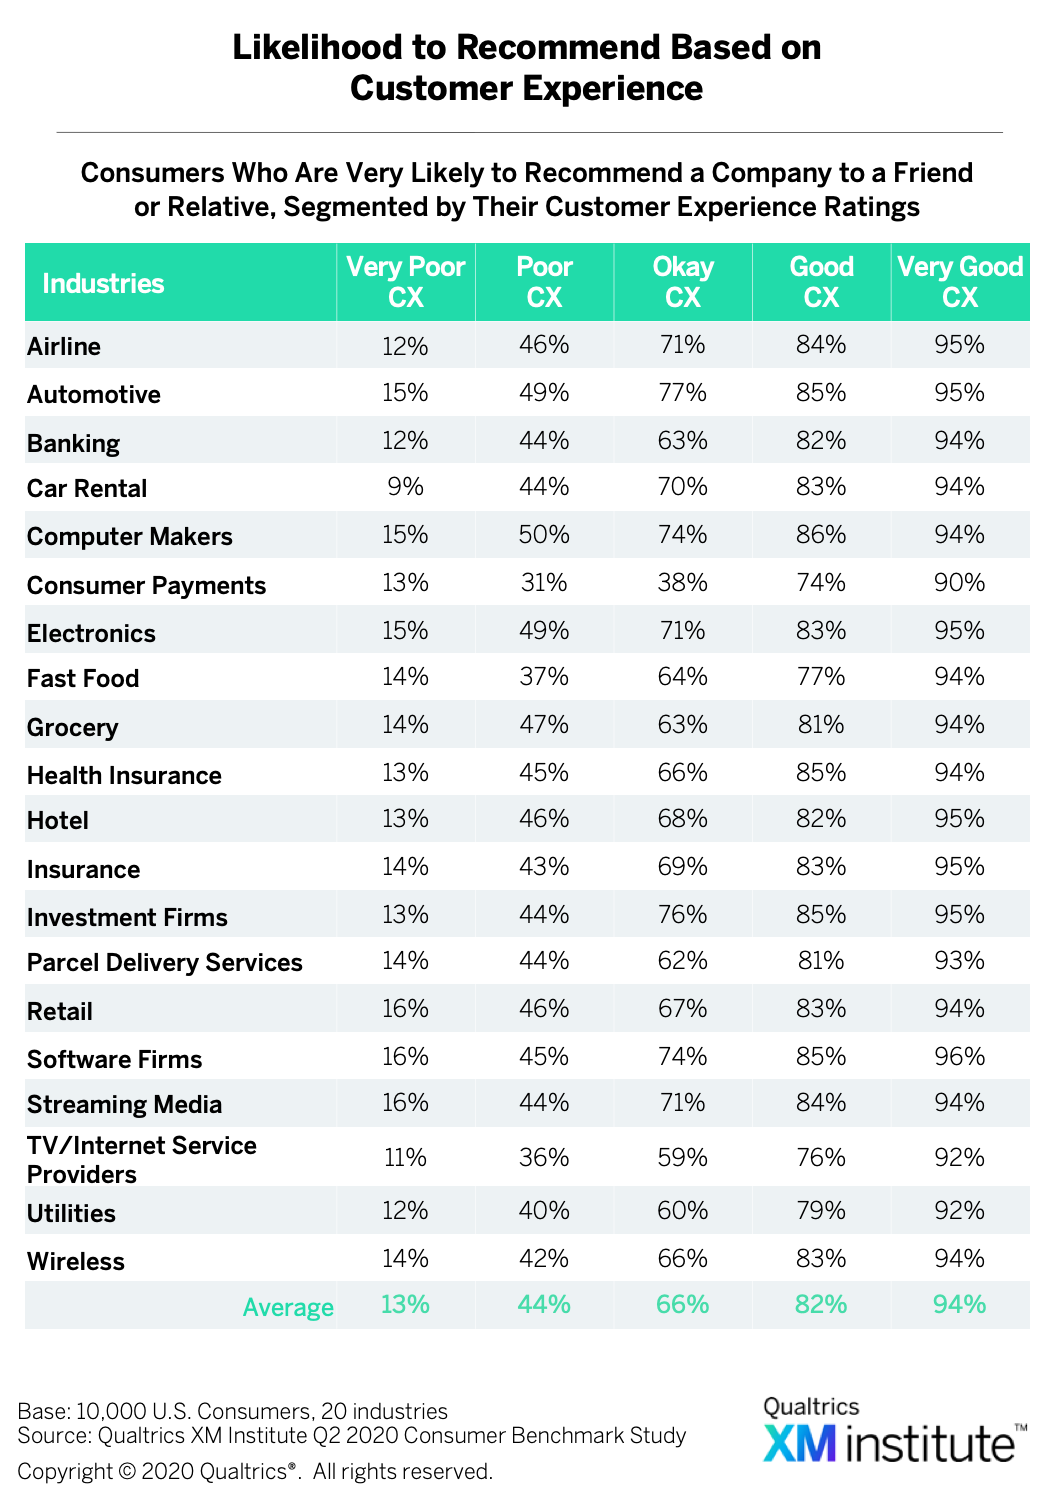 . This ranges from a high of 96% for “very good” CX in the Software Firms industry to a low of 9% for “very poor” CX in the Car Rental industry.
 - Forgive a company. About three-quarters of consumers who give a company a “very good” CX rating are likely to forgive a company for a bad experience, but only 15% of those who gave a company a “very poor” CX rating say the same
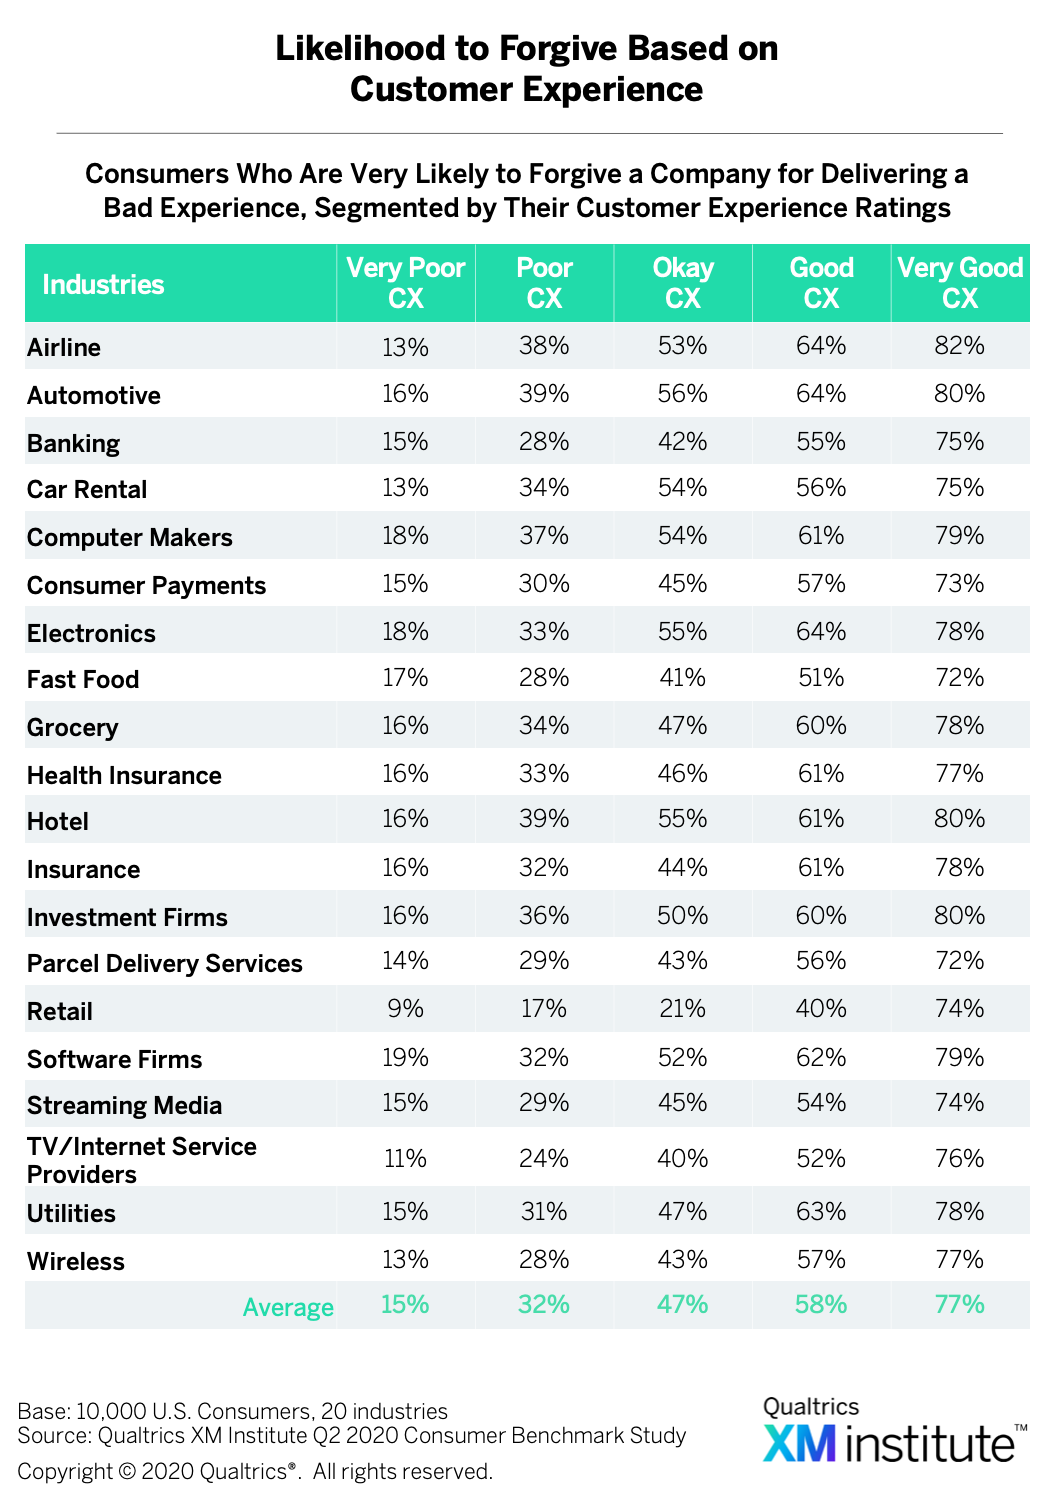 . This ranges from a high of 82% for “very good” CX in the Airline industry to a low of 9% for “very poor” CX in the Retail industry.
 - Trust a company. Nearly 90% of consumers who give a company a “very good” CX rating are likely to trust a company to take care of their needs. In comparison, 16% of consumers who gave a company a “very poor” CX rating say the same
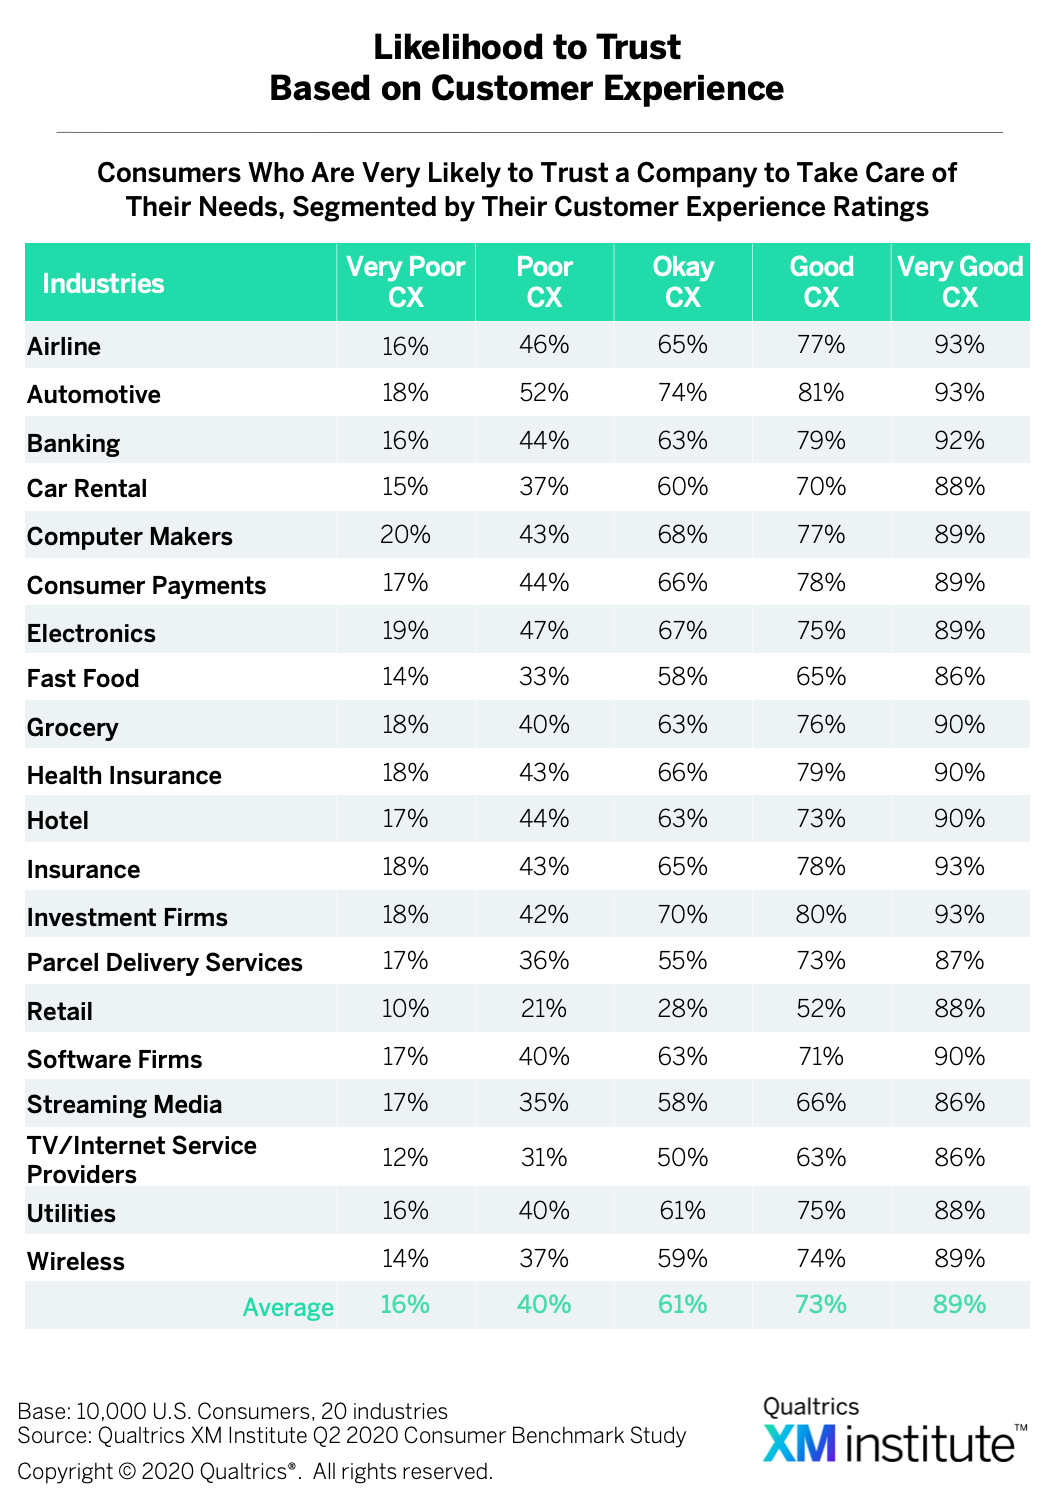 . This ranges from a high of 93% for “very good” CX in the Airline, Automotive, Insurance, and Investment Firms industries to a low of 12% for “very poor” CX in the TV/Internet Service Providers industry.
Potential Improvements in Customer Loyalty
Aside from providing a more detailed understanding of the relationship between CX and consumer loyalty, these data can also provide insight into the way CX improvements translate into improvements in loyalty. To quantify the potential ROI of investing in CX, we considered how a modest improvement in CX ratings corresponds to an increase in loyalty behavior. We calculated the difference between customers who rate a company as delivering “good” CX and those who rate a company as delivering “poor” CX 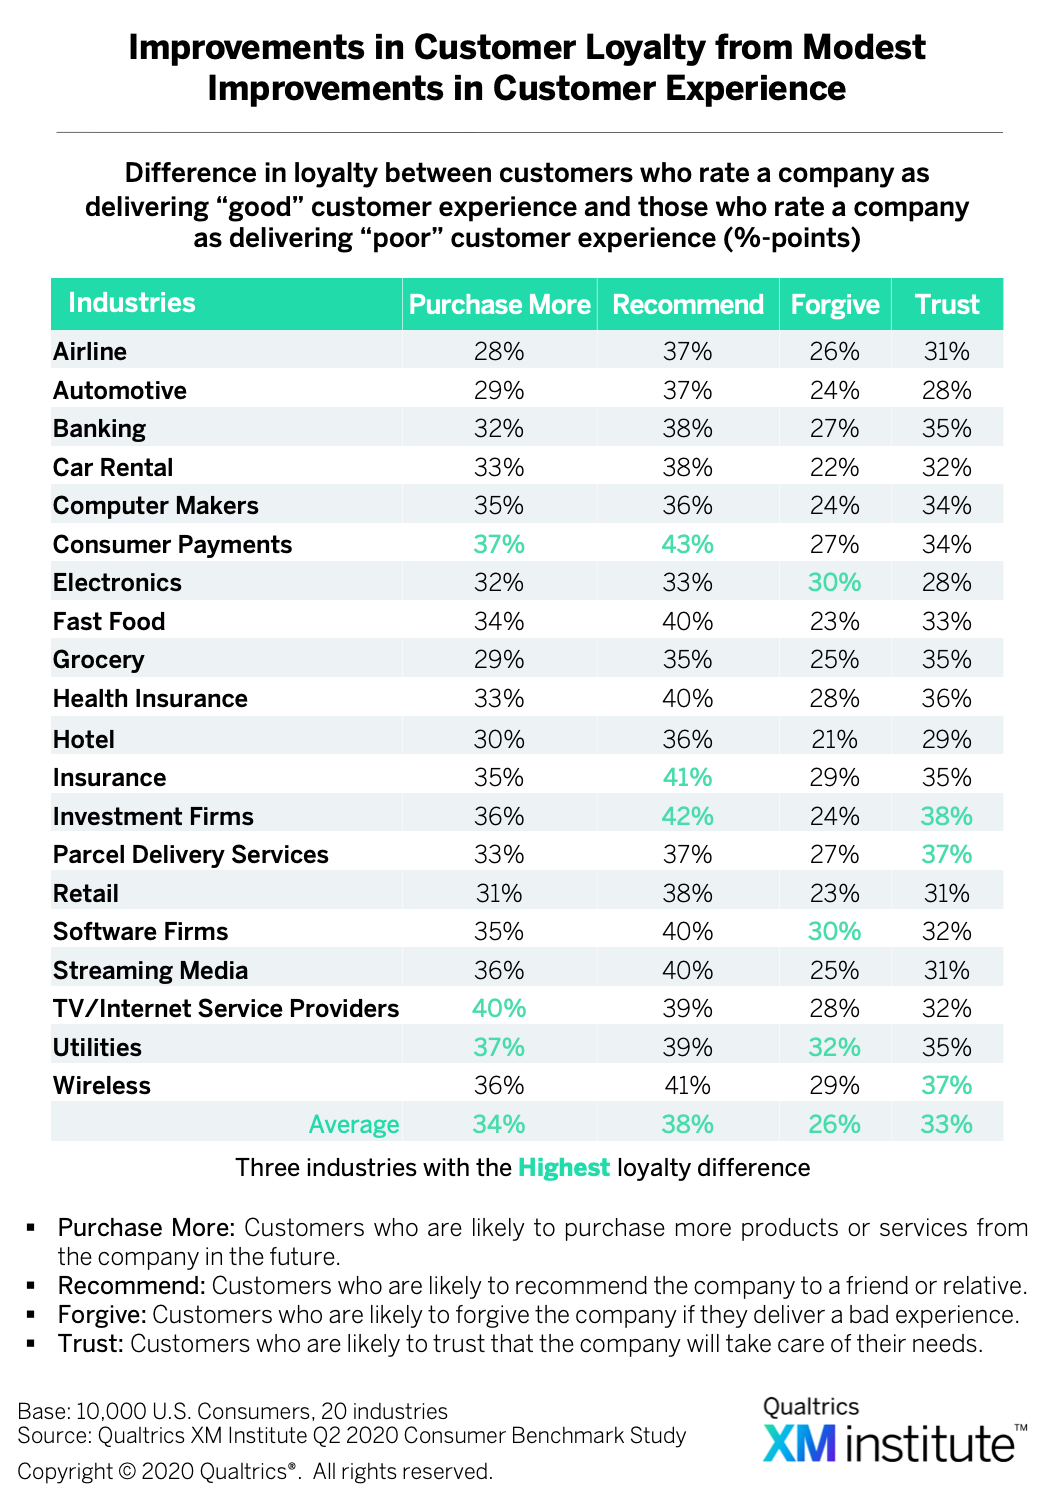 . We found that:
- CX impacts recommendations the most… Modest changes in CX quality have the largest payoffs on consumer likelihood to recommend. On average across 20 industries, there is a 38-percentage-point difference in likelihood to recommend between consumers rating a company’s CX as “good” versus those rating a company’s CX as “poor.” This gap is most pronounced for the TV/Internet Service Providers industry with a 40 percentage point difference.
- …But it is weakest on forgiveness. On average across 20 industries, there is only a 26-percentage-point difference in likelihood to forgive a company for a bad experience between consumers rating a company’s CX as “good” versus those rating a company’s CX as “poor.” This was the smallest difference across the four loyalty behaviors we measured, and this gap was smallest for the Hotel industry with a 21 percentage point difference.
- The Utilities industry has the highest potential. While all industries see improvements in customer loyalty by improving CX, utilities see the largest difference in loyalty when examining modest changes in CX. Across the four loyalty metrics, companies in the Utilities industry have, on average, a 36 percentage point difference in loyalty between consumers giving “good” and “poor” CX ratings.
Build Your Own CX ROI Model
As with all industry-wide research, any single company’s results may vary considerably from these aggregated results. That’s why we recommend companies build their own models for tying loyalty (and revenue) to CX metrics 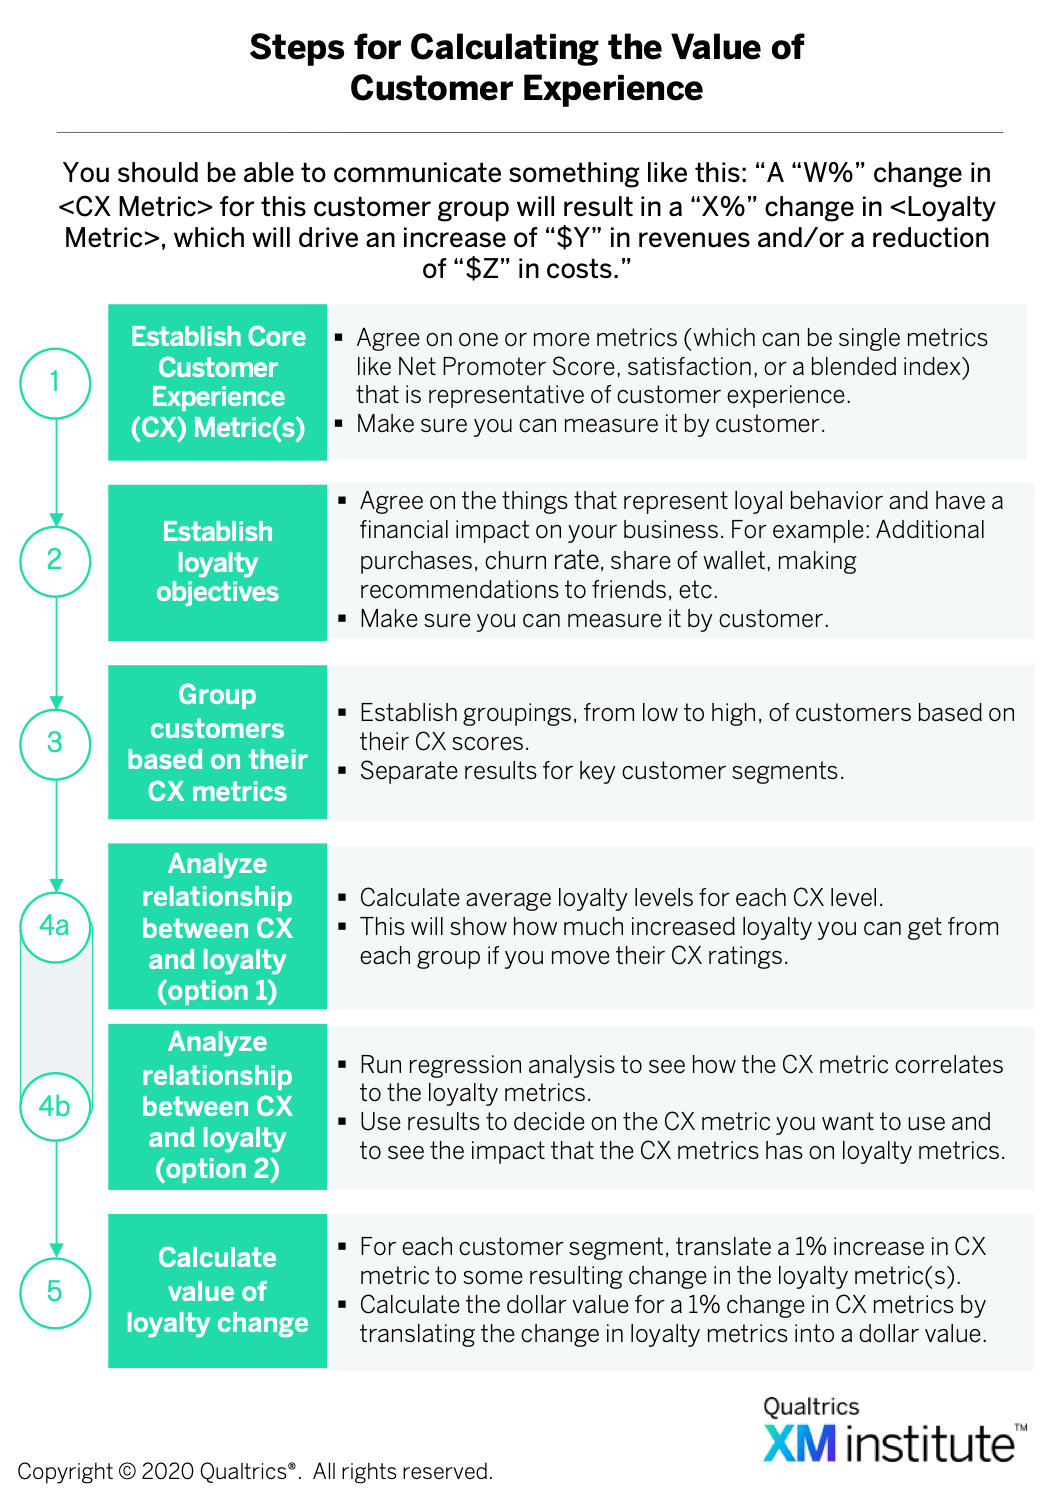 . Here’s some advice to consider as you undertake this effort.
- Enlist your CFO. Even if you have the brightest business analysts in the world on your team, if you do not involve the CFO’s team, the finance leader will always question your financial models and assumptions.
- Use existing metrics. Try to make your case based on the business metrics that your company already uses – it will make it easier for people to understand and will help you earn their buy-in.
- Be conservative. Resist the temptation to use the high end of estimates for potential benefits. While the results may seem more compelling, they will also be harder to defend.
- Create a simple story. People tend to remember very simple storylines, so make sure that you organize your results in a way that is easy for people to understand.
- Specifically, 60% of large organizations plan to increase the effort they put into improving their customer experience compared with the previous year. See the XM Institute Report, “The Global State of XM, 2020,” (April 2020).
- Data come from the Qualtrics XM Institute Q2 2020 Consumer Benchmark study which was conducted in May 2020, so response collection occurred in the middle of the global COVID-19 pandemic.
- For the Customer Ratings, we used the “2020 XMI Customer Ratings – Overall,” which evaluate the three areas of an experience: success, effort, and emotion. To normalize scores across the industries the analysis compares the data for each company with their industry average. See the XM Institute Insight Report, “2020 XMI Customer Ratings – Overall,” (July 2020).
- For data on future purchase intentions, we looked at consumers’ responses to the question: “How likely are you to consider purchasing more products or services from these companies in the future?” We included the percentage of consumers who selected a 7 on a scale from 1 (“extremely unlikely”) to 7 (“extremely likely”).
- Net Promoter Score, Net Promoter, and NPS are registered trademarks of Bain & Company, Satmetrix, and Fred Reichheld.


