Understanding the State of CX in the Health Insurance Industry
How does the quality of customer experience differ across industries? To address this question, the XM Institute conducted a large-scale benchmark study where we asked 10,000 U.S. consumers to rate their recent interactions with 294 organizations across 20 industries.1 In this Industry Snapshot, we examine the state of CX in the health insurance industry. To develop this Industry Snapshot, we:
- Found the average XMI Customer Ratings – Overall for each industry. To generate the average CX rating for each industry, we asked respondents to evaluate their experiences with companies over the past 90 days.2 These questions – rated on a seven-point scale – covered the three components of an experience: success (were they able to accomplish their goals?), effort (how easy or difficult was it for them to accomplish their goals?), and emotion (how did the interaction make them feel?).3 We found the XMI Customer Rating – Overall for each of the 294 companies by averaging the ratings for these three experience components. We then calculated the average Customer Rating for each industry by averaging the Customer Ratings of the companies within each industry.4
- Calculated NPS. We asked respondents who had interacted with a company to answer the standard Net Promoter® Score (NPS®) question: How likely are you to recommend <company> to friends and colleagues? Consumers selected a response from 0 (not at all likely) to 10 (extremely likely). We then determined the percentages of each firm’s respondents who were promoters (selected 9 or 10), passives (selected 7 or 8), or detractors (selected between 0 and 6). We then calculated the NPS for each company by subtracting its percentage of detractors from its percentage of promoters.5
- Determined likelihood to repurchase and trust. We also asked consumers how likely they are to consider purchasing more products or services from the companies they had interacted with on a scale of 1 (extremely unlikely) to 7 (extremely likely). We also asked how likely they are to trust that the company would take care of their needs on a scale from 1 (do not trust at all) to 7 (completely trust).
- Established the frequency and effects of poor experiences. We asked respondents to identify which organizations they recently had a poor experience with and then asked, “Since the time that you had a bad experience with these companies, how have you changed the amount of money you spend with them?” They could answer that their spending completely stopped, it decreased, it didn’t change, it increased, or that they haven’t spent any money with that company.
- Identified the most broken customer journeys. To better understand which types of interactions are most likely to affect the customer’s perception of an organization, we asked respondents to identify which journey within a certain industry needs the most improvement. We also looked at the correlation between which journeys a customer identified as broken and how likely that customer was to recommend the company.
Health Insurers Deliver Subpar CX
When we looked at the current state of customer experience in the health insurance industry and how it compared to the broader CX landscape, we found that health insurers:
- Lag behind other industries. Health insurers received a below average XMI Customer Rating – Overall score of 55%, the second lowest for any industry included in this study
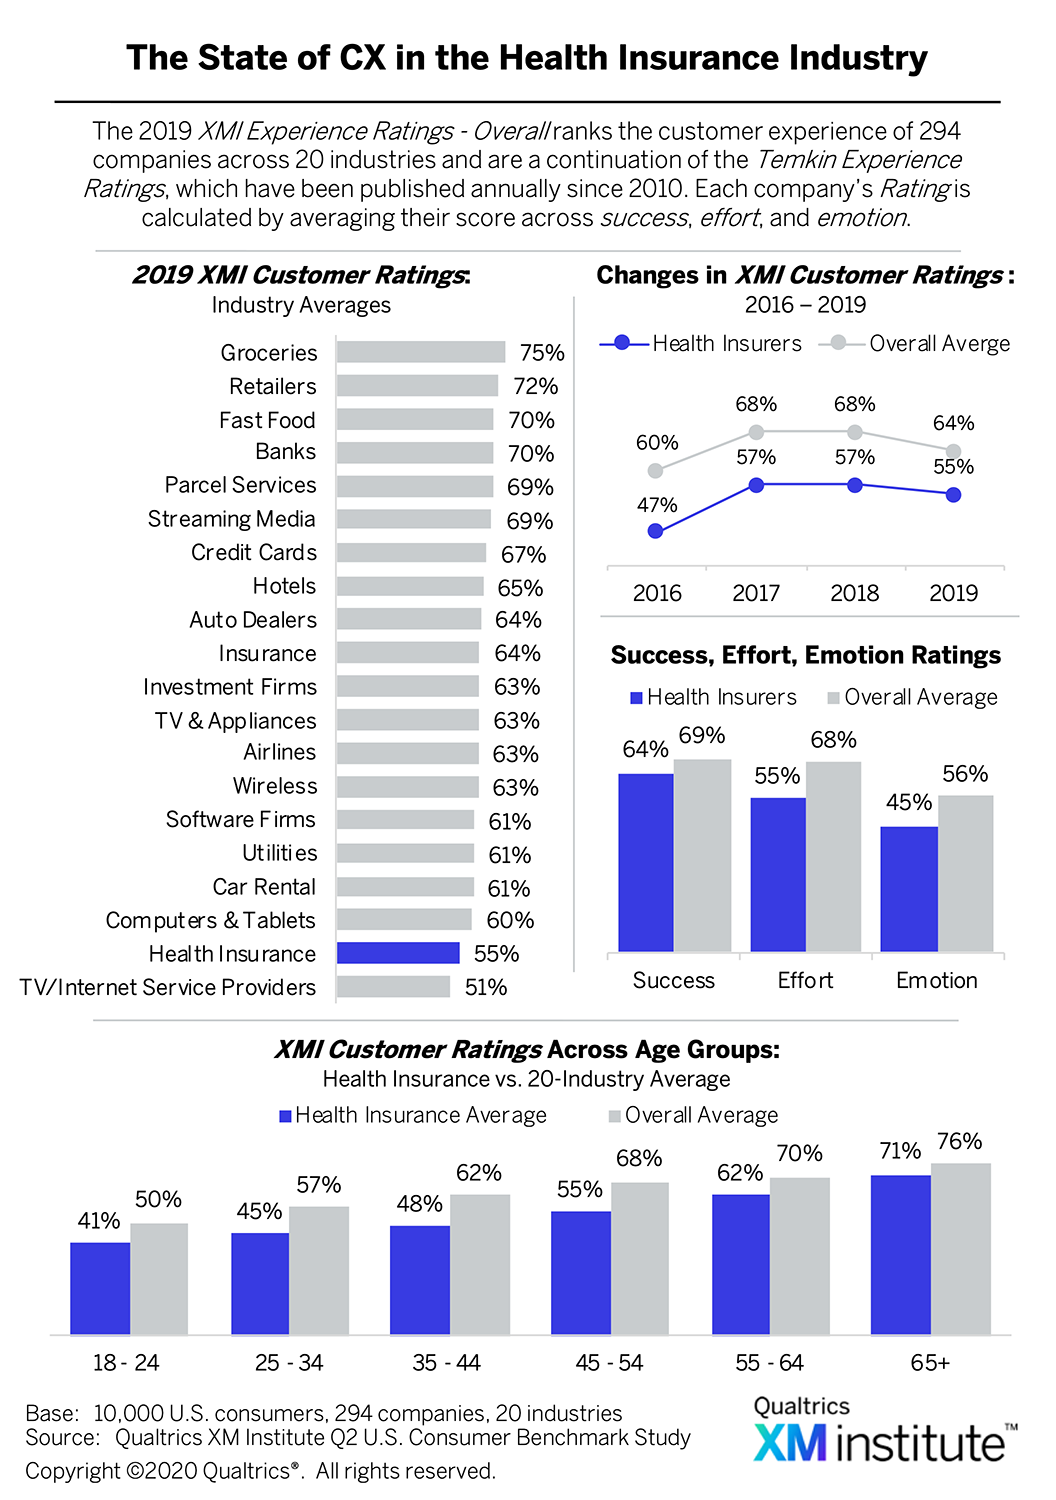 . When we looked at how health insurers performed across the three components of an experience – success, effort, and emotion – compared to the average of all 20 industries, we found that they fell substantially behind the overall average when it comes to both the effort and emotion elements.
 - Have fewer promoters. We found a strong connection between customers’ experiences and their likelihood to recommend a company. Companies that significantly outperformed their industry’s average XMI Customer Ratings also earned a significantly higher-than-average NPS
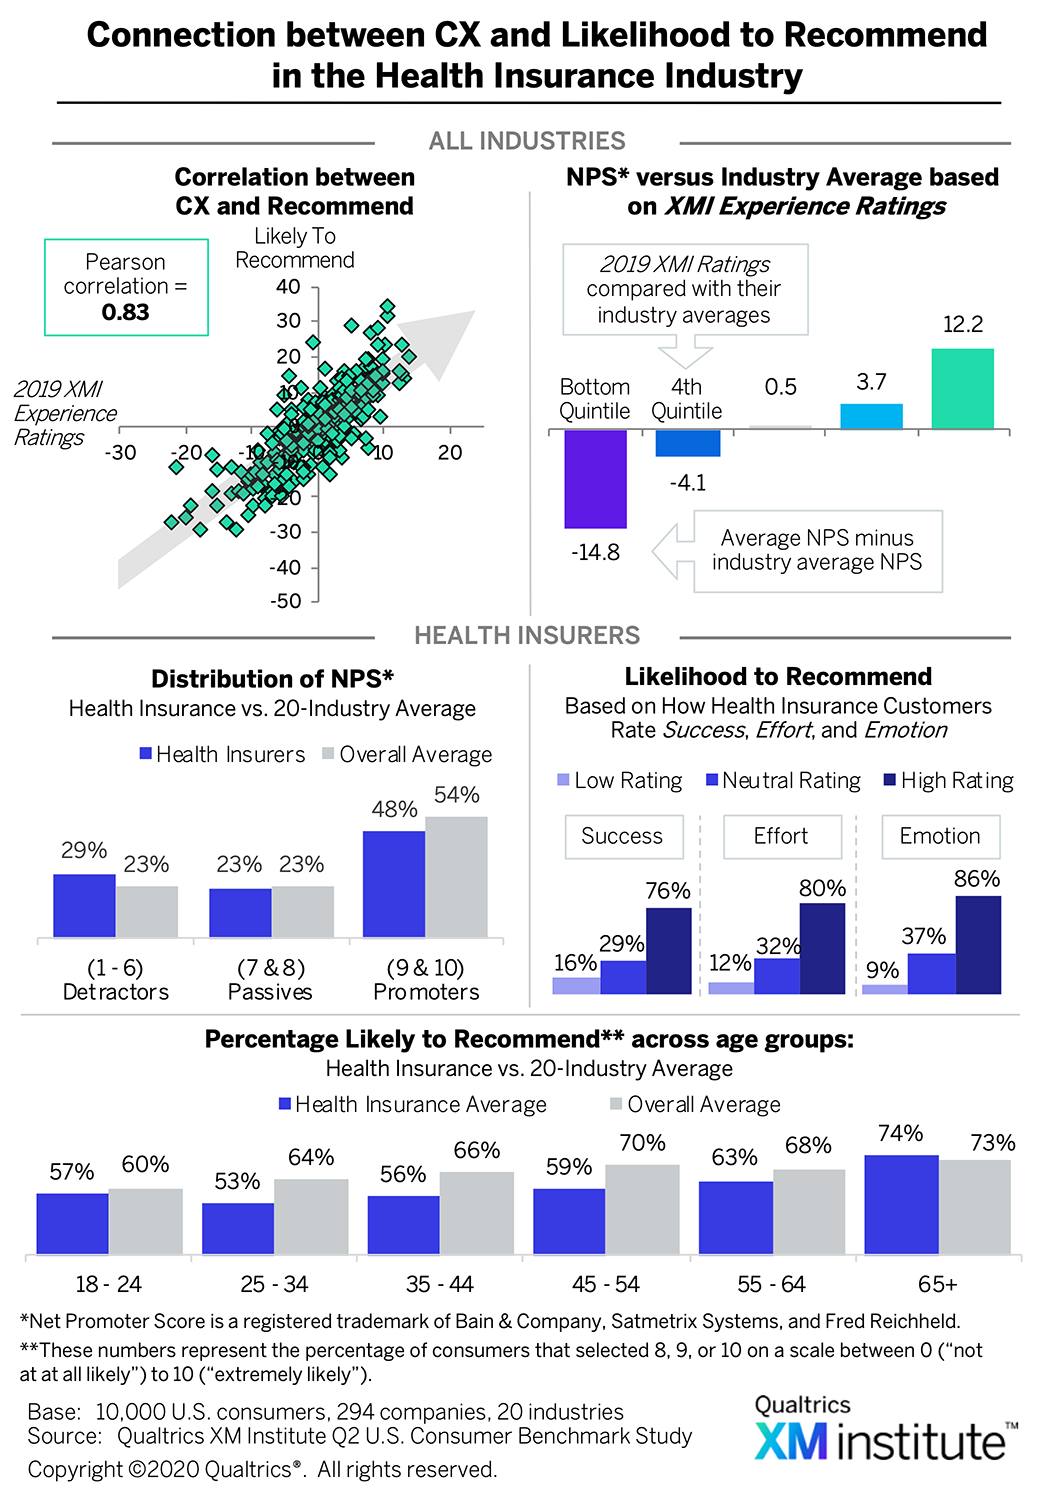 . Given health insurers’ low CX scores, it is therefore no surprise that the industry has fewer promoters and more detractors than the 20-industry average. To boost their numbers of promoters, health insurers should focus the emotion component of experiences as, of the three elements of an experience, that one has the most significant impact on a customer’s likelihood to recommend.
 - Lack member enthusiasm. Customer experience is strongly related to a consumer’s likelihood to rebuy from a company – with a correlation coefficient of 0.85 – which likely explains why health insurance members are so lukewarm about purchasing more from their insurers
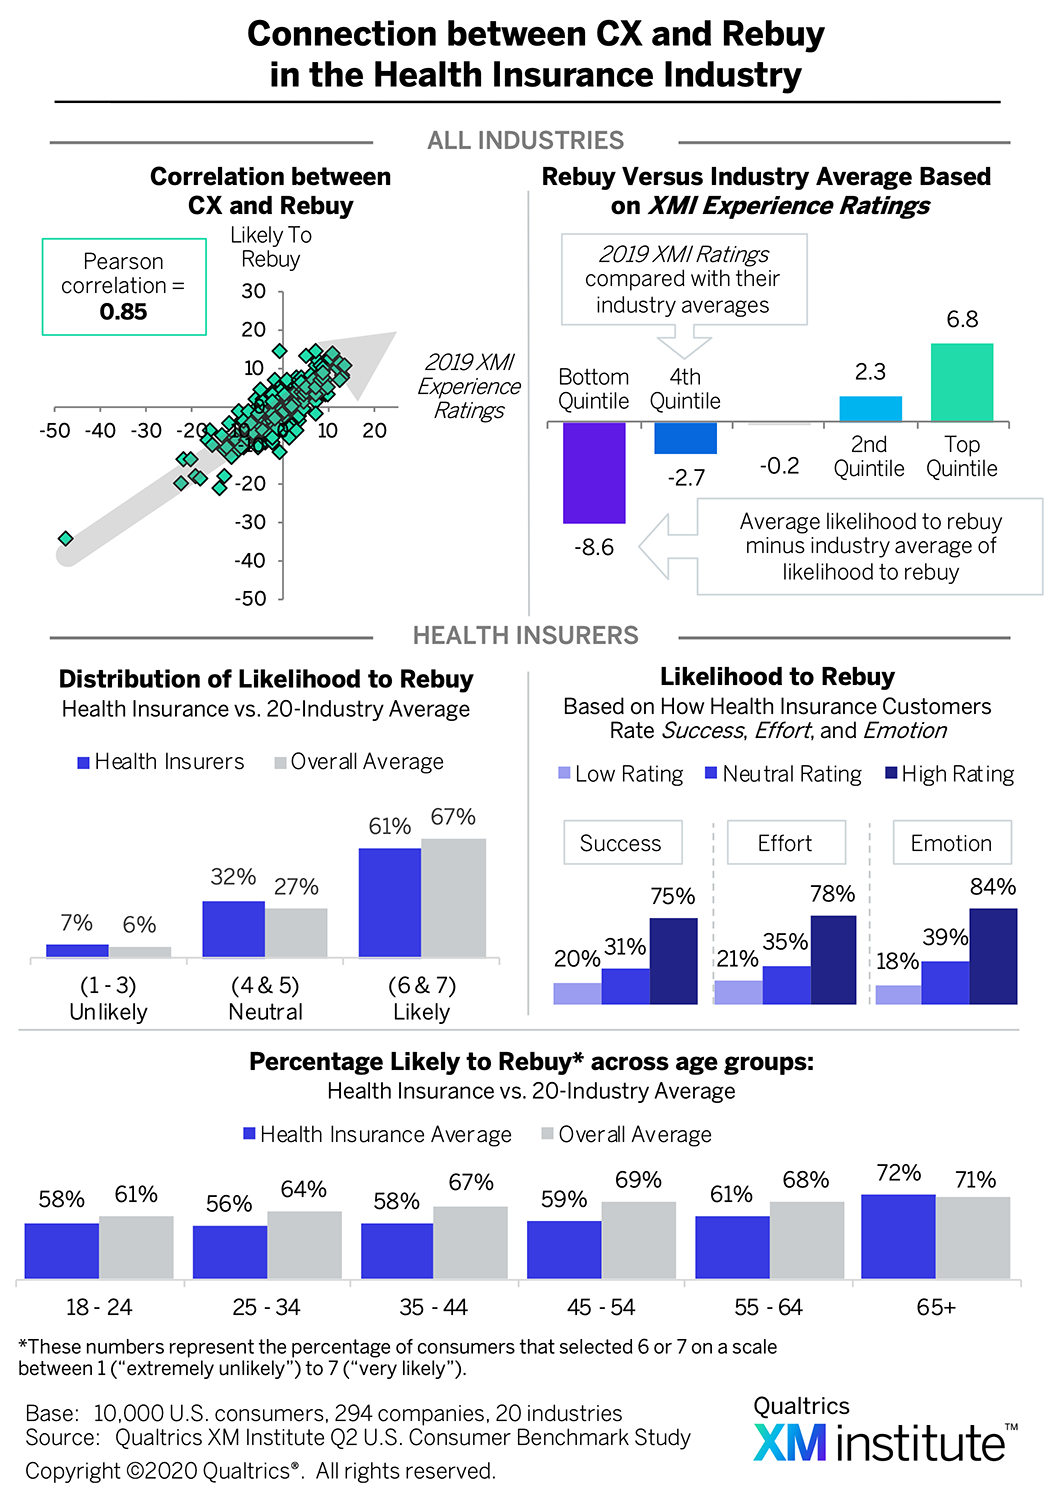 . Middle age consumers are particularly reticent to repurchase from their health insurance company, with a significantly lower percentage of 35- to 54-year-olds saying they’re likely to rebuy compared to the overall average.
 - Fail to inspire trust. While a customer’s experience with a company does impact their likelihood to trust that company, the correlation is slightly weaker than it is for their likelihood to recommend or repurchase
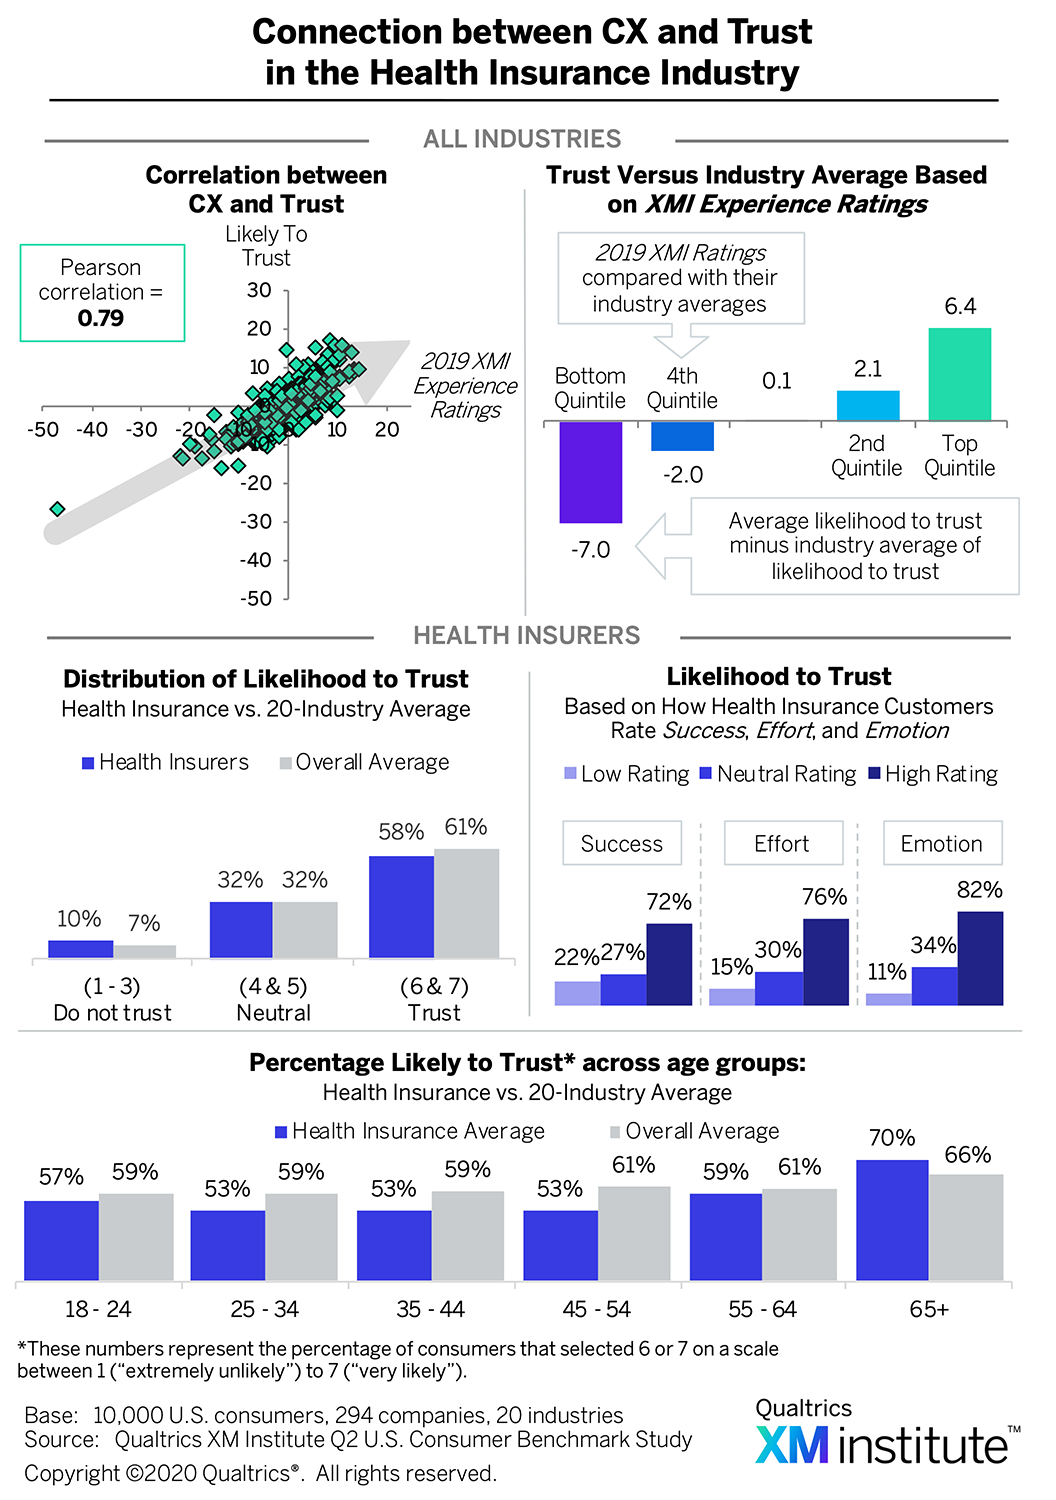 . And interestingly, while health insurance customers are slightly more distrustful of insurers than they are of other industries, the percentage of older customers who say that they trust their health insurer to take care of their needs is higher for this industry than the 20-industry average. However, health insurers still lag far behind the overall average for trust when it comes to middle age consumers.
 - Enjoy member stickiness. Nine percent of customers who interacted with a health insurer over the previous six months say that they had a bad experience – one of the highest levels across the 20 industries. However, only 21% of those customers who had a bad experience say that they either decreased or stopped spending after that poor interaction, which is tied for the lowest percentage for any industry
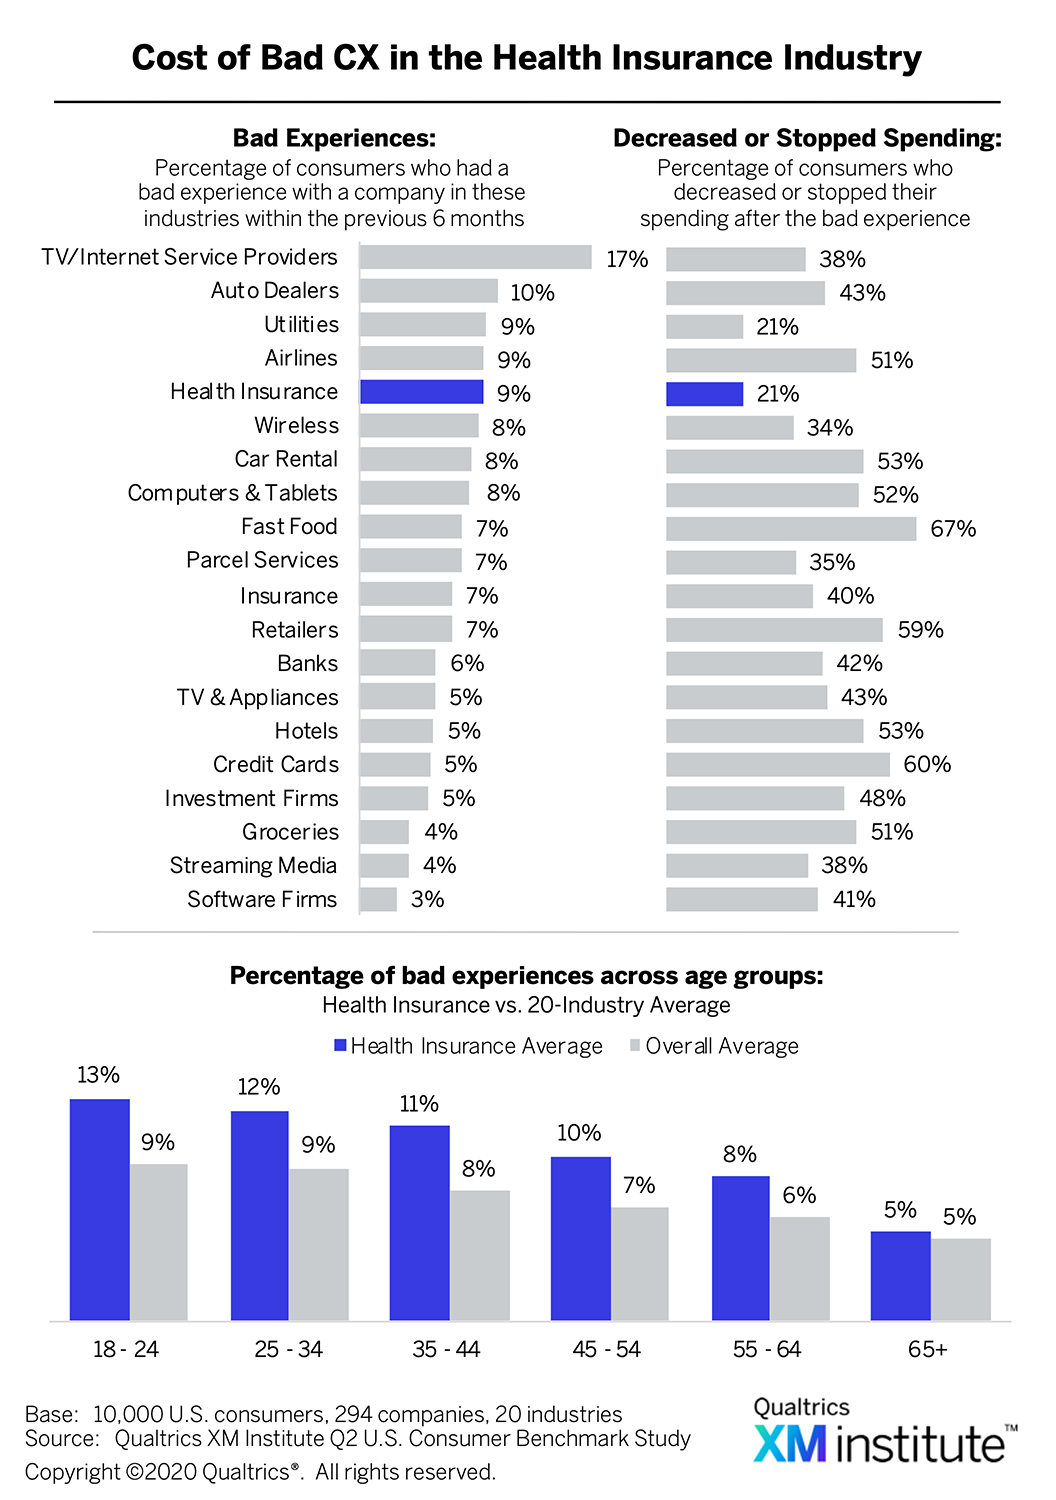 . We also found that the older health insurance customers are, the less likely they are to say that they had a bad experience with the insurer.
 - Struggle to explain coverage and resolve issues. Although “finding out if medical procedures or medications are covered” is the most broken journey – with 16% of health insurance customers saying it needs to be improved – customer service issues have the most significant impact on loyalty
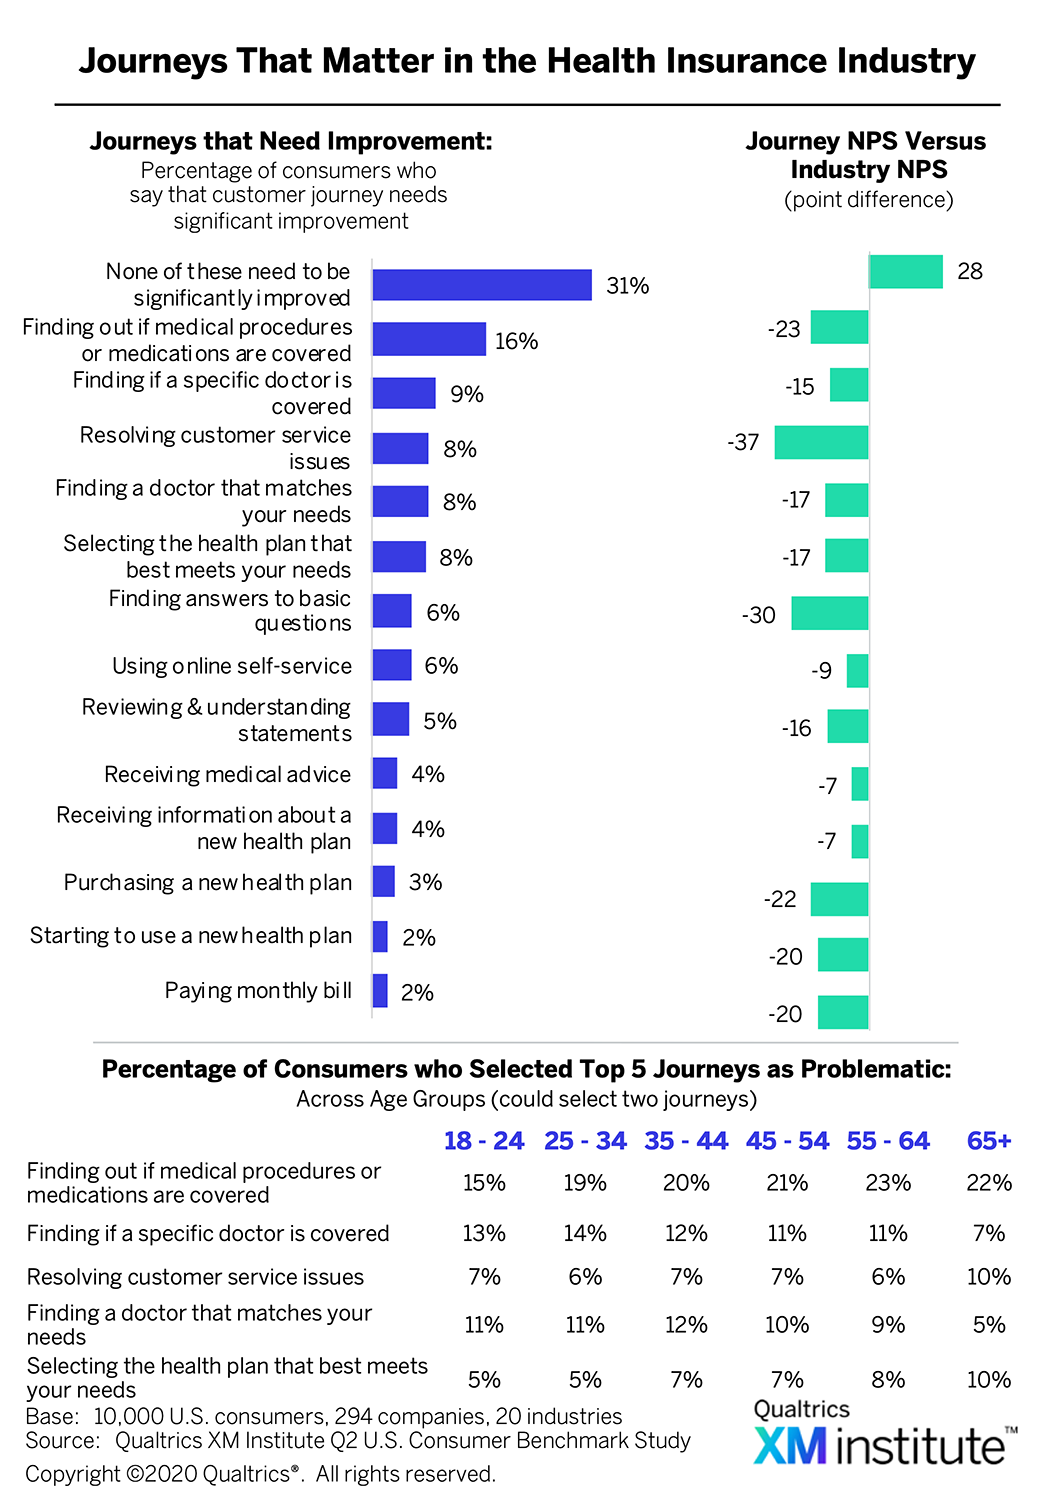 . Consumers who identified “resolving customer service issues” as the journey most in need of improvement give insurers an NPS that’s 37 points below the health insurance industry average score.
Propel Your Customer Experience to the Next Level
Health insurers face a difficult challenge. While industry dynamics are now shifting towards more consumer choice, historically these insurers have primarily focused on employer-driven models that limited consumer choice, and consequently, their cultures and processes are not consumer-centric. To thrive in this changing landscape, health insurers must establish Experience Management (XM) as an organizational discipline by mastering six XM Competencies and 20 XM Skills 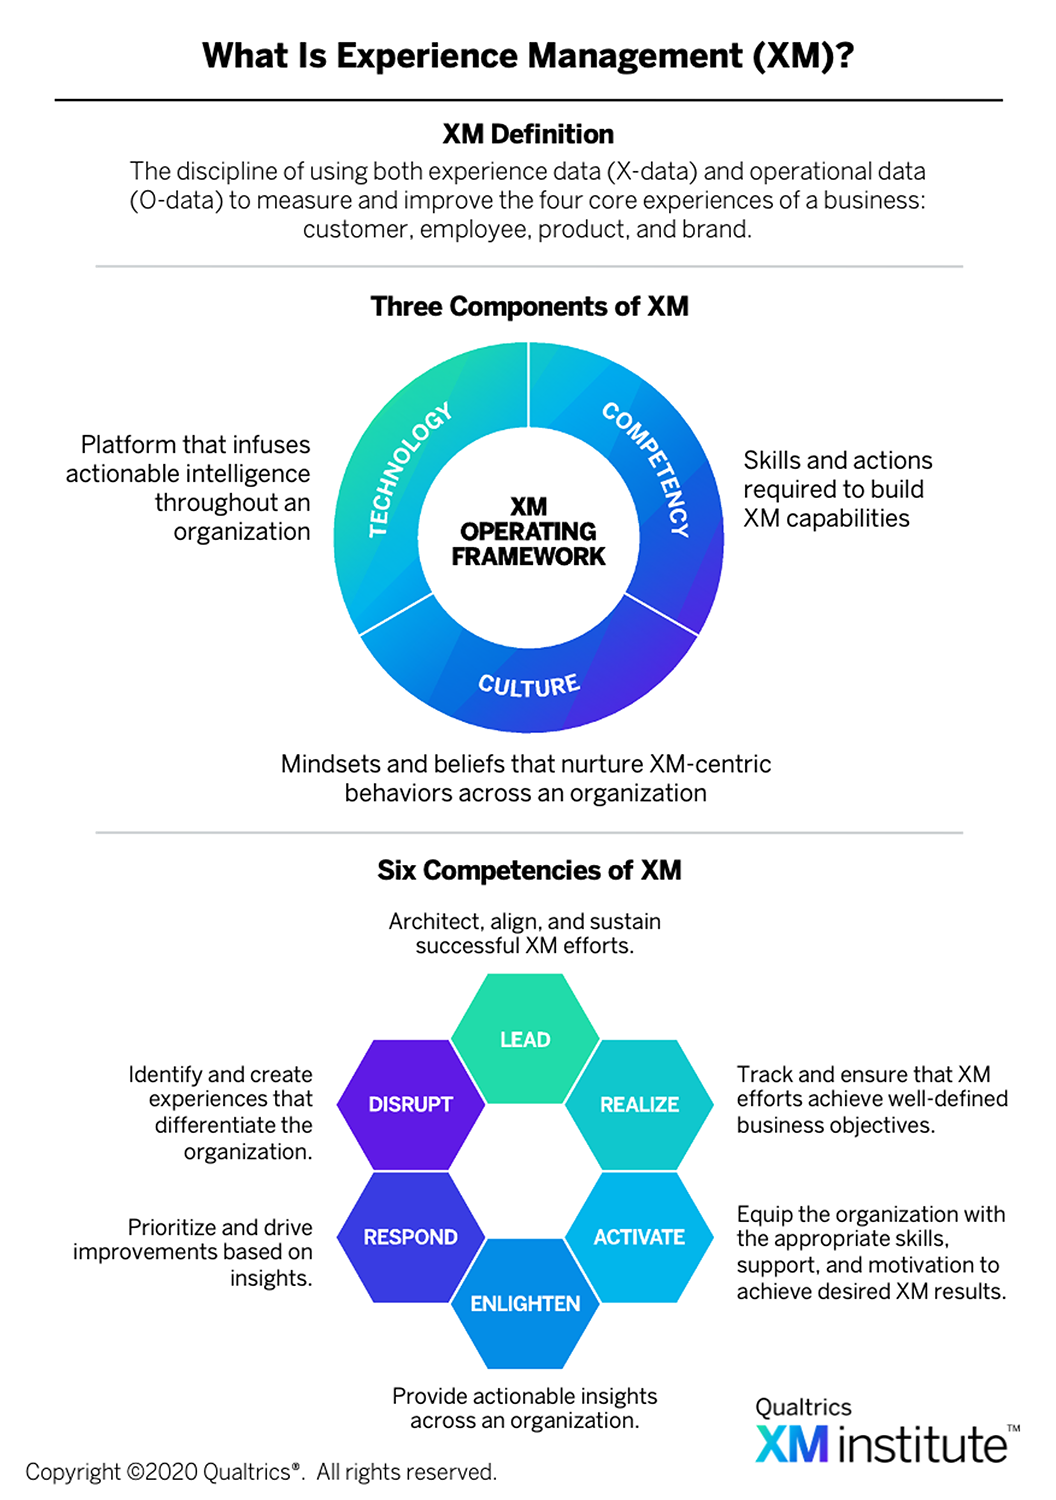 .6 These capabilities will help health insurers succeed in the new business environment by allowing them to:
- Continuously learn. Health insurers with strong XM Competencies and Skills will be able to continuously collect and analyze feedback and behavioral signals from the people who interact with them – gathering the information necessary for understanding the experiences, perceptions, and attitudes of their customers, employees, and prospects. For example, health insurers with robust XM capabilities will be able to identify which moments most affect the loyalty of key customer segments – such as figuring out whether a certain procedure is covered or finding a doctor – and then establish listening posts that collect ongoing insights about the quality of those interactions. These insights will include experience data (X-data) like NPS or satisfaction scores as well as operational data (O-data) like plan type or demographic information. Health insurers who are capable of combining these two types of data will be able to more accurately forecast the value of CX improvements and gain a deeper understanding of their members’ actual experiences. For instance, a health insurer may find that satisfaction scores for selecting a new health plan are particularly low for younger, first time members as they find navigating through all the different options confusing and overwhelming.
- Propagate insights. Once health insurers understand how the people who interact with them think, behave, and feel, they then need to get those insights into the hands of the people across their ecosystems who are best equipped to act on that information. For example, health insurers with strong XM skills will not only recognize that, say, selecting a new health plan is an important journey for members, they will also be able to quickly share qualitative and quantitative insights about those interactions with the people who are directly and indirectly responsible for delivering them. Furthermore, they will tailor both the content and the form of these insights for each role, with customized alerts triggered when certain criteria – such as a low NPS or CSAT score – are met.
- Rapidly adapt. Distributing customer insights in the right form to the right people across the organization will allow health insurers to act quickly on the intelligence they’ve collected and shared, thus enabling them to rapidly create or improve experiences in a way that addresses people’s changing needs and expectations. For example, customers’ feedback may highlight that understanding if a medical procedure is covered is a key moment of truth because the stakes are often so high. Using these insights, a health insurer could offer members a specific customer support line dedicated to helping them understand their coverage and staffed with agents who have received special empathy training.
- Data comes from the Qualtrics XM Institute Q2 2019 Consumer Benchmark Survey – an online study of 10,000 U.S. consumers completed during May 2019. Survey respondents were representative of the U.S. Census based on quotas for age, income, ethnicity, and geographic region.
- See the XM Institute report, “2019 XMI Customer Ratings – Overall,” (September 2019). The XMI Customer Ratings – Overall are a continuation of the Temkin Experience Ratings. The Ratings were renamed after Qualtrics purchased Temkin Group in October 2018.
- We developed ratings for each of the three components of an experience – success, effort, and emotion – by subtracting the percentage of consumers who rated a company poorly from the percentage of consumers who rated it highly.
- Although consumers rated a number of companies for our survey, we only analyzed the ones that received at least 100 consumer responses. Ultimately, we examined data from 294 companies across 20 industries. For this Industry Snapshot, data on health insurers comes from over 5,000 respondents evaluating their experiences with 10 large health insurers.
- See the XM Institute report, “2019 XMI Customer Ratings – Consumer NPS,” (October 2019).
- See the Qualtrics XM Institute report, “Operationalizing XM” (July 2019).


