Understanding the State of CX in the Automotive Industry
How does the quality of customer experience differ across industries? To address this question, the XM Institute conducted a large-scale benchmark study where we asked 10,000 U.S. consumers to rate their recent interactions with 294 organizations across 20 industries.1 In this Industry Snapshot, we examine the state of CX in the automotive industry. To develop this Industry Snapshot, we:
- Found the average XMI Customer Ratings – Overall for each industry. To generate the average CX rating for each industry, we asked respondents to evaluate their experiences with companies over the past 90 days.2 These questions – rated on a seven-point scale – covered the three components of an experience: success (were they able to accomplish their goals?), effort (how easy or difficult was it for them to accomplish their goals?), and emotion (how did the interaction make them feel?).3 We found the XMI Customer Rating – Overall for each of the 294 companies by averaging the ratings for these three experience components. We then calculated the average Customer Rating for each industry by averaging the Customer Ratings of the companies within each industry.4
- Calculated NPS. We asked respondents who had interacted with a company to answer the standard Net Promoter® Score (NPS®) question: How likely are you to recommend <company> to friends and colleagues? Consumers selected a response from 0 (not at all likely) to 10 (extremely likely). We then determined the percentages of each firm’s respondents who were promoters (selected 9 or 10), passives (selected 7 or 8), or detractors (selected between 0 and 6). We then calculated the NPS for each company by subtracting its percentage of detractors from its percentage of promoters.5
- Determined likelihood to repurchase and trust. We also asked consumers how likely they are to consider purchasing more products or services from the companies they had interacted with on a scale of 1 (extremely unlikely) to 7 (extremely likely). We also asked how likely they are to trust that the company would take care of their needs on a scale from 1 (do not trust at all) to 7 (completely trust).
- Established the frequency and effects of poor experiences. We asked respondents to identify which organizations they recently had a poor experience with and then asked, “Since the time that you had a bad experience with these companies, how have you changed the amount of money you spend with them?” They could answer that their spending completely stopped, it decreased, it didn’t change, it increased, or that they haven’t spent any money with that company.
- Identified the most broken customer journeys. To better understand which types of interactions are most likely to affect the customer’s perception of an organization, we asked respondents to identify which journey within a certain industry needs the most improvement. We also looked at the correlation between which journeys a customer identified as broken and how likely that customer was to recommend the company.
Auto Dealers Deliver Average CX
When we looked at the current state of customer experience in the automotive industry and how it compared to the broader CX landscape, we found that auto dealers:
- Receive average Customer Ratings scores. Auto dealers received an average XMI Customer Rating – Overall score of 64% and tied for 9th place out of 20 industries
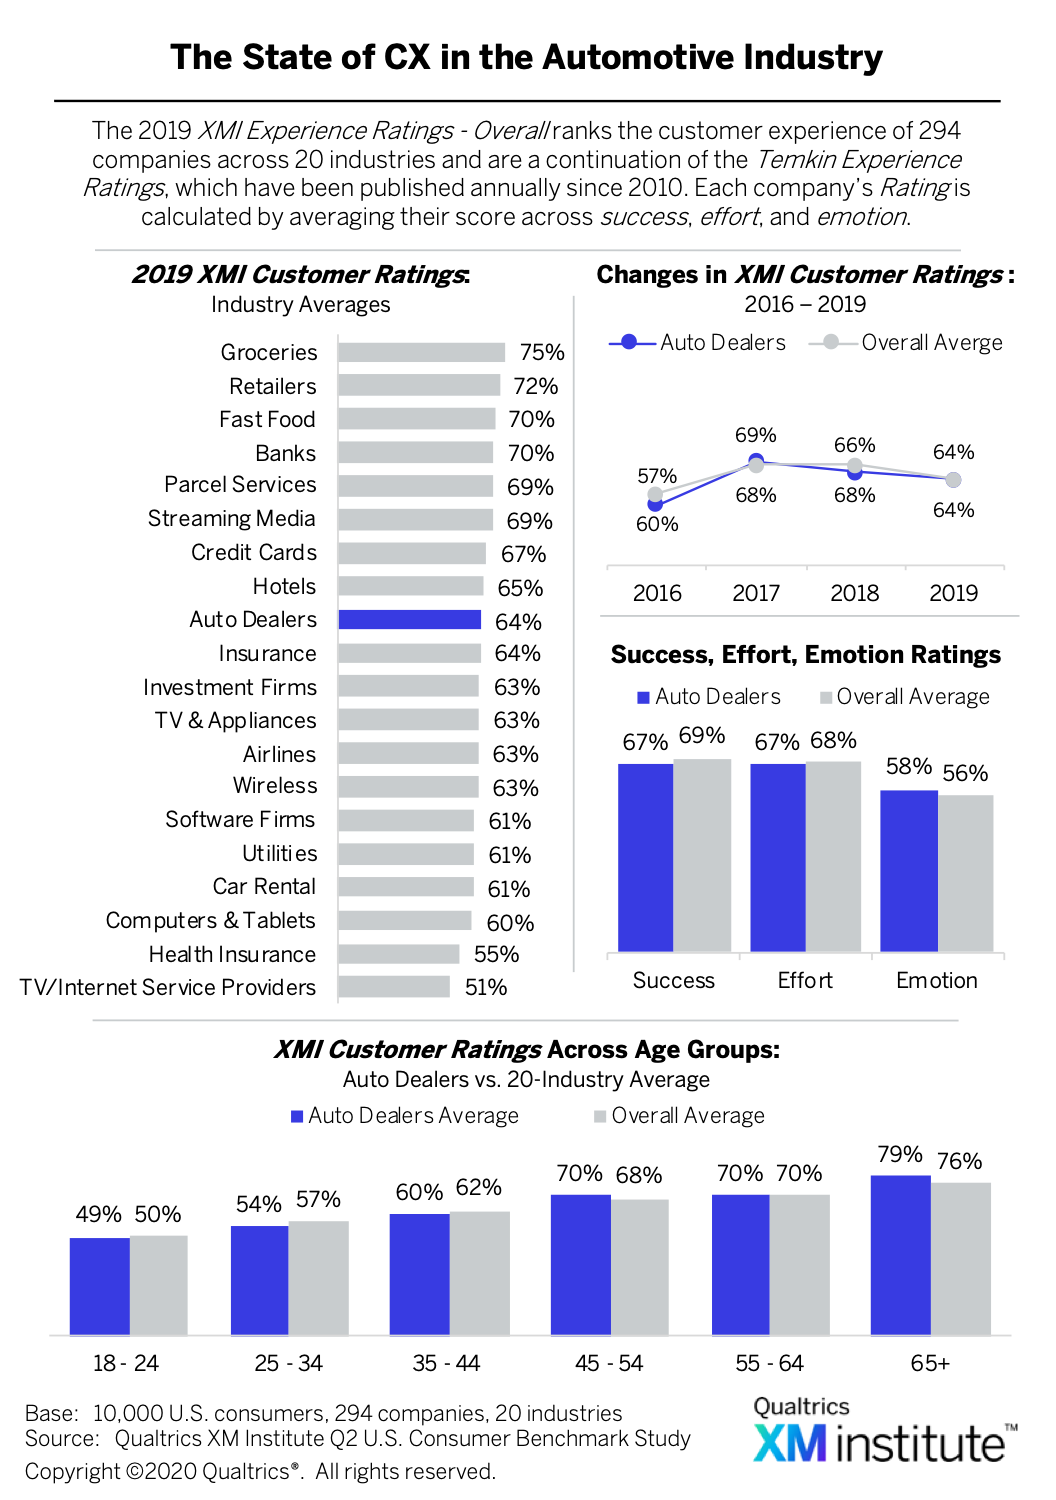 . When we looked at how auto dealers performed across the three components of an experience – success, effort, and emotion – compared to the average of all 20 industries, we found that, although they are slightly behind the overall average for both success and effort, they are actually ahead for emotion. This is good news for auto dealers as, of the three components, emotion is most strongly correlated with customer loyalty and tends to have the lowest scores.
 - Enjoy an above-average industry NPS. We found a strong connection between customers’ experiences and their likelihood to recommend a company. Companies that significantly outperformed their industry’s average XMI Customer Ratings also earned a significantly higher-than-average NPS
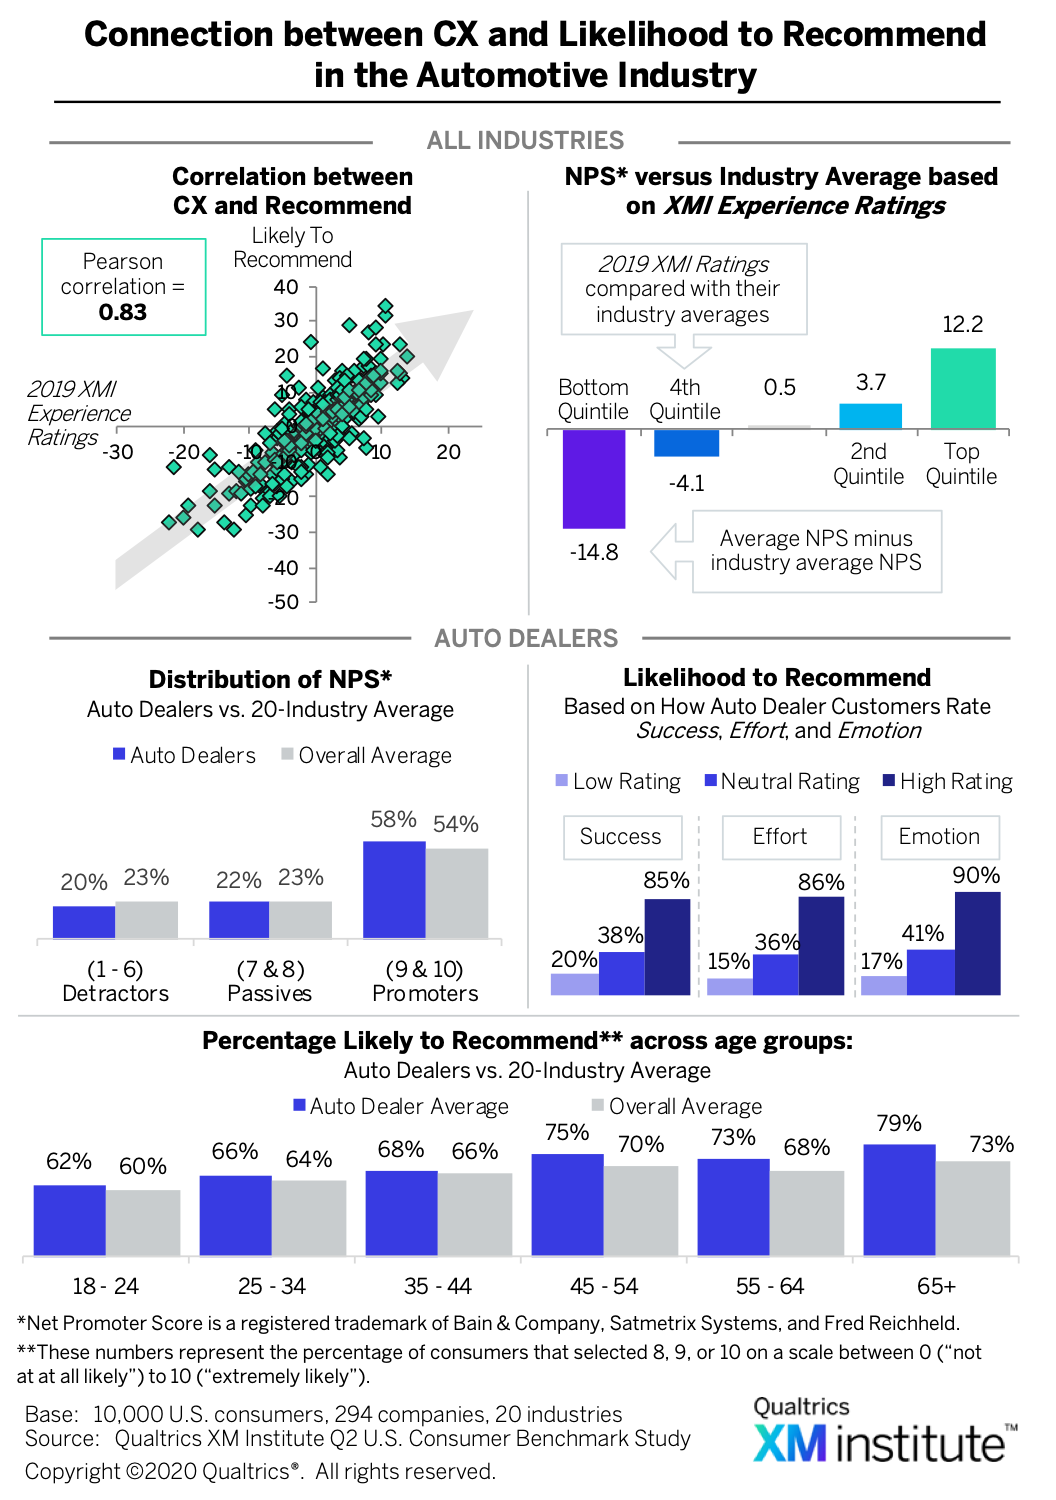 . Compared to the 20-industry average, auto dealers have a slightly higher percentage of consumers who say that they are likely to recommend the company. To boost their number of promoters, auto dealers should focus on the emotion component of customer experiences as, of the three elements, it most significantly impacts likelihood to recommend. An impressive 90% of customers who gave auto dealers a high score in emotion say that they are likely to recommend the company.
 - Have enthusiastic older customers. Customer experience is strongly related to a consumer’s likelihood to rebuy from a company, with a correlation coefficient of 0.85
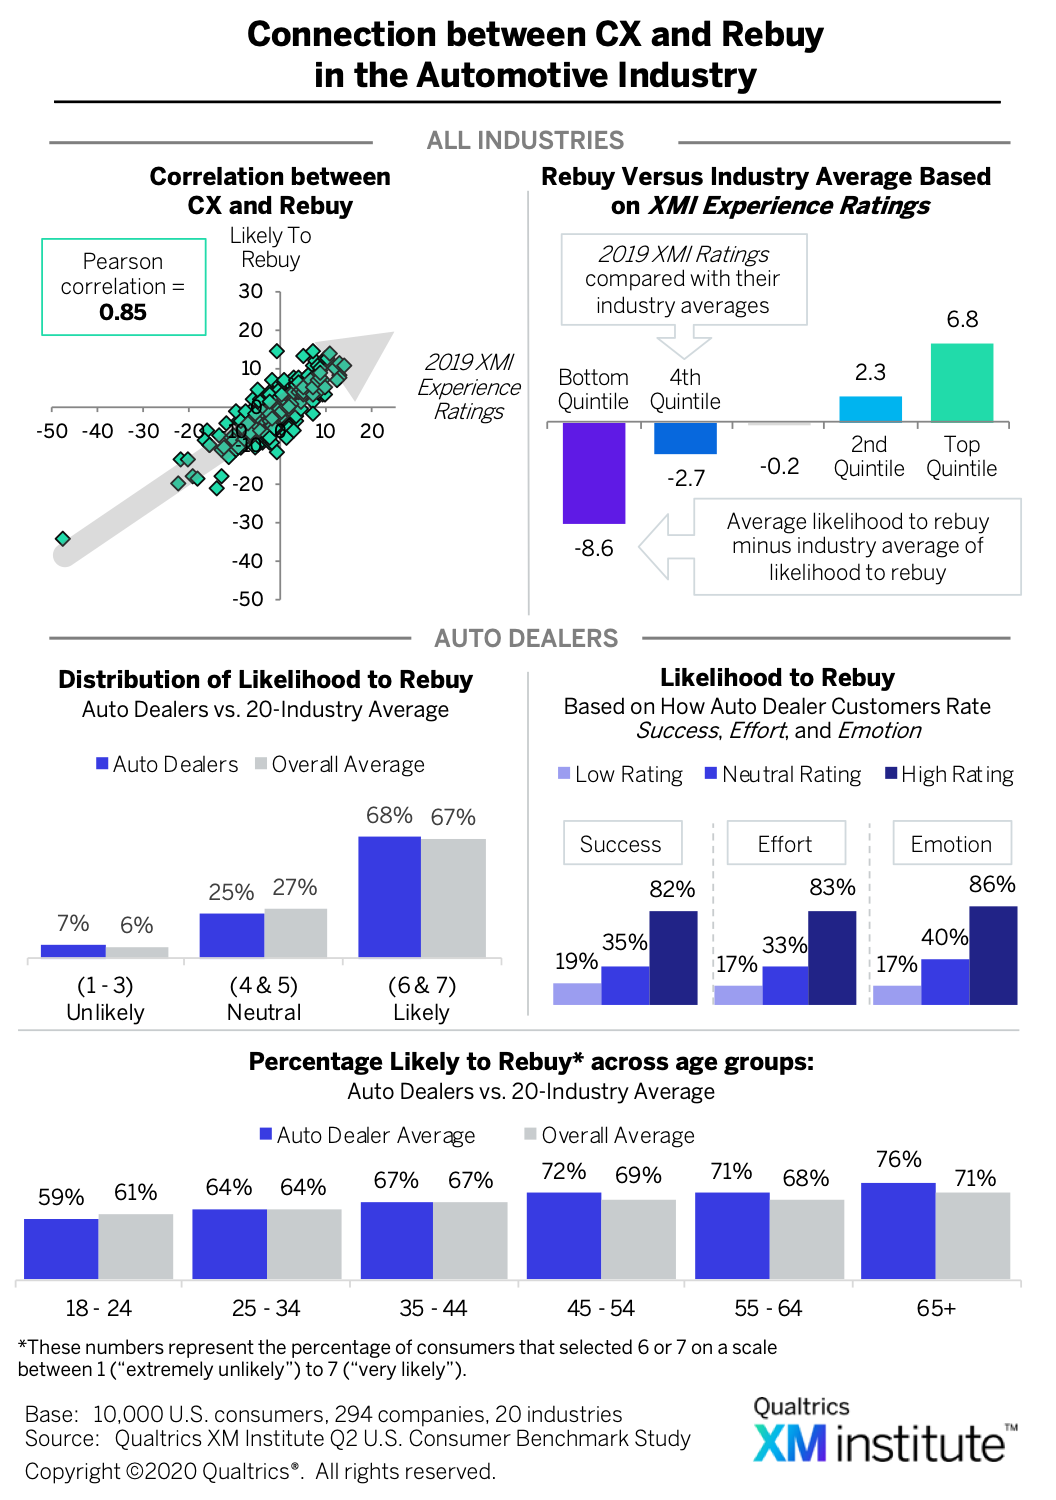 . While the percentage of automotive customers who say they are likely to repurchase from the company is almost identical to the 20-industry average, auto dealers perform significantly better than the overall average amongst customers who are older than 65.
 - Earn the trust of consumers of all ages. While a customer’s experience with a company does impact their likelihood to trust that company, the correlation is slightly weaker than it is for their likelihood to recommend or repurchase
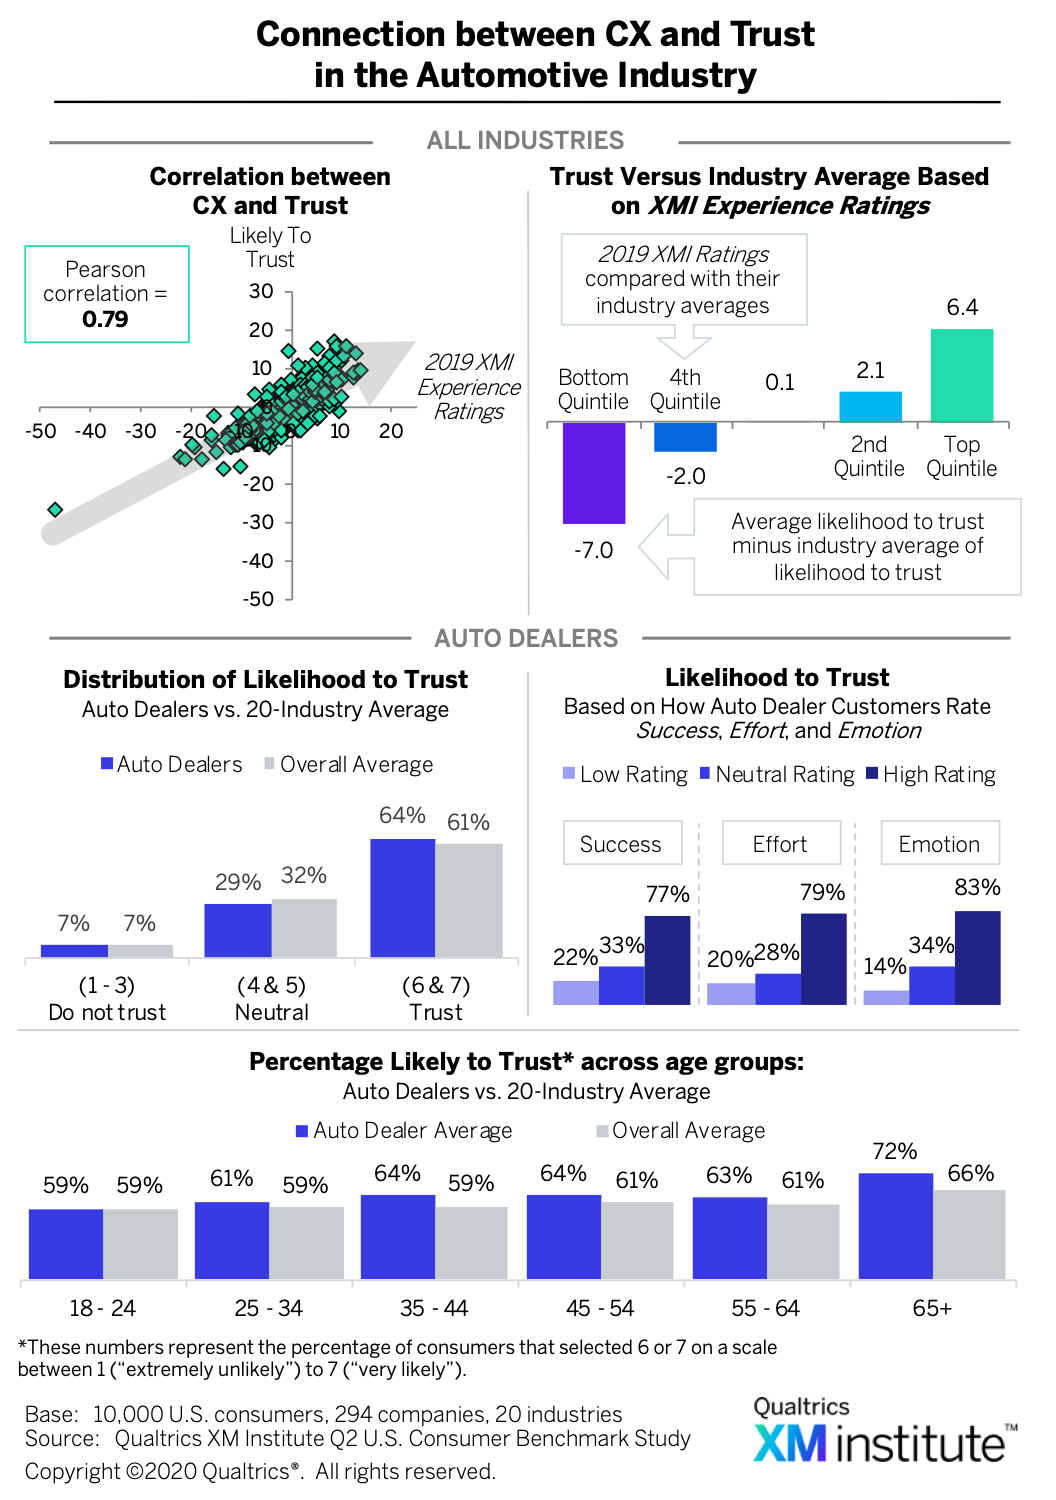 . The percentage of customers who say they trust auto dealers to take care of their needs is three percentage-points higher than the 20-industry average. Across all age groups, automotive customers are more likely to trust an auto dealership compared to the overall average, with the exception of the younger age group where the two groups are tied.
 - Frequently deliver poor experiences. Although auto dealers perform slightly better than the cross-industry average on the other CX dimensions we evaluated, they deliver the second highest percentage of poor experiences, with 10% of customers who interacted with an auto dealer over the previous six months saying that they had a bad experience
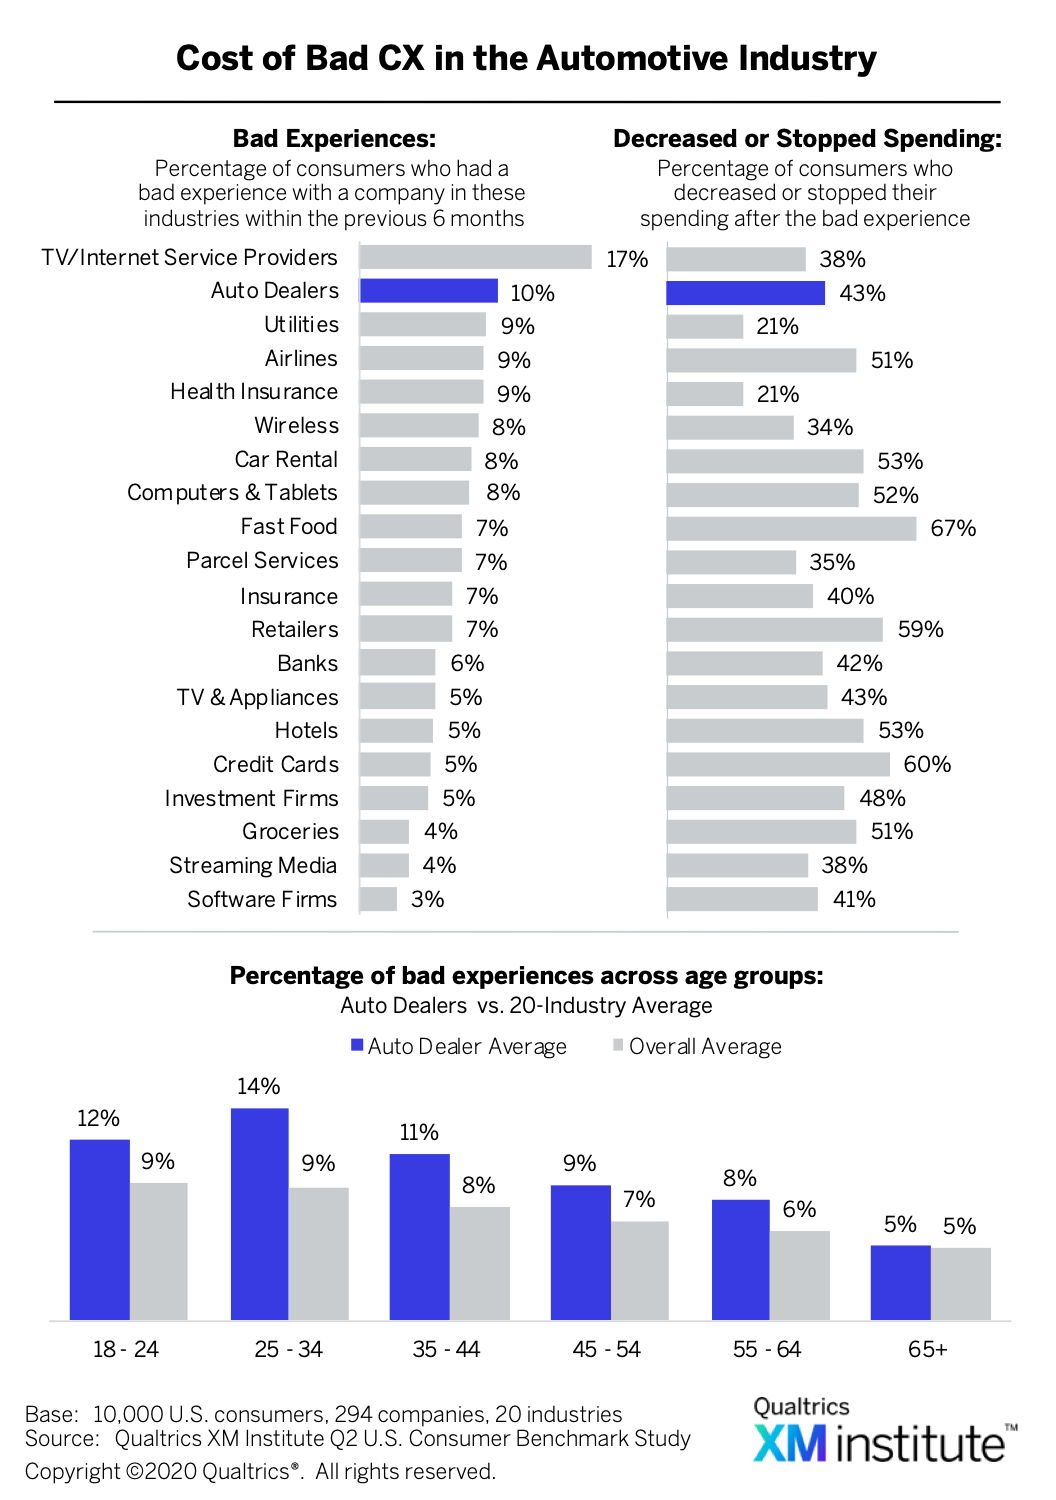 . Of those who had a bad experience, 43% report either decreasing or stopping their spending after that poor interaction. The age group that is most likely to report having a bad experience with an auto dealer are 25- to 34-year-olds.
 - Struggle during car service journeys. Thirteen percent of customers identified “getting service on a car” as in need of significant improvement
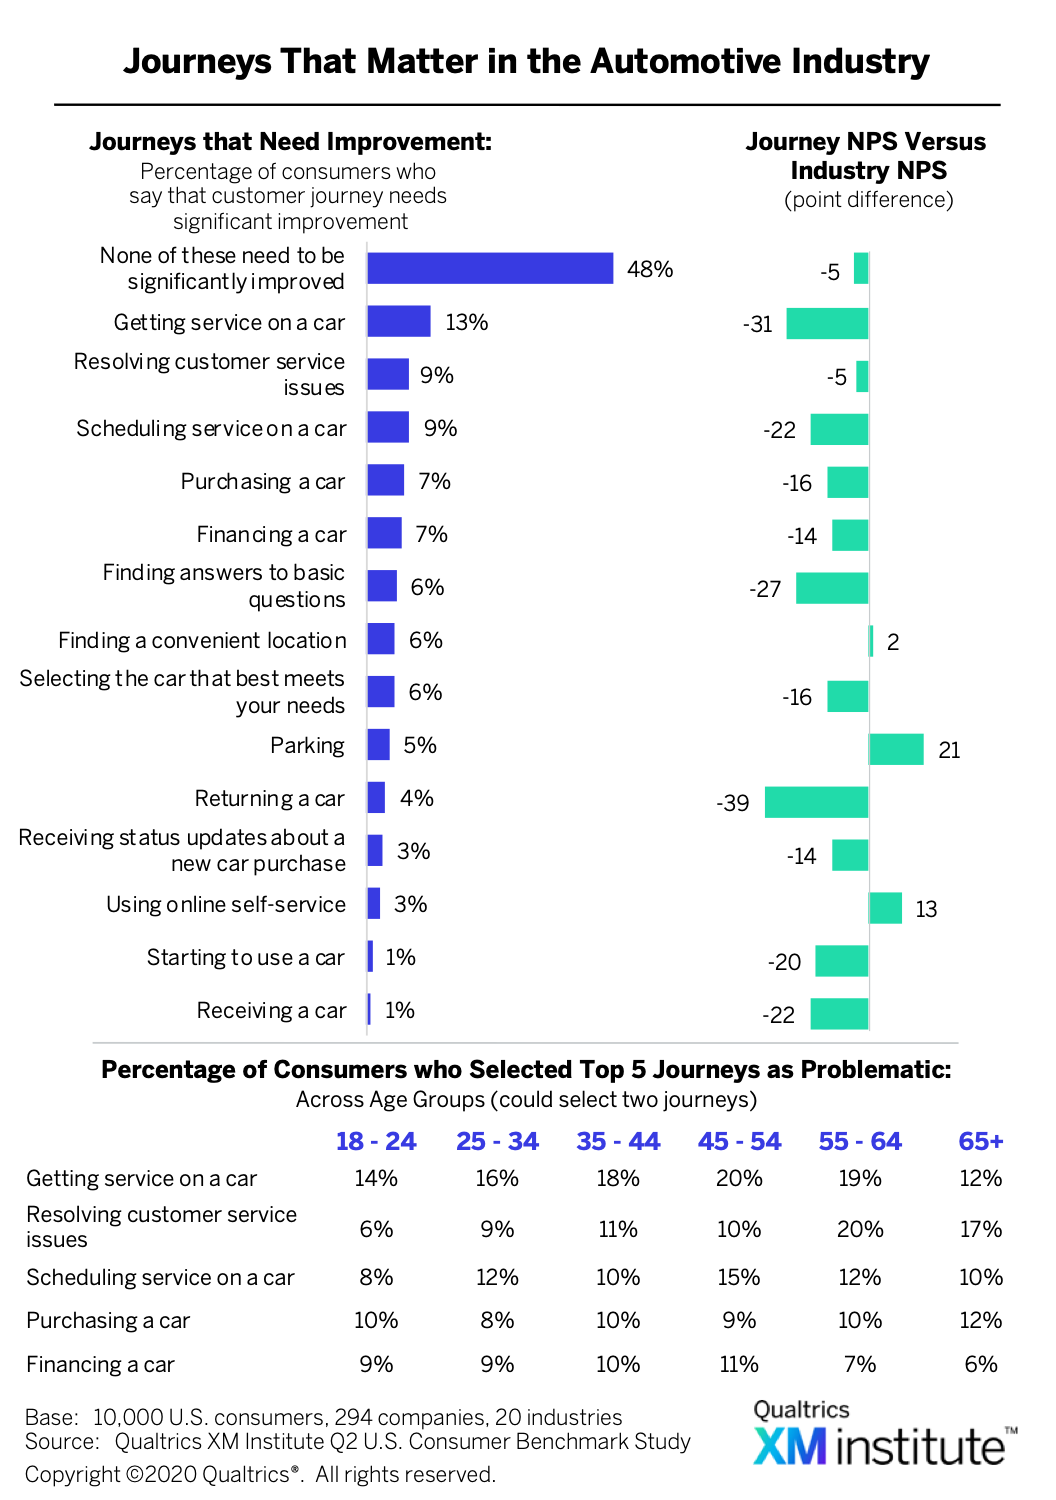 . Customers who selected this journey as broken had an average NPS that was 31 points lower than the industry average. And while only 4% of customers selected “returning a car” as the most in need of improvement, those who did gave auto dealers an average NPS that was 39 points lower than the industry’s average.
Propel Your Experience Management to the Next Level
Although the automotive industry overall receives average customer experience ratings, there is a significant difference between the auto dealers who do CX well and those who do it poorly. Additionally, auto dealers frequently struggle to deliver consistent experiences across their networks of independent franchisees, some of which own many brands or belong to large dealer groups. To overcome these challenges and remain competitive within the industry, auto dealers must establish Experience Management (XM) as an organizational discipline by mastering six XM Competencies and 20 XM Skills 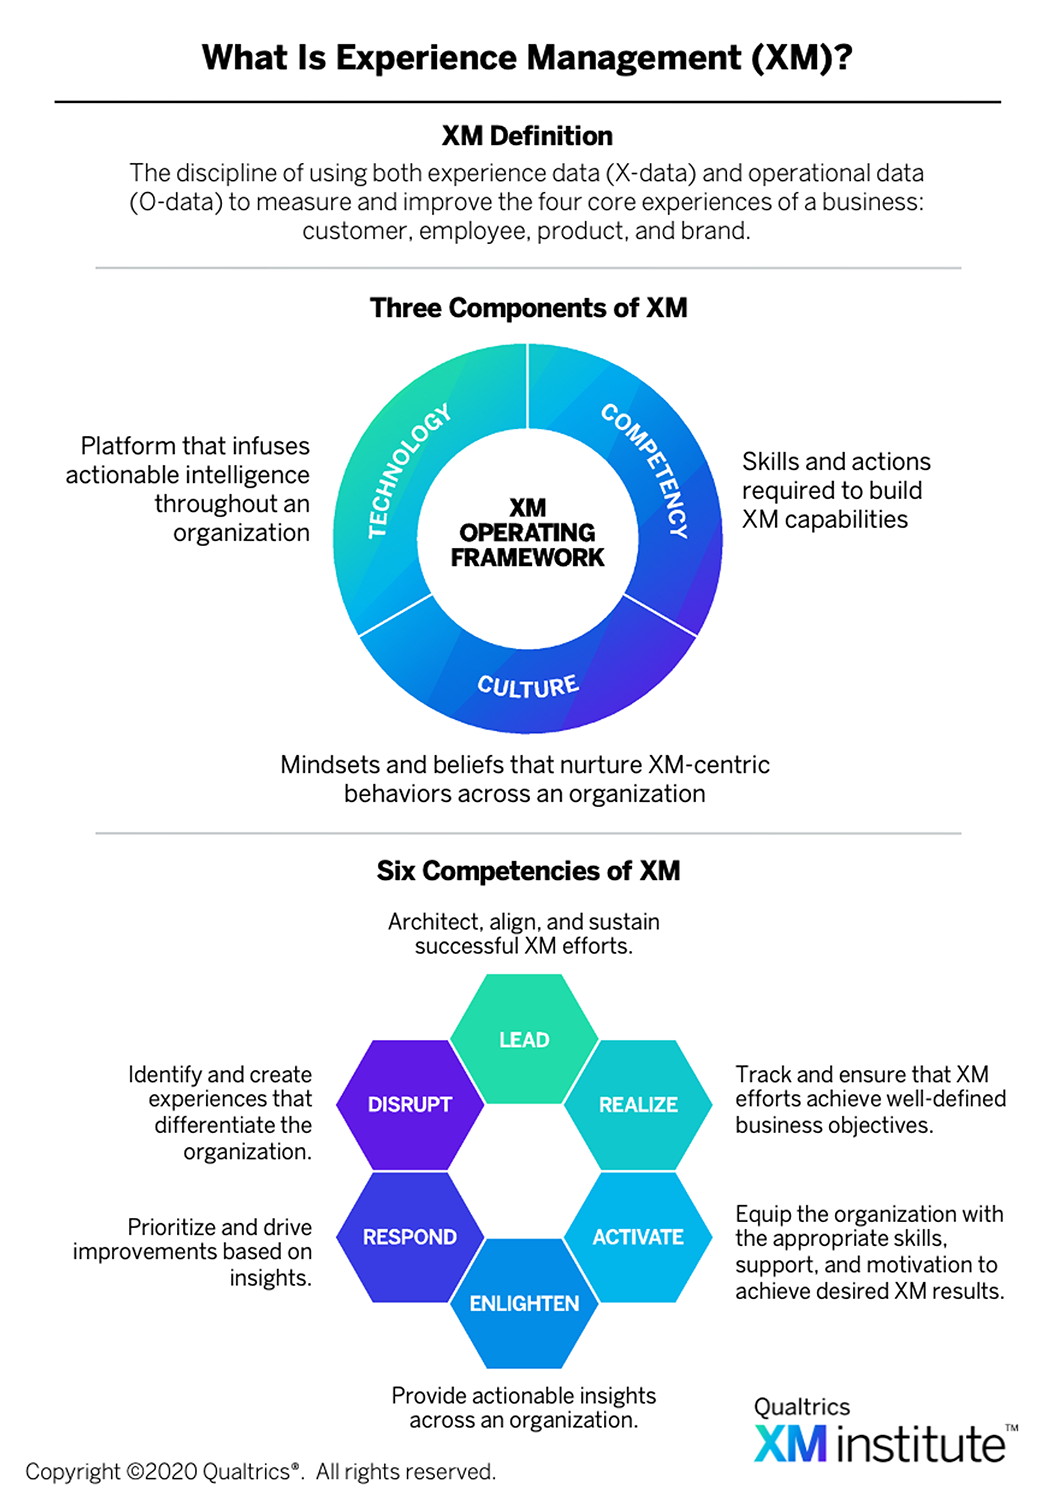 .6 These capabilities will help auto dealers succeed in the new business environment by allowing them to:
- Continuously learn. Auto dealers with strong XM Competencies and Skills will be able to continuously collect and analyze feedback and behavioral signals from people who interact with them – gathering the information necessary for understanding the experiences, perceptions, and attitudes of their customers, employees, and prospects. This requires them to shift away from their traditional collection practices, which incentivize employees to game the system and pressure customers for good scores rather than useful insights. Instead, these new XM capabilities will enable auto dealers to first identify which moments most affect the loyalty of key customer segments – such as returning or getting service done on a car – and then establish listening posts that collect feedback and signals about the quality of those interactions. For instance, an auto dealer may find that younger customers tend to give it lower satisfaction scores after getting their car serviced because they don’t know what to expect during the process and don’t understand a number of charges on their bill.
- Propagate insights. Once auto dealers understand how the people who interact with them think, behave, and feel, they then need to get those insights into the hands of the people across their ecosystems who are best equipped to act on that information. For example, auto dealers with strong XM skills will not only recognize that, say, getting a car serviced is a key moment of truth for customers, they will also be able to quickly share qualitative and quantitative feedback about those interactions with the people who are directly and indirectly responsible for delivering them, such as mechanics and general managers. Furthermore, they will tailor both the content and the form of these insights for each role, with customized alerts triggered when certain criteria – such as a low NPS or CSAT score– are met.
- Rapidly adapt. Distributing customer insights in the right form to the right people across the organization will allow auto dealers to act quickly on the intelligence they’ve collected and shared, thus enabling them to rapidly create or improve experiences in a way that addresses people’s changing needs and expectations. For example, auto dealers may institute weekly huddles where frontline teams discuss customers’ feedback about getting their car serviced and brainstorm ways to improve this journey. After implementing their improvement ideas, the teams could ensure the changes are having the intended effect by continuing to monitor customer feedback and tweaking the experience until they achieve the desired result.
- Data comes from the Qualtrics XM Institute Q2 2019 Consumer Benchmark Survey – an online study of 10,000 U.S. consumers completed during May 2019. Survey respondents were representative of the U.S. Census based on quotas for age, income, ethnicity, and geographic region.
- See the XM Institute report, “2019 XMI Customer Ratings – Overall,” (September 2019). The XMI Customer Ratings – Overall are a continuation of the Temkin Experience Ratings. The Ratings were renamed after Qualtrics purchased Temkin Group in October 2018.
- We developed ratings for each of the three components of an experience – success, effort, and emotion – by subtracting the percentage of consumers who rated a company poorly from the percentage of consumers who rated it highly.
- Although consumers rated a number of companies for our survey, we only analyzed the ones that received at least 100 consumer responses. Ultimately, we examined data from 294 companies across 20 industries. For this Industry Snapshot, data on auto dealers comes from over 4,000 respondents evaluating their experiences with 19 large auto dealers.
- See the XM Institute report, “2019 XMI Customer Ratings – Consumer NPS,” (October 2019).
- See the Qualtrics XM Institute report, “Operationalizing XM” (July 2019).


