Customer Experience Management Within Large Firms
Our research shows that although customer experience (CX) is highly correlated to customer loyalty, very few companies currently deliver excellent CX 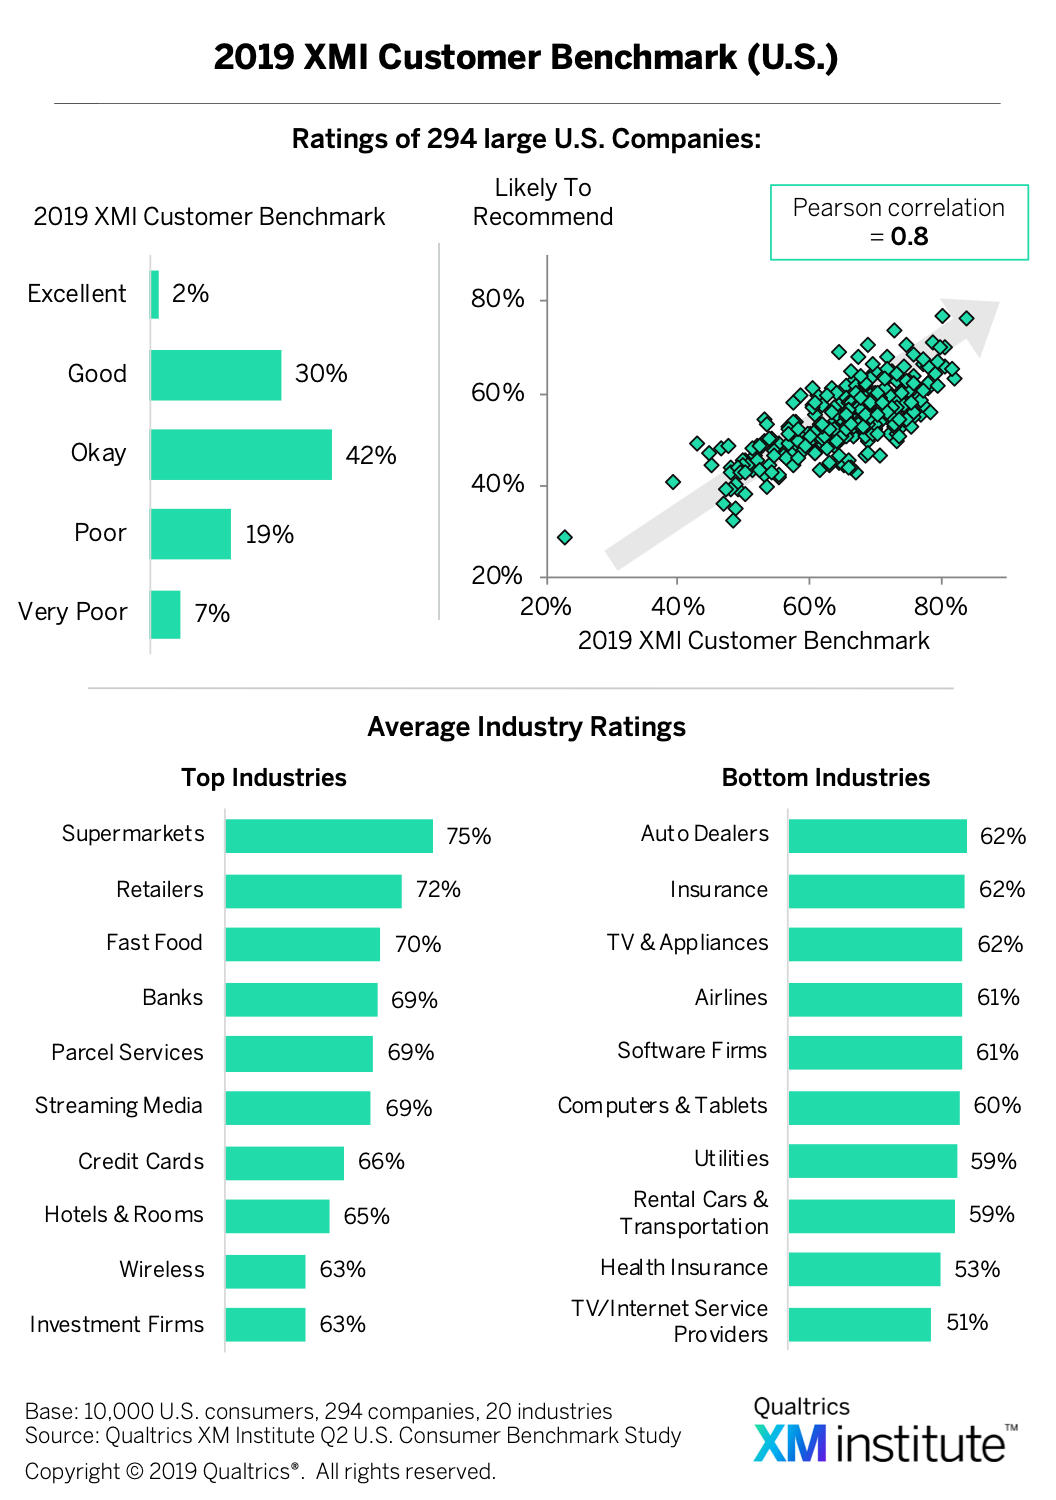 .1 To understand the present state of companies’ CX management efforts, we surveyed 212 CX professionals from large companies.2 The results of this survey show that:
- Companies plan to increase their focus on CX. Eighty-one percent of respondents expect their organizations to focus more on CX over the next 12 months than they did the previous year, while only four percent expect their organizations to focus on it less
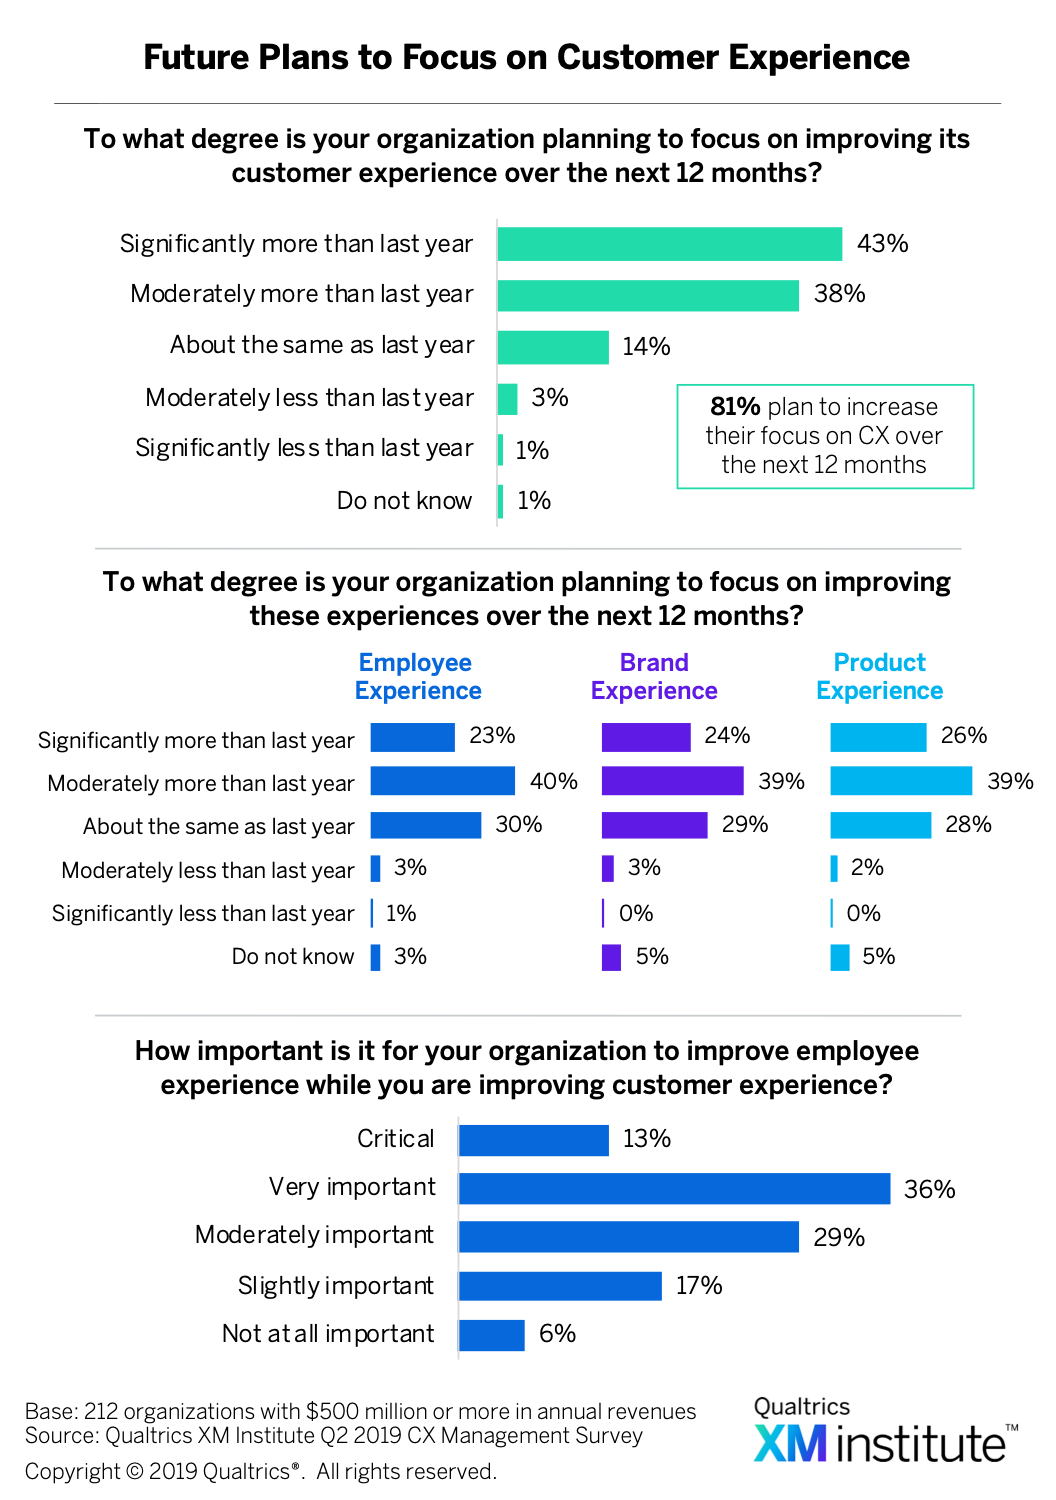 . Companies are planning to concentrate more on their other core experiences as well. For instance, more than three-quarters of respondents consider it at least “moderately important” to improve their employee experience at the same time as they’re improving their customer experience.
 - Most have centralized CX leadership. We found that 65% of respondents have a senior executive in charge of CX across products and channels, while 69% have a centralized CX group
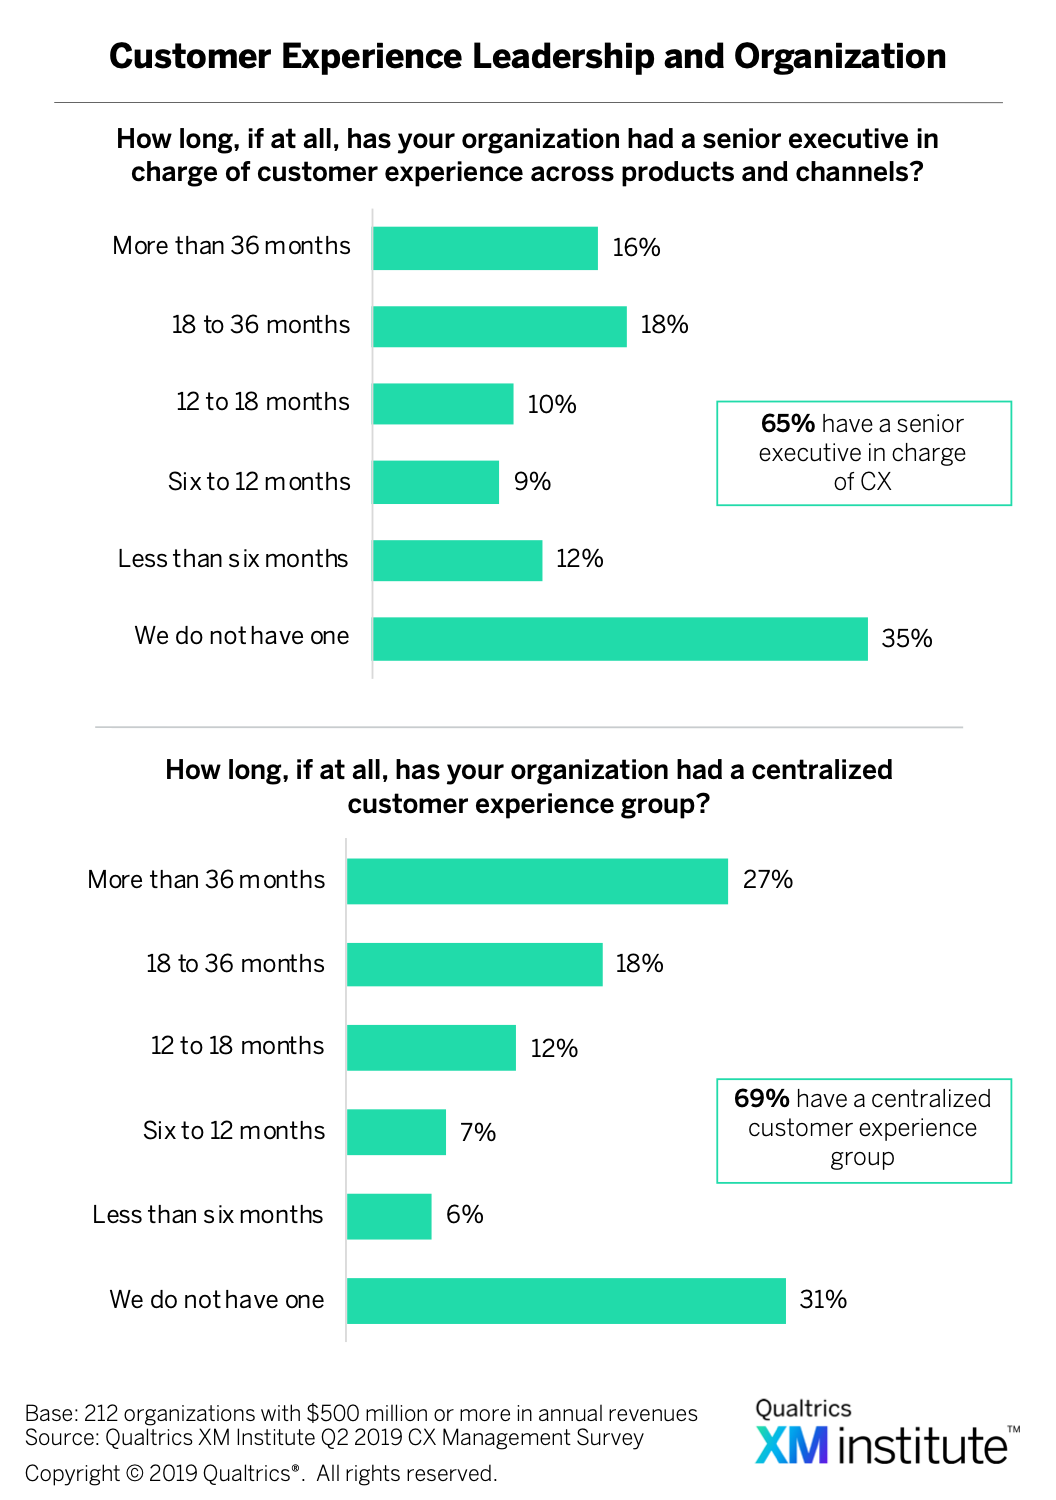 . More than two-thirds of the companies have had these corporate elements in place for 12 months or more.
 - Most CX teams have fewer than 10 FTEs. Forty-five percent of respondents report that their CX efforts are significantly coordinated across their organization
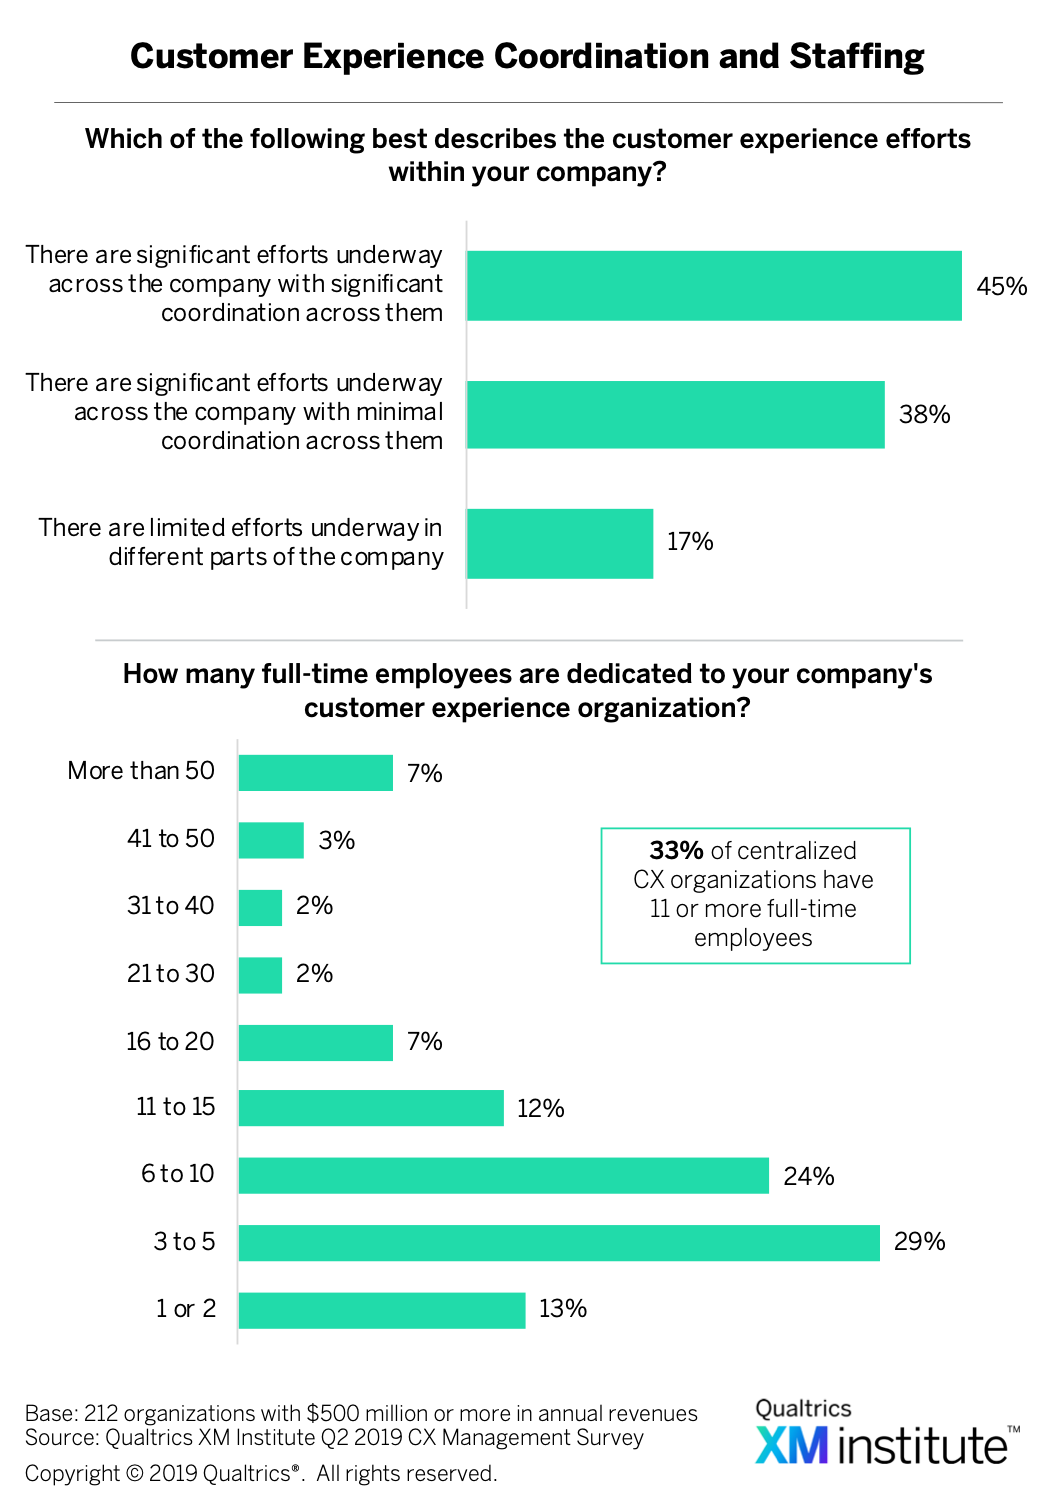 . Of the companies with centralized CX teams, the median firm has six to ten full-time CX employees. One-third of respondents have 11 or more full-time CX employees.
 - Humans deliver the best experiences. When we asked respondents to evaluate the experiences they deliver across multiple channels, the two experiences they rated most highly were on the phone with an agent and in a store/branch
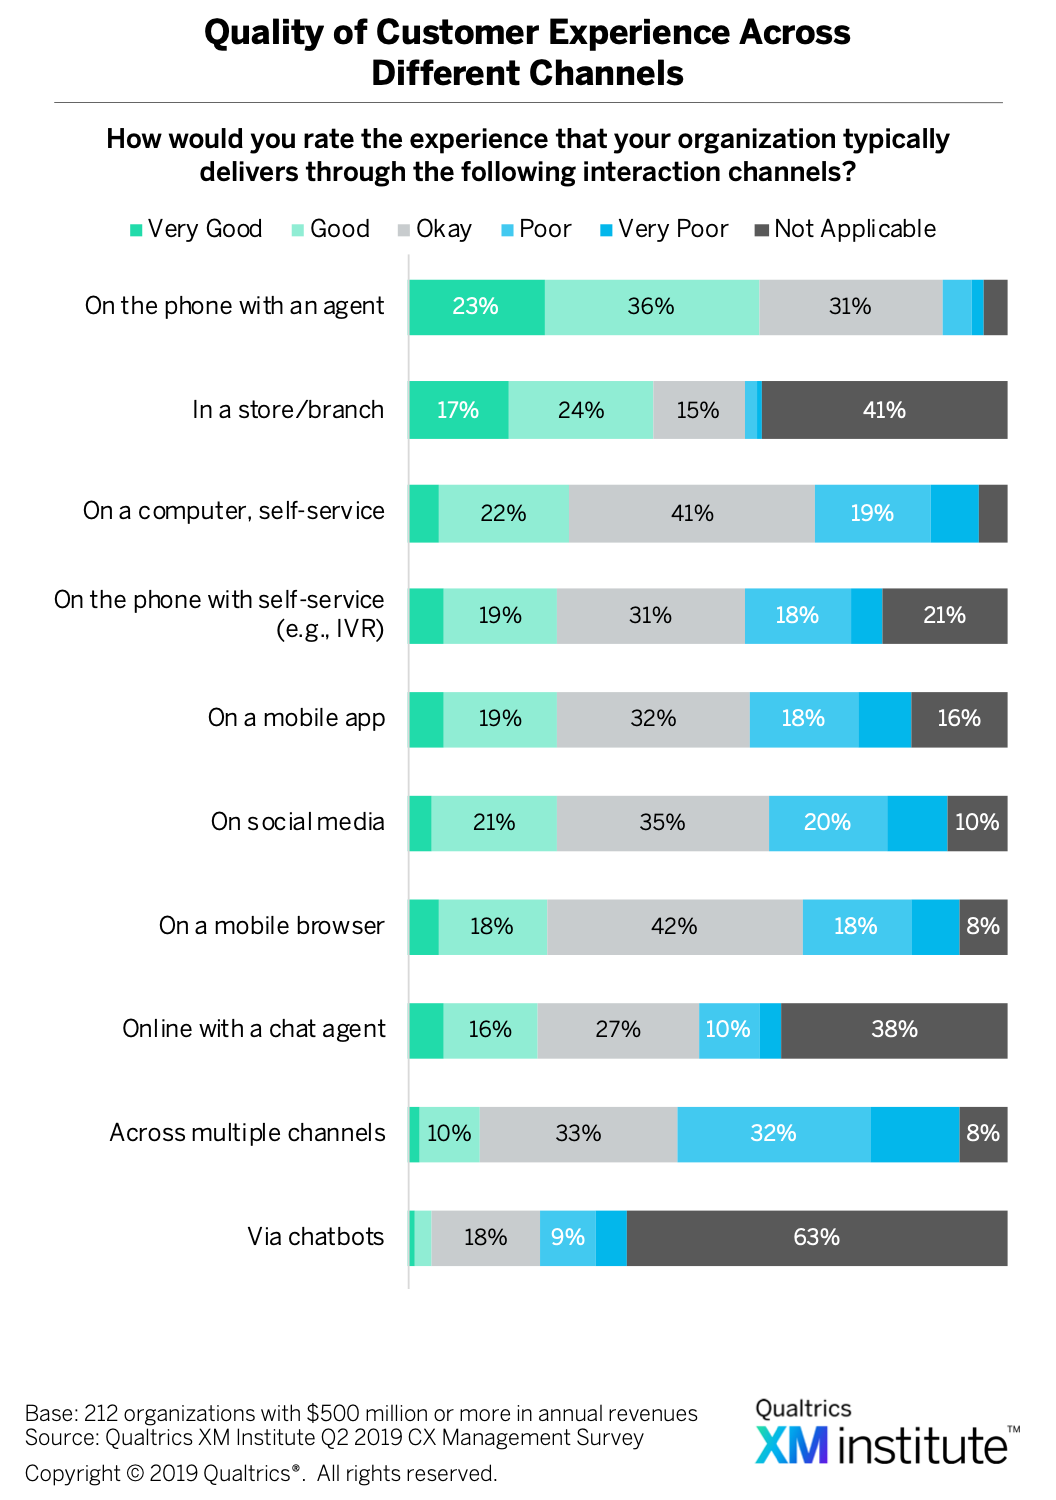 . Conversely, respondents gave via chatbots and across multiple channels the lowest ratings.
 - Companies struggle most with competing priorities. What challenges do companies typically encounter as they work to improve their CX? Fifty-nine percent of respondents identified other competing priorities as a significant obstacle to their CX efforts
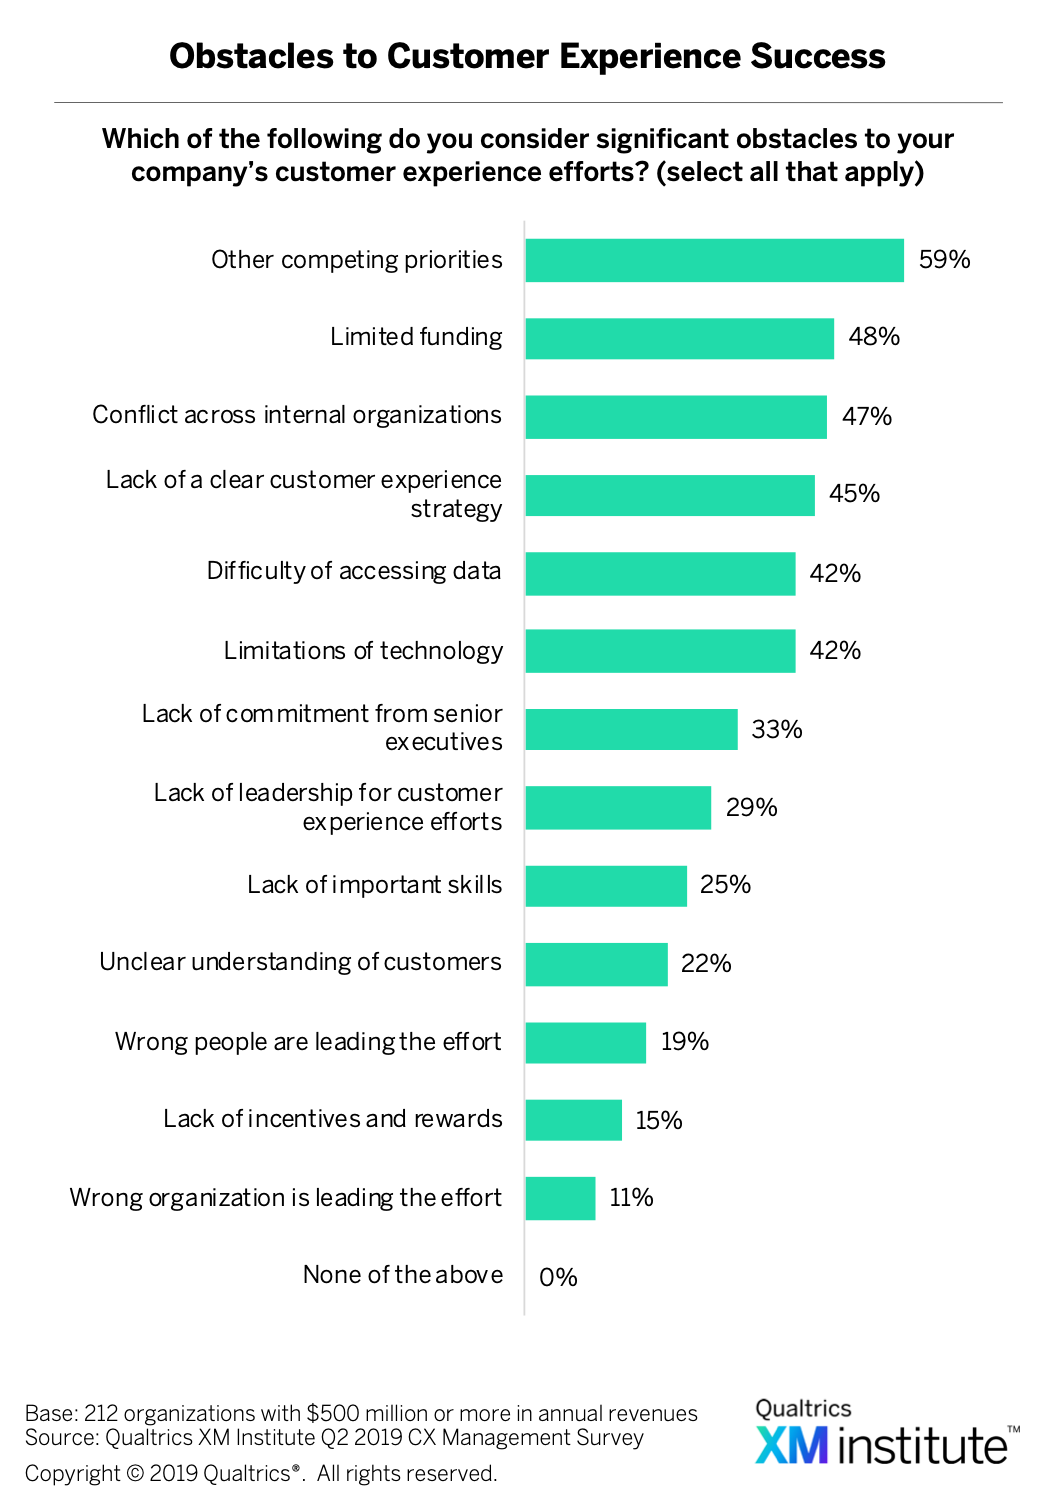 . The next most frequently cited obstacles are limited funding (48%), conflict across internal groups (47%), and lack of a clear customer experience strategy (45%).
Assessing the Six XM Competencies
The Qualtrics XM Institute has identified six XM Competencies – LEAD, REALIZE, ACTIVATE, ENLIGHTEN, RESPOND, and DISRUPT – that organizations must build in order to deliver consistently positive, targeted experiences to their customers 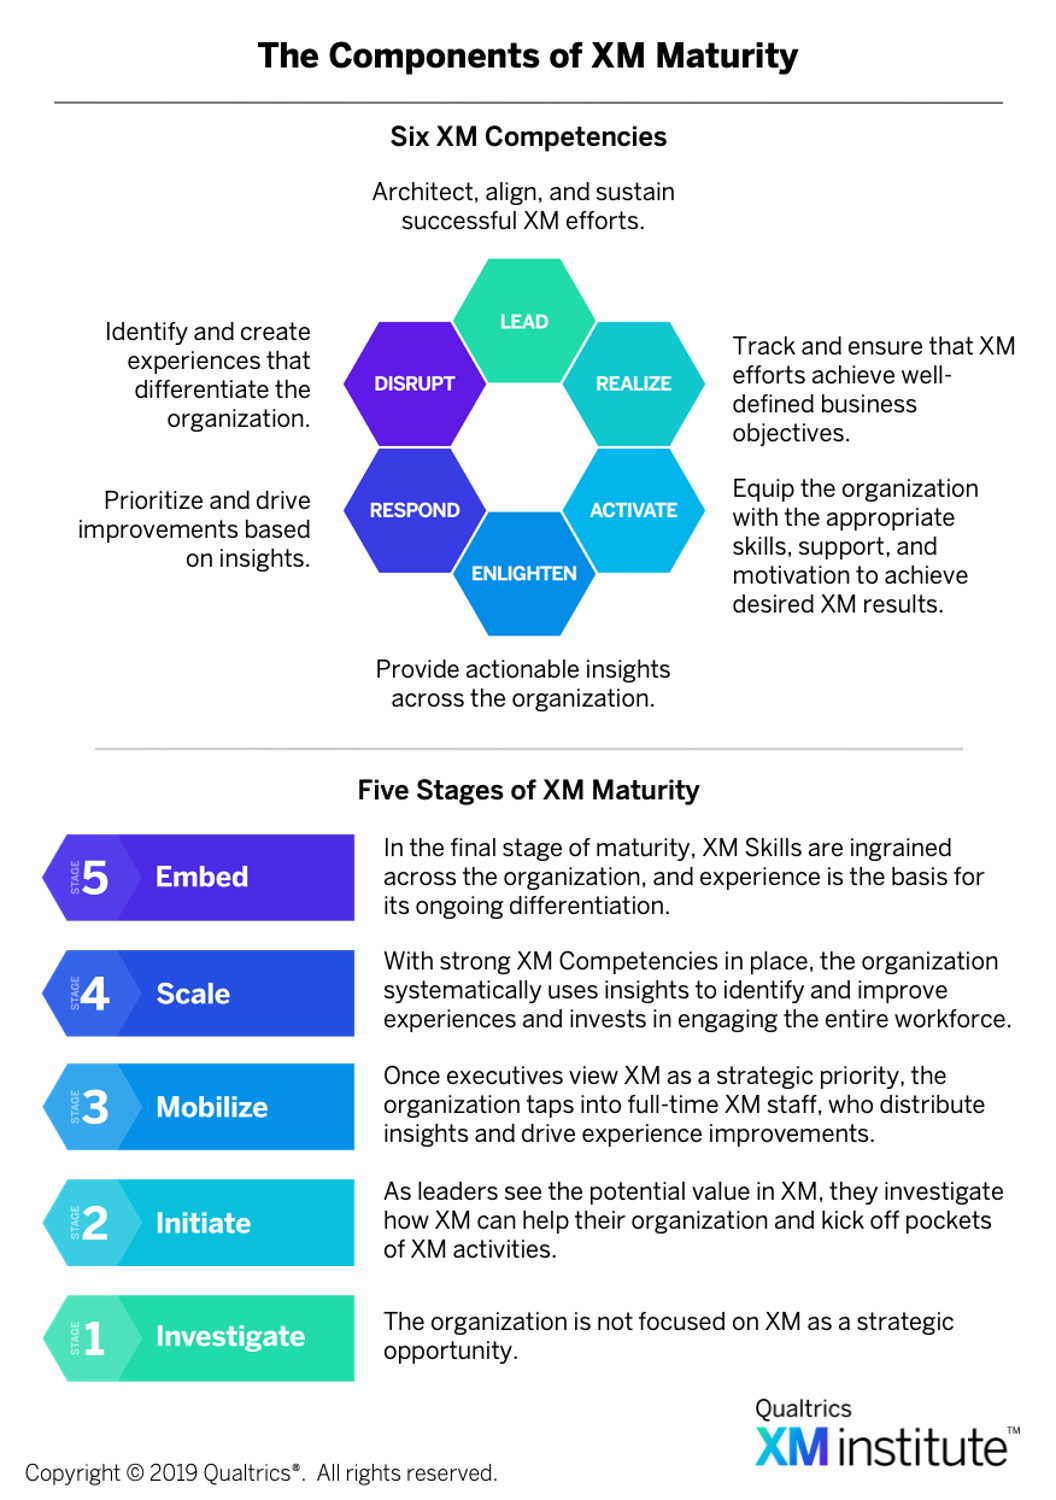 ,
,  .3 As organizations master these six Competencies, they will evolve through five stages of XM maturity. In this report, we asked respondents a series of questions from the CX version of our XM Competency & Maturity Assessment
 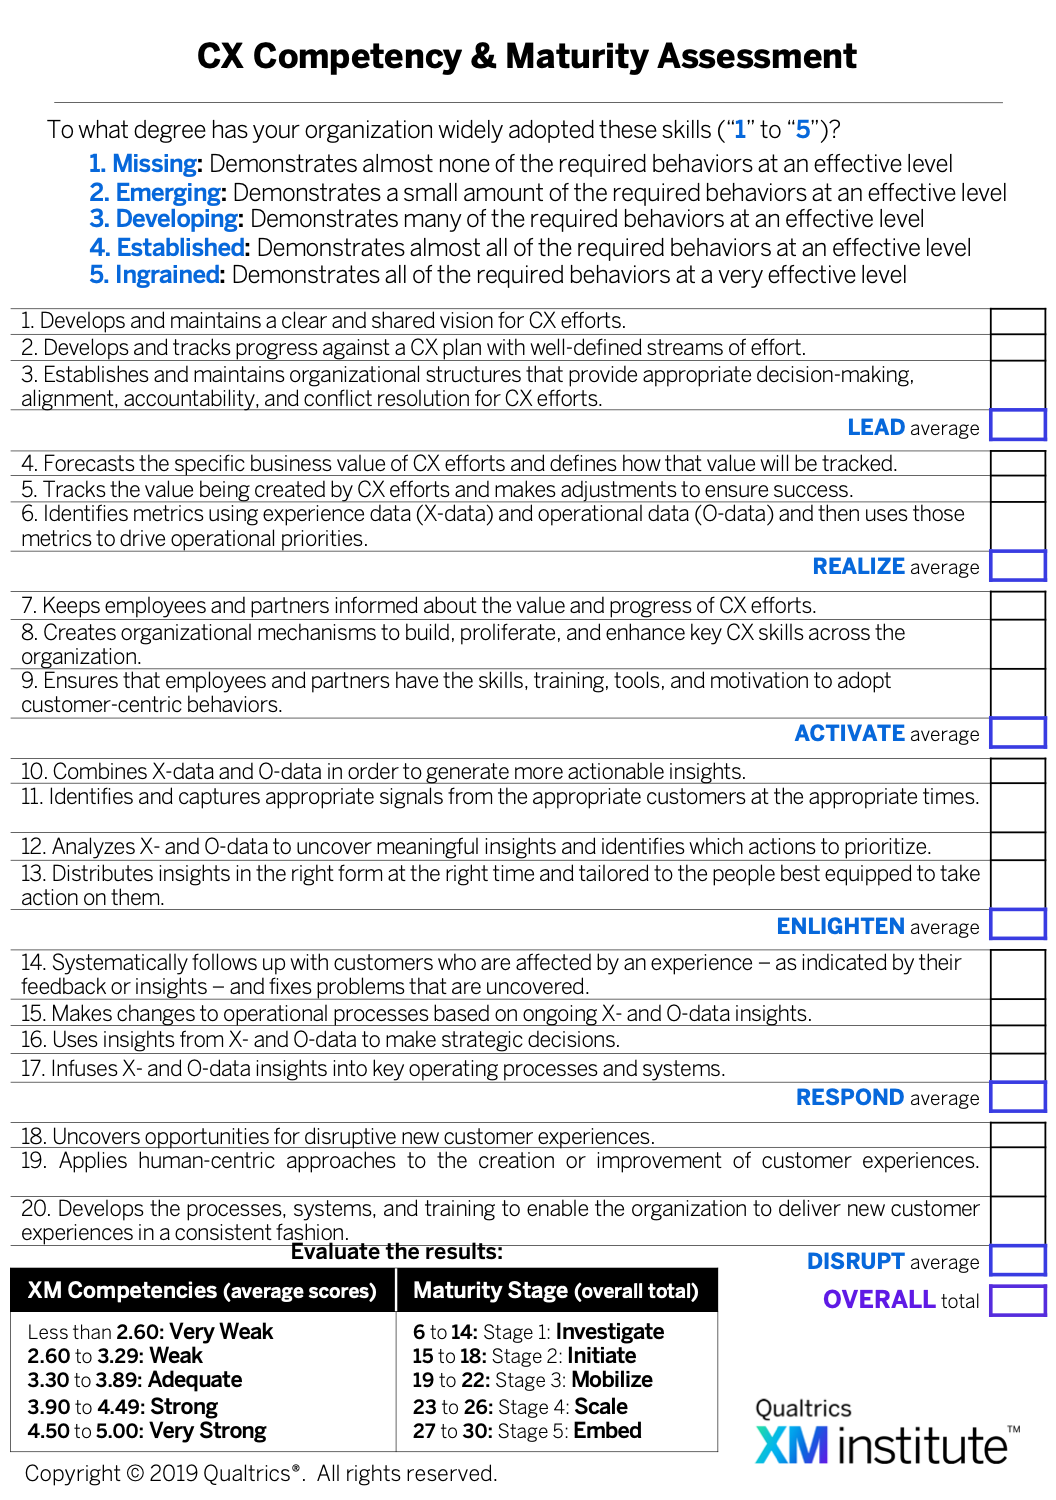 . The results show:
- Few companies have mature CX programs. Only 6% of respondents have made it into Scale or Embed, the top two stages of CX maturity
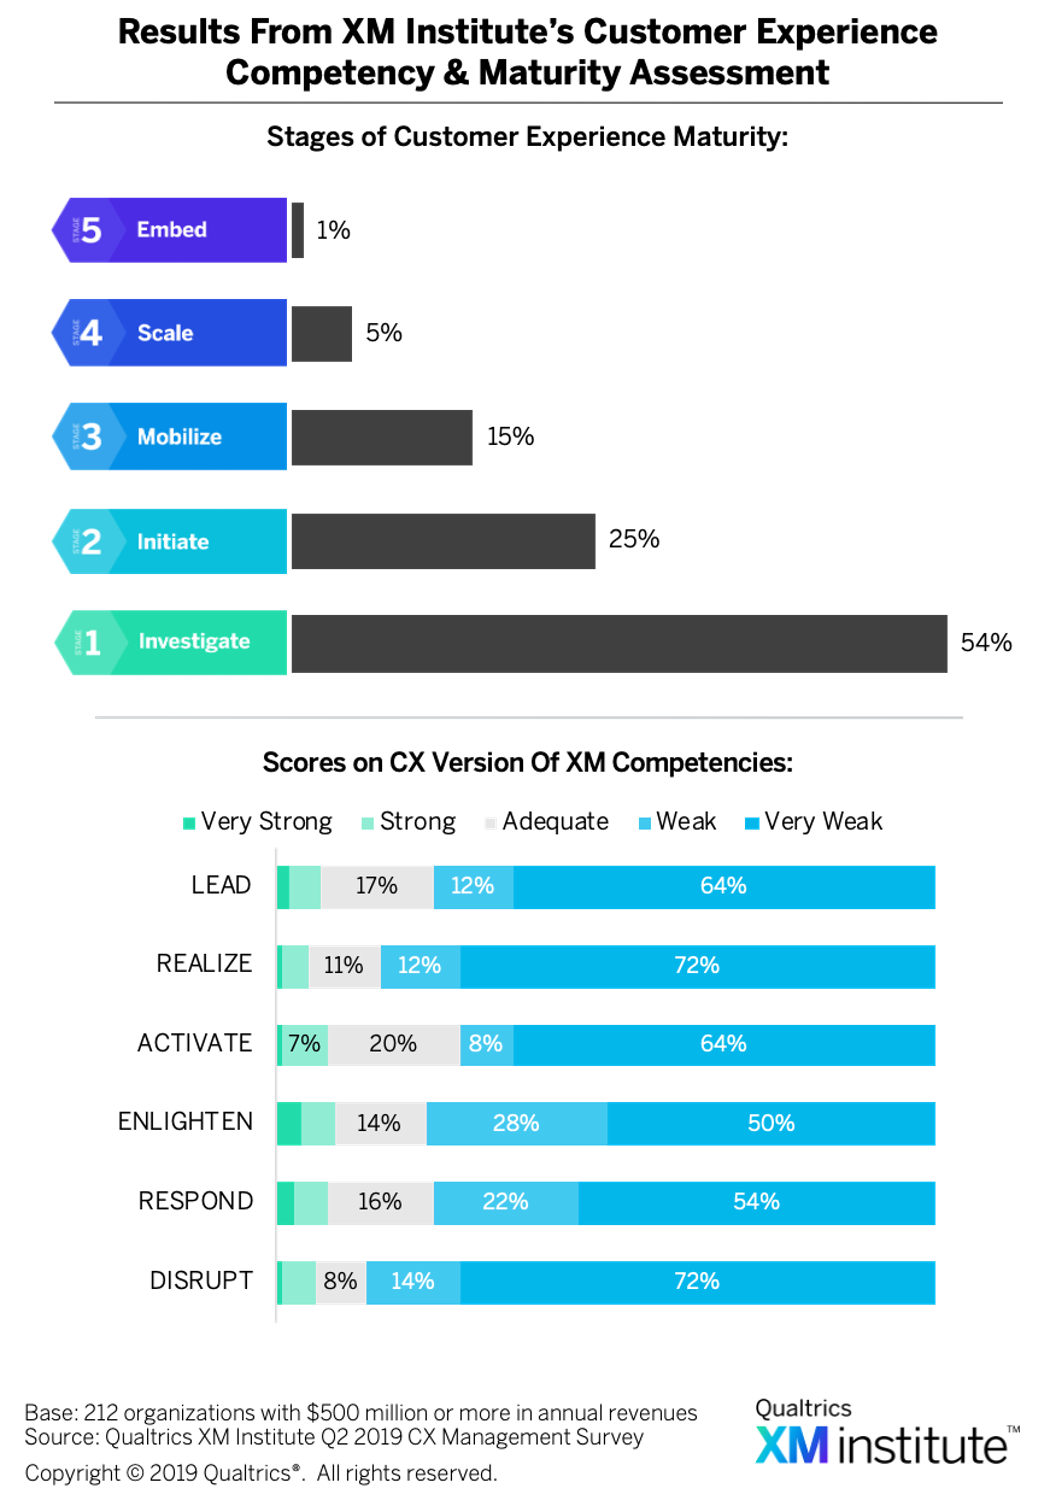 . And while companies have a lot of work to do in CX across all six XM Competencies, they received the lowest ratings in DISRUPT.
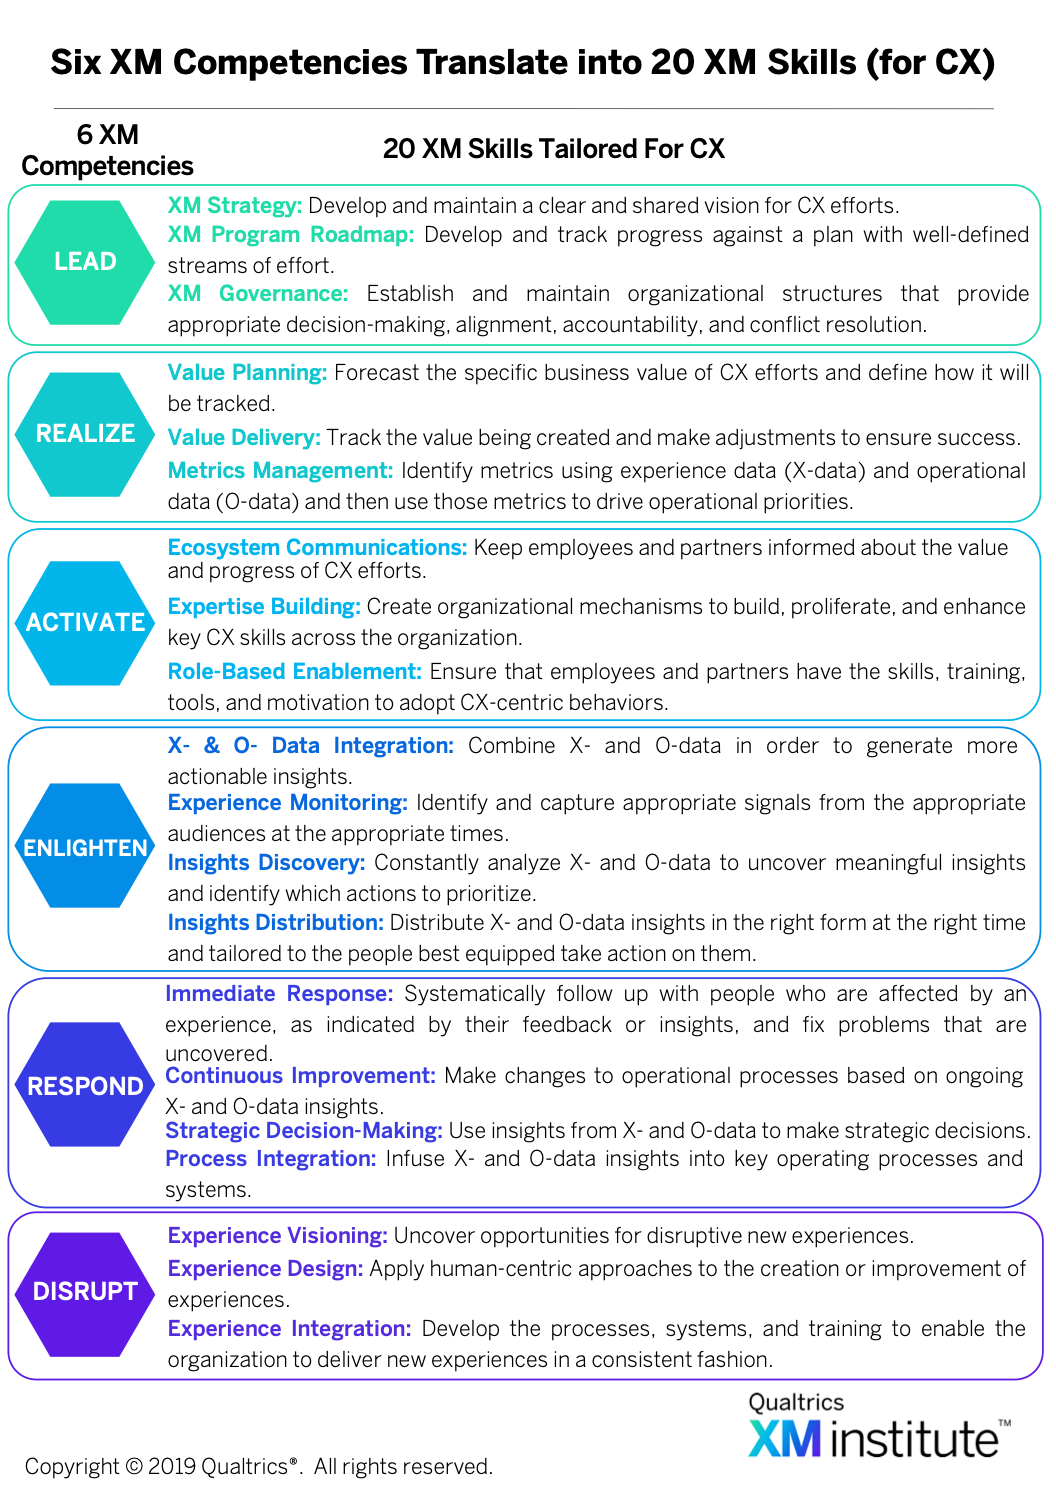
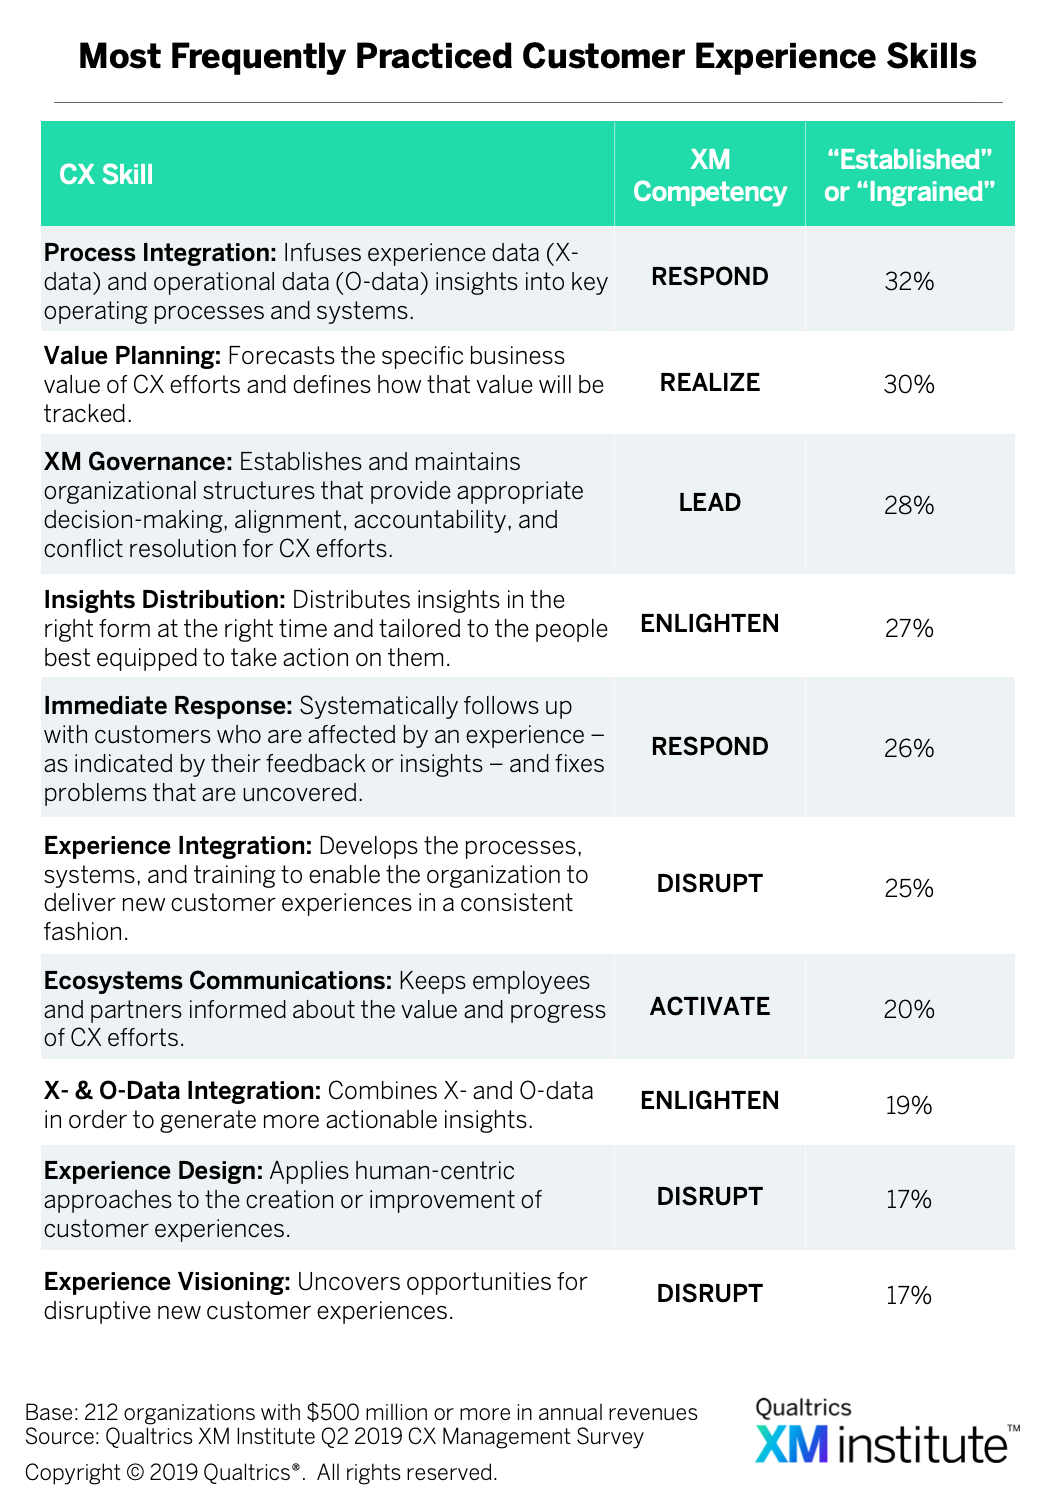
 - Companies are infusing CX insights into their processes and systems. To identify where companies’ CX efforts excel (and where they fall down), we examined their responses to questions about the 20 CX skills. The most commonly practiced Skill – with 32% of companies saying they do it consistently at an effective level – is Process Integration, which is about infusing CX and operational insights into key operating processes and systems
 . The least developed Skills – with only 8% of companies saying they do them consistently at an effective level – are Metrics Management, which is about identifying metrics and using them to drive priorities, and Strategic Decision-Making, which is about using CX insights to make important, strategic decisions
 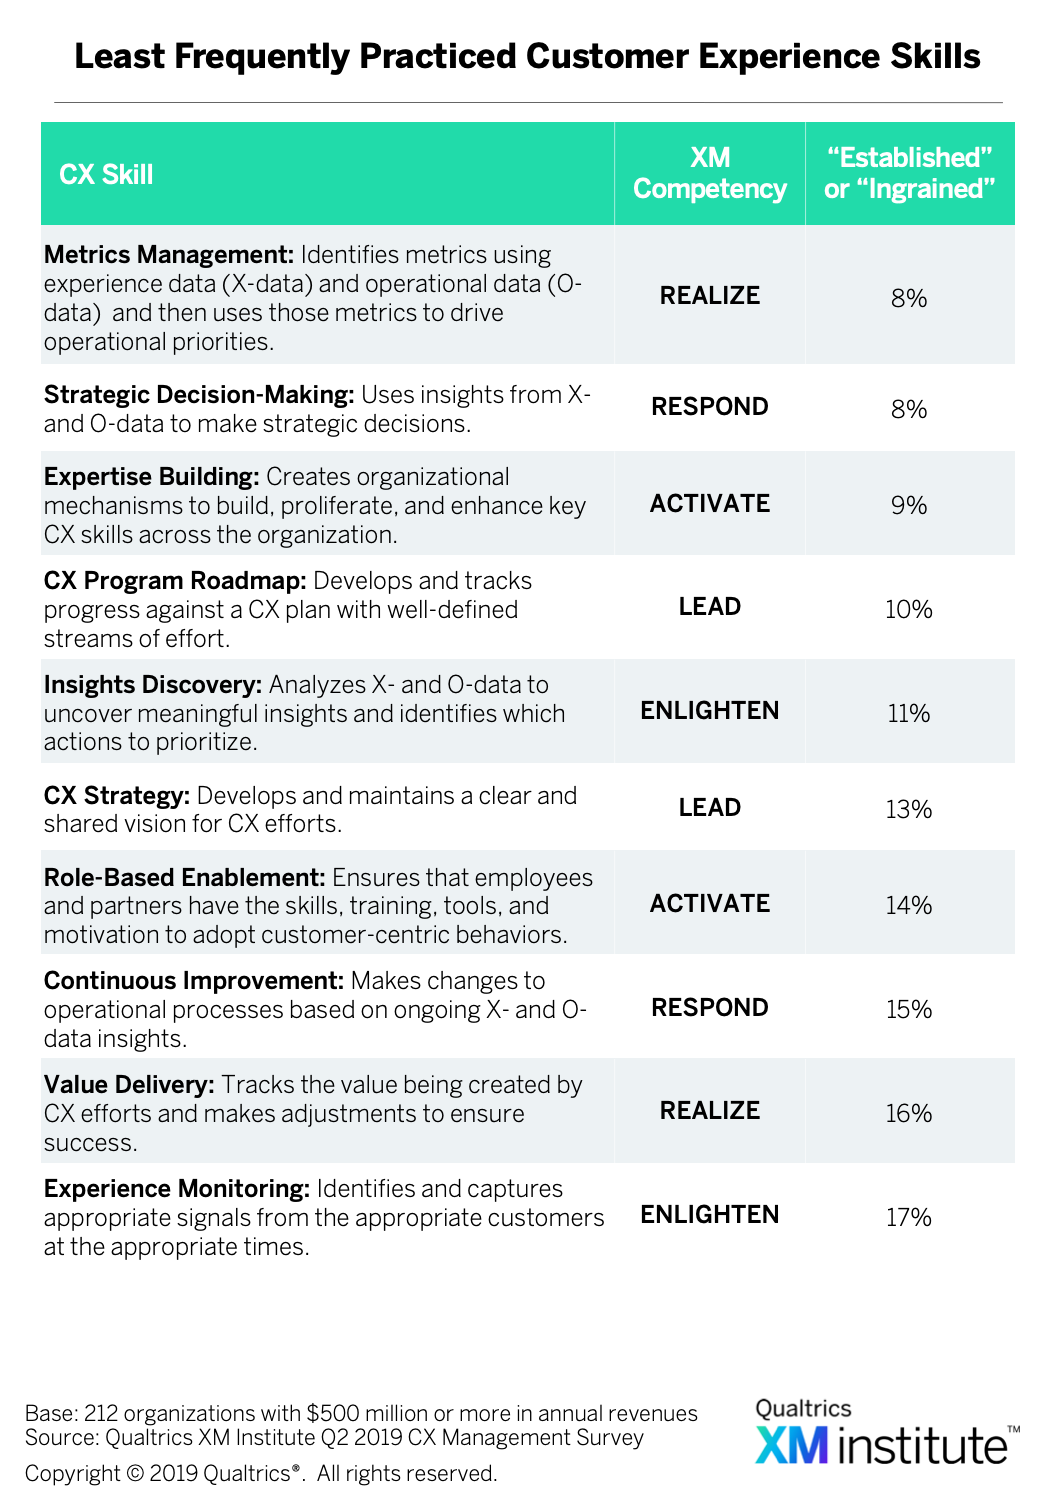 .
.
Comparing CX Leaders and Laggards
How do CX leaders differ from their less mature peers? To analyze this question, we split the respondents into two groups based on their CX Competency & Maturity Assessment scores. We labeled companies with scores of 48 and above “CX leaders” and companies with scores below 48 “CX laggards.” When we compared the results of these two groups, we found that CX leaders:
- Enjoy stronger financial results. Seventy-one percent of CX leaders report that their CX efforts had a positive impact on their financial performance over the previous year, while only 38% of CX laggards report the same
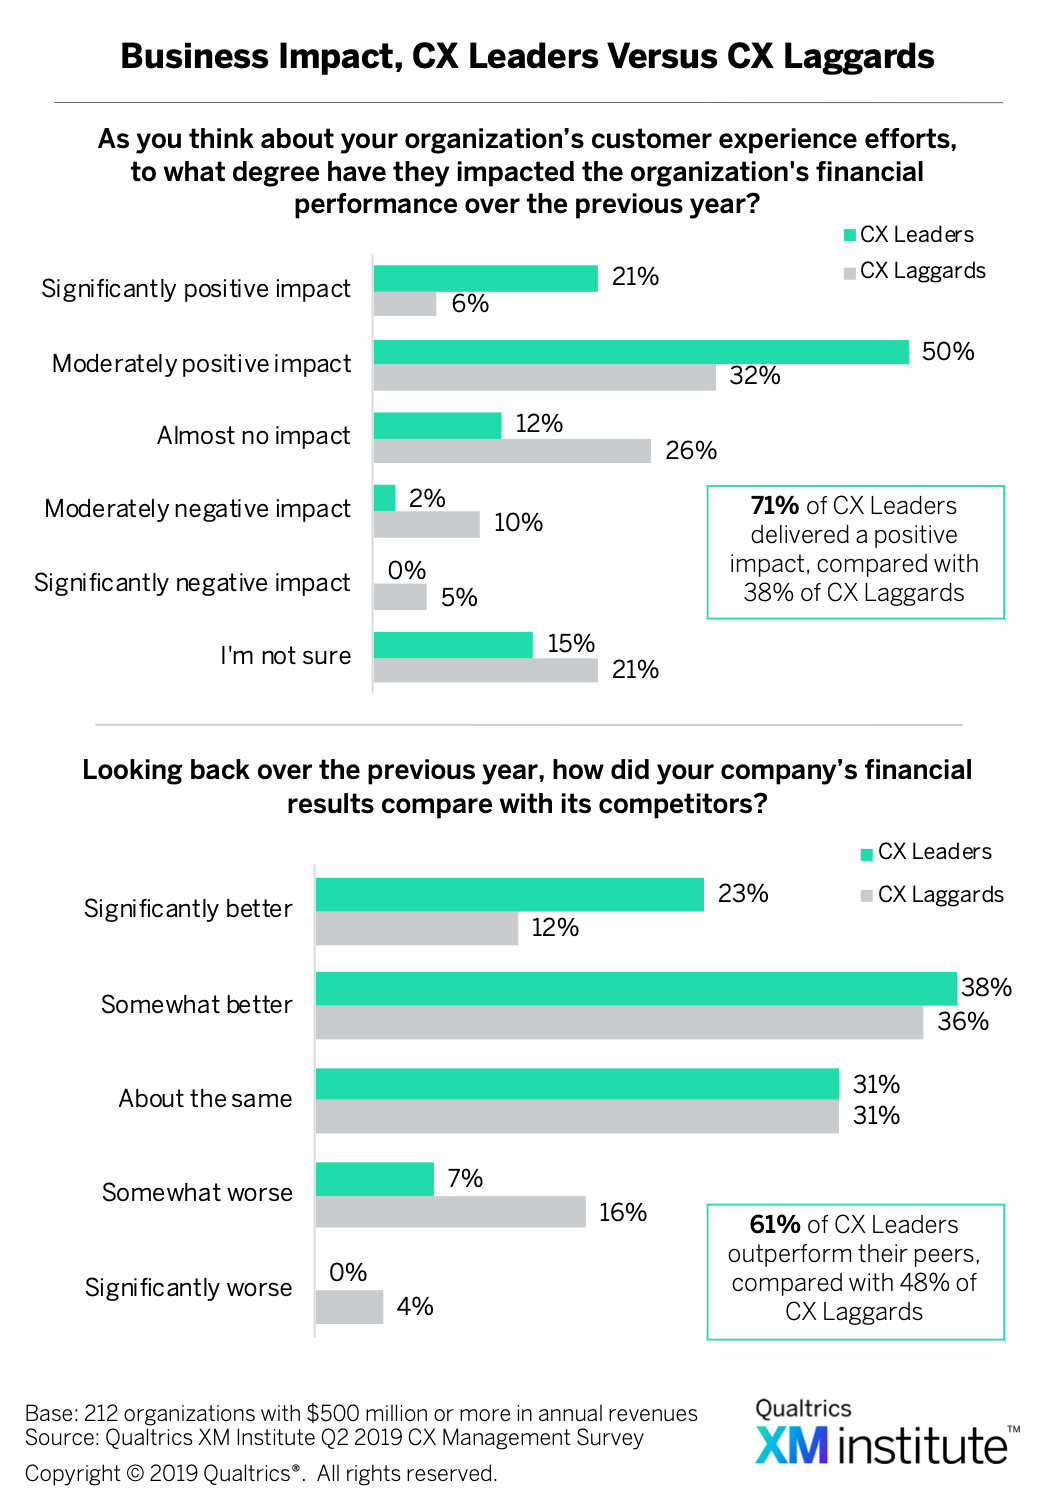 . In addition to seeing more value from their CX efforts, CX leaders also tend to outperform their peers financially, with 61% saying they have better financial results than their competitors, compared to only 48% of CX laggards.
 - Have more senior executive support. Fifty-seven percent of CX leaders consider their most senior leader, such as their CEO, to be a “strong” or “very strong” champion of CX, compared with only 38% of CX laggards
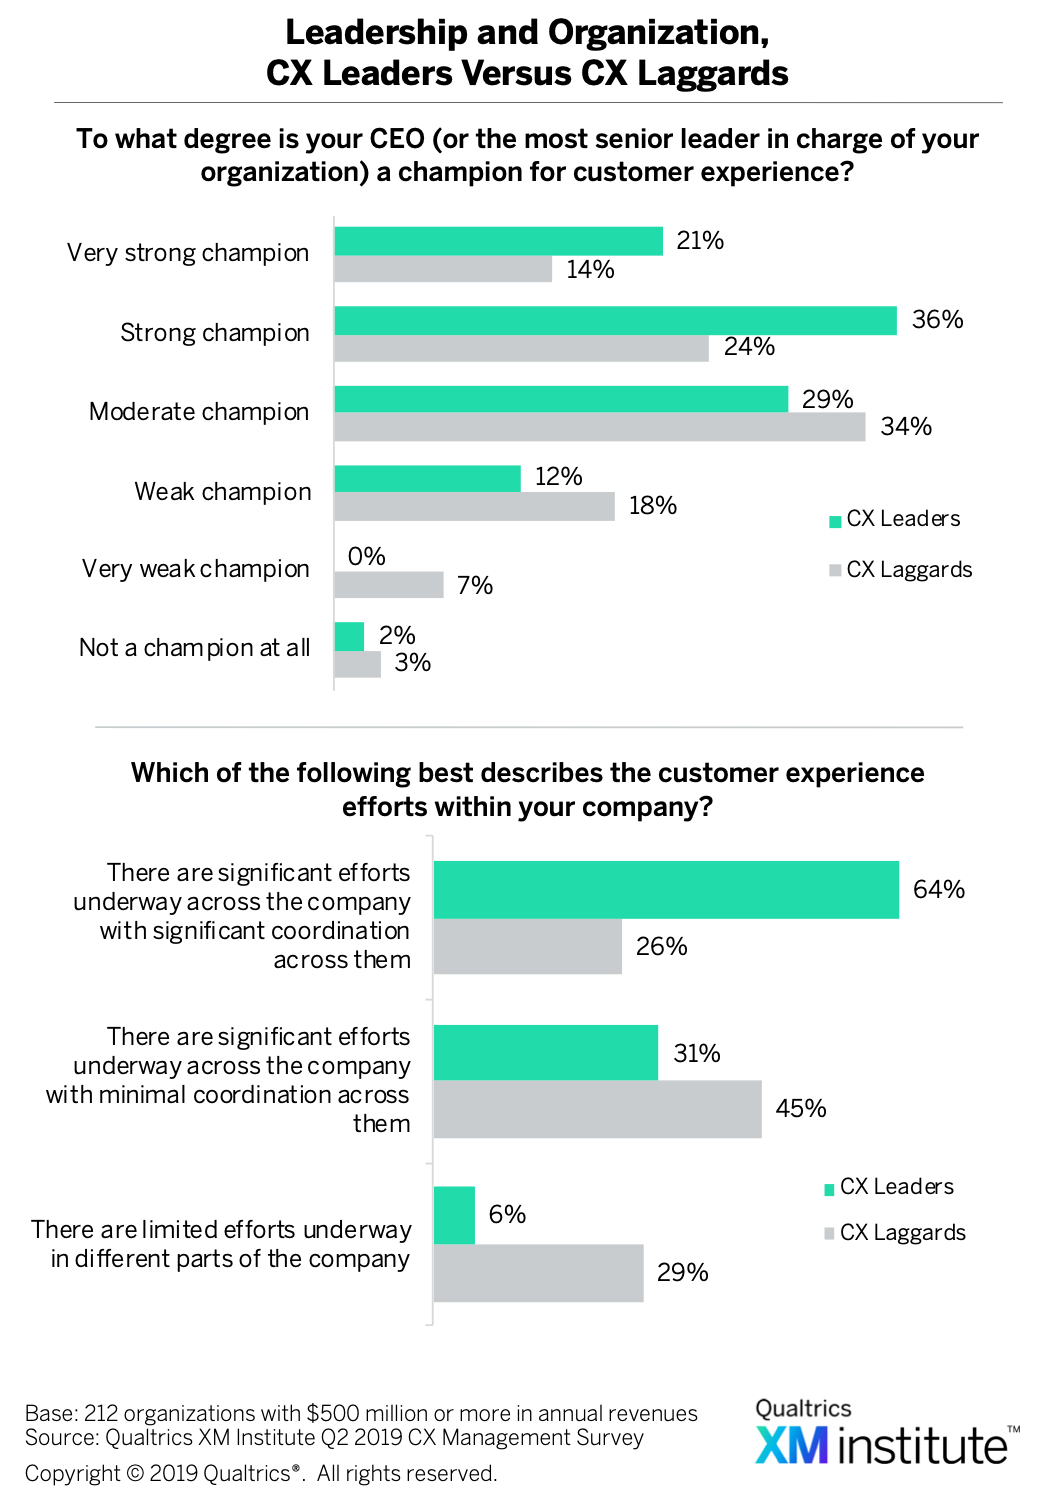 . In addition, 28% of CX laggards describe their senior executive as either a “weak” champion, a “very weak” champion, or “not a champion at all,” which is twice the percentage found in CX leaders.
 - Have more coordinated CX programs. Sixty–four percent of CX leaders report having significant CX efforts underway across the company with significant coordination across these efforts, compared to only 26% of CX laggards.
- Are focused across multiple core experiences. Sixty-five percent of CX leaders consider it “very important” or “critical” to improve employee experience while they are improving CX, compared to only 48% of CX laggards
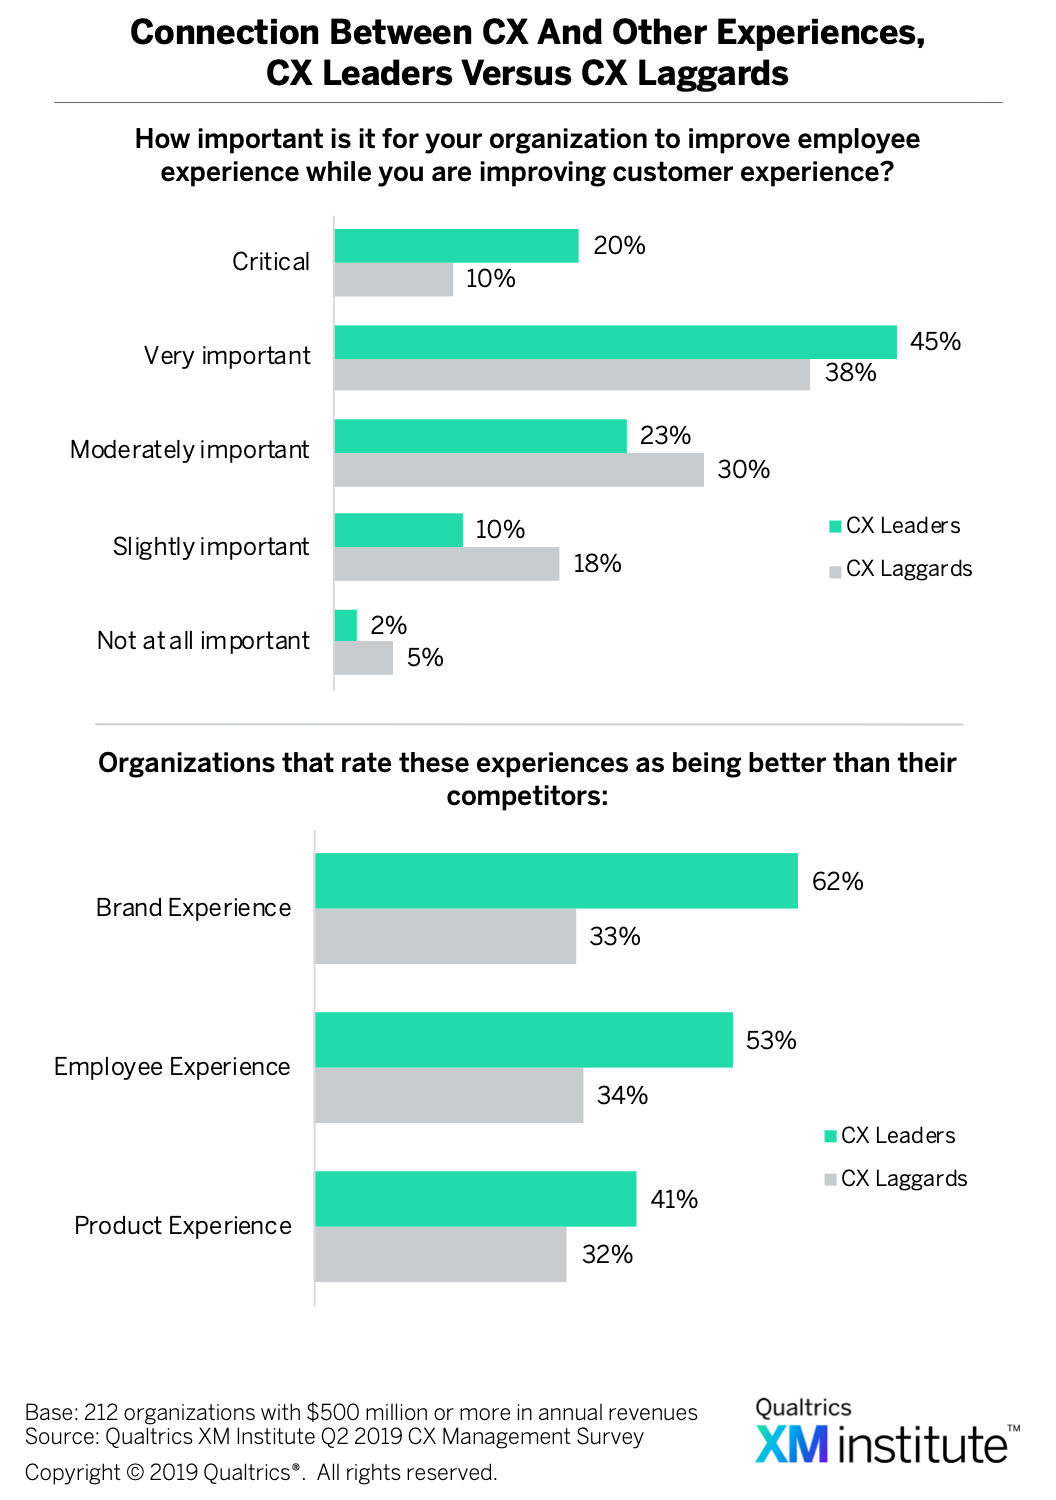 . CX leaders also reported having better competitive positioning for their brand, employee, and product experiences.
 - Foster a more empathetic culture. When we asked respondents how effectively their company demonstrates certain cultural attributes, CX leaders were more likely to “mostly agree” or “completely agree” with every statement on our list
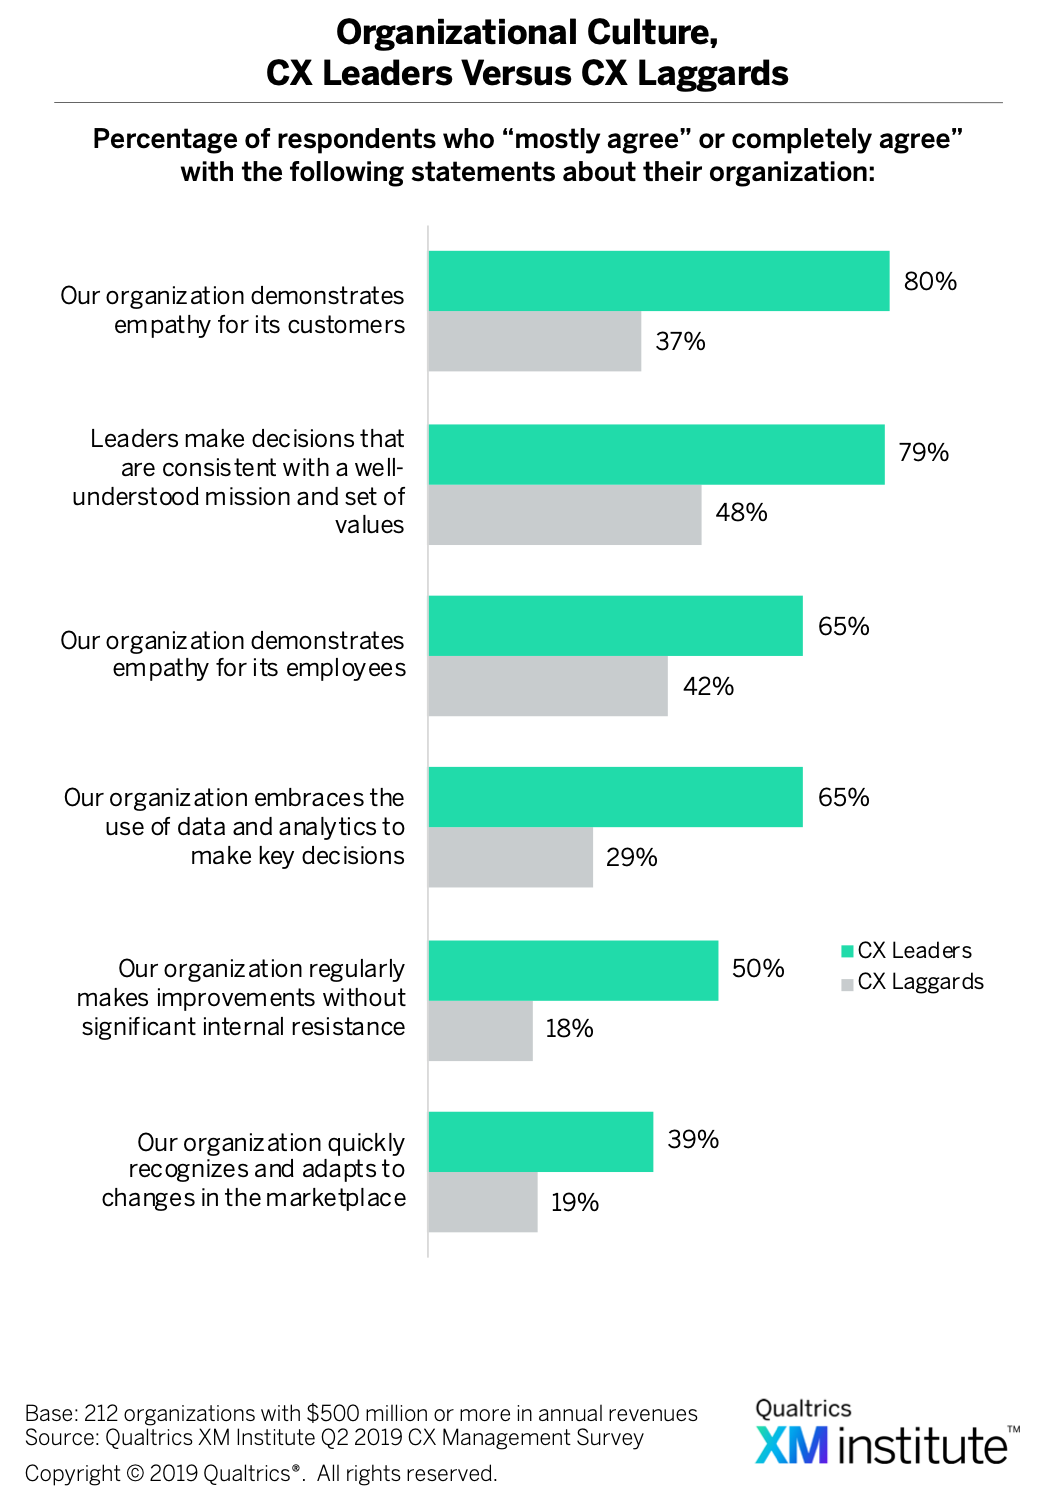 . The two groups differ the most when it comes to the statement our organization demonstrates empathy for its customers, with 80% of CX leaders agreeing compared to only 37% of CX laggards.
 - Deliver better experiences across all channels. CX leaders report delivering a higher percentage of “good” and “very good” experiences across every interaction channel we surveyed
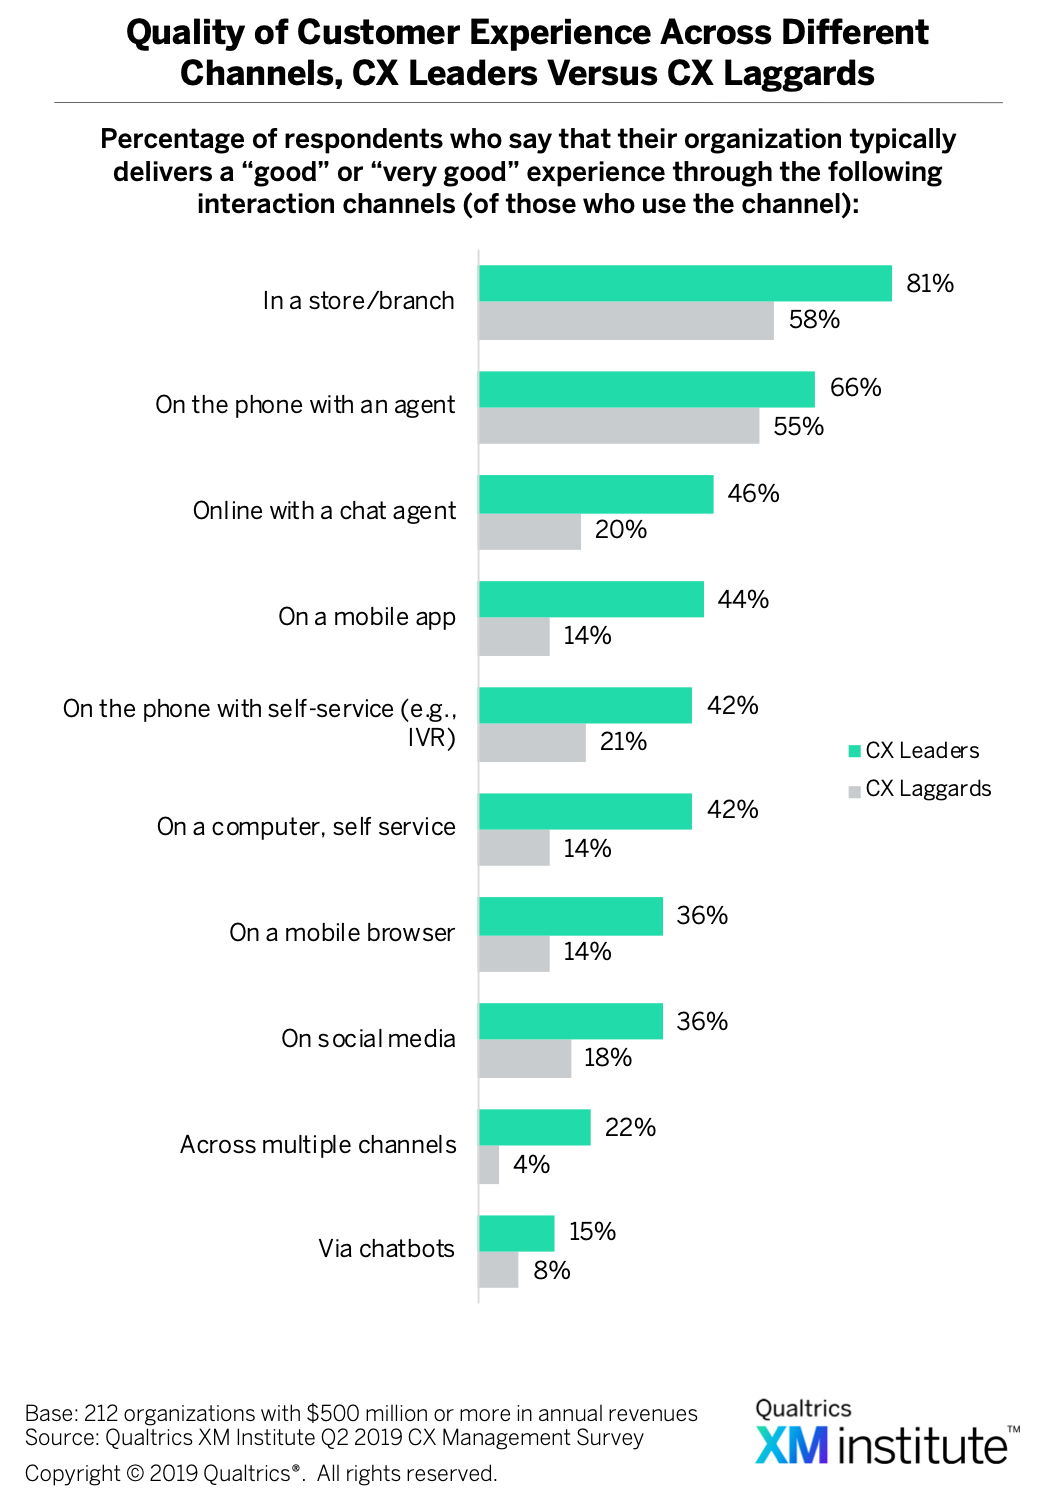 . Leaders and laggards diverge most when it comes to the experience they deliver in mobile apps, online self-service, and online chats.
 - Have stronger leadership and clearer CX strategy. When asked about significant obstacles hampering their CX efforts, CX leaders and CX laggards equally cited struggling with other competing priorities
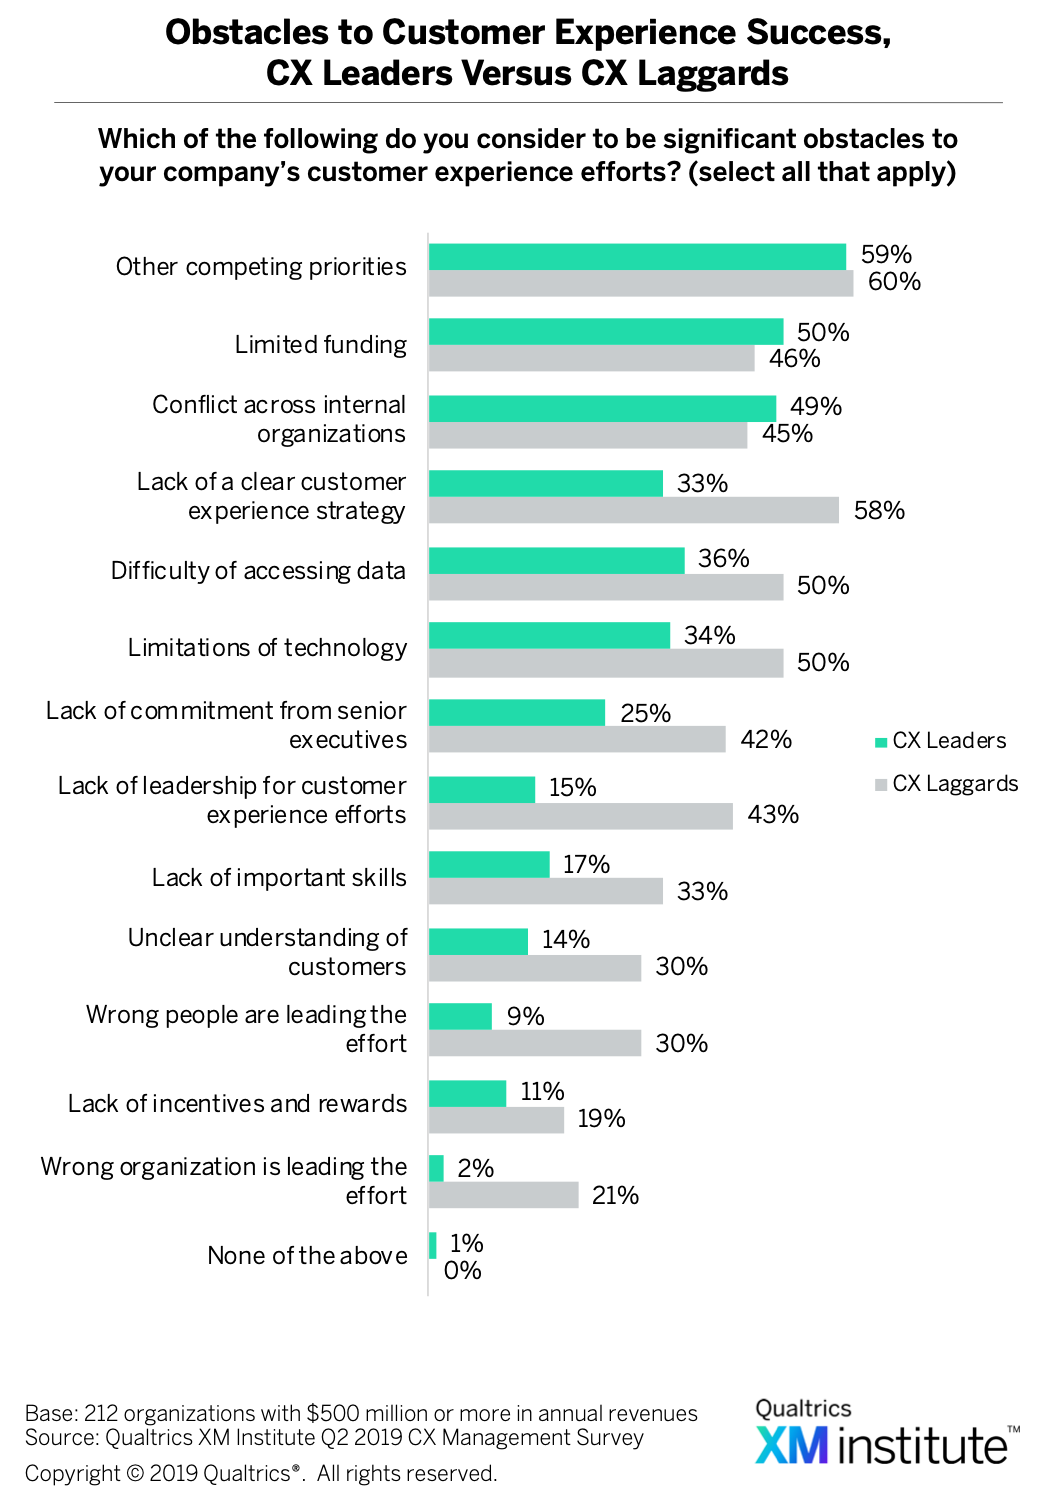 . CX laggards, however, were more likely than CX leaders to select almost all of the other obstacles on our list. The two obstacles CX laggards were most likely to select compared to CX leaders are wrong people are leading the effort and lack of a clear CX strategy.
Assessing Your Customer Experience Competency
As some organizations focus on the six XM Competencies more than others, we expect to see the gap between CX leaders and CX laggards to continue to grow. To help gauge your organization’s progress on the CX component of its experience management journey, use the Qualtrics XM Institute’s CX Competency & Maturity Assessment. You can use this tool in a number of ways:
- Self-assessments. Take the test yourself and identify the strengths and weaknesses of your organization.
- Group discussions. Have multiple people complete the self-assessment and discuss the results as a group. Talk about the strengths and weaknesses identified as well as the areas of agreement and disagreement in the results.
- Benchmarking. Compare your results to the Qualtrics XM Institute’s data about how other companies perform. We’ve provided a chart you can use to identify how your score compares to the scores of 212 large companies
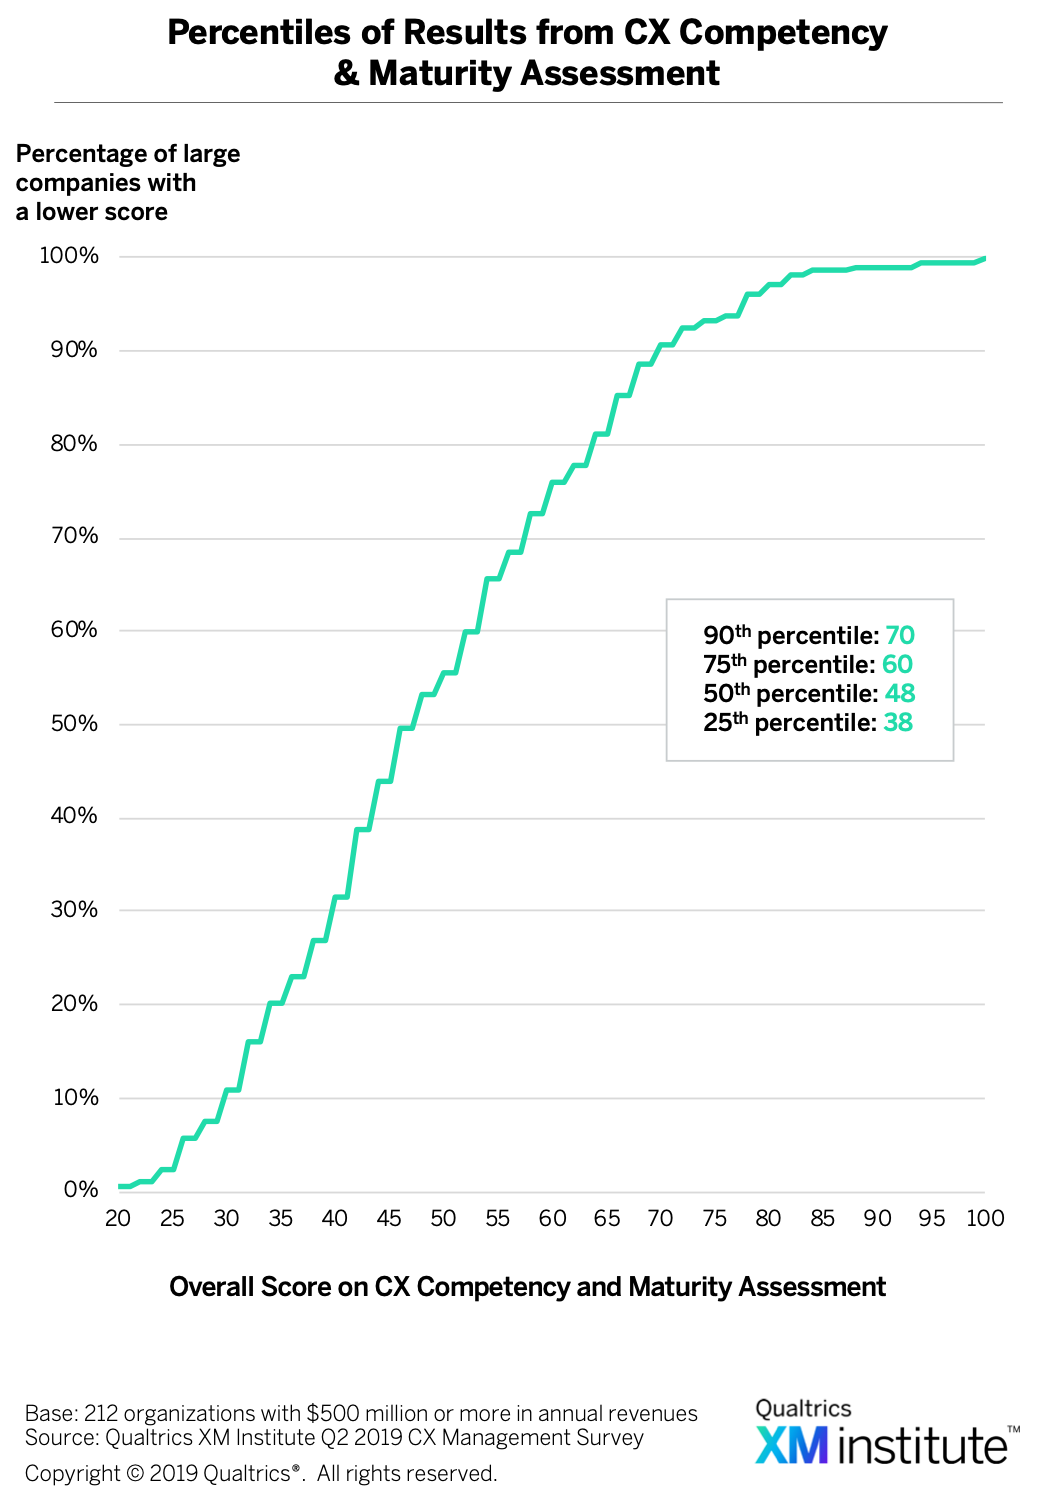 .
. - Action planning. Develop plans for making progress towards mastering CX.
- Progress tracking. Repeat the self-test every six to twelve months to track your progress and identify your key areas of focus. The goal is to drive an ongoing discussion and continue prioritizing CX efforts.
- The 2019 XMI Customer Benchmark is based on a survey of 10,000 U.S. consumers and evaluates almost 300 companies across 20 industries.
- The Qualtrics XM Institute conducted this survey in June 2019. The data was cleansed to eliminate partial, duplicate, and questionable responses. This report analyzes 212 responses from companies with annual revenues of at least $500 million. These respondents come from a global set of companies.
- See the XM Institute report, “Operationalizing XM,” (July 2019).


