The Connection Between Customer Experience and Loyalty
A recent XM Institute study found that 81% of large companies plan to increase their focus on customer experience (CX) in the upcoming year.1 Why are so many companies aiming to boost their ability to deliver a first-class customer experience? Beyond simply being a “good” thing to provide, many executives emphasize the importance of delivering excellent CX because they know there is a clear link between CX and loyalty. To determine exactly how customer experience affects loyalty, we asked 10,000 U.S. consumers about both their experiences with and their loyalty to 294 U.S. companies across 20 industries, and then we analyzed their responses.2 The results show improved CX correlates to:
- Increased purchases. We looked at how likely consumers are to purchase more products or services from each of the 294 U.S. companies evaluated and then compared these numbers to each firm’s Customer Ratings Score. We found a significant correlation between likelihood to purchase more and Customer Ratings Score. The correlation coefficient is .87
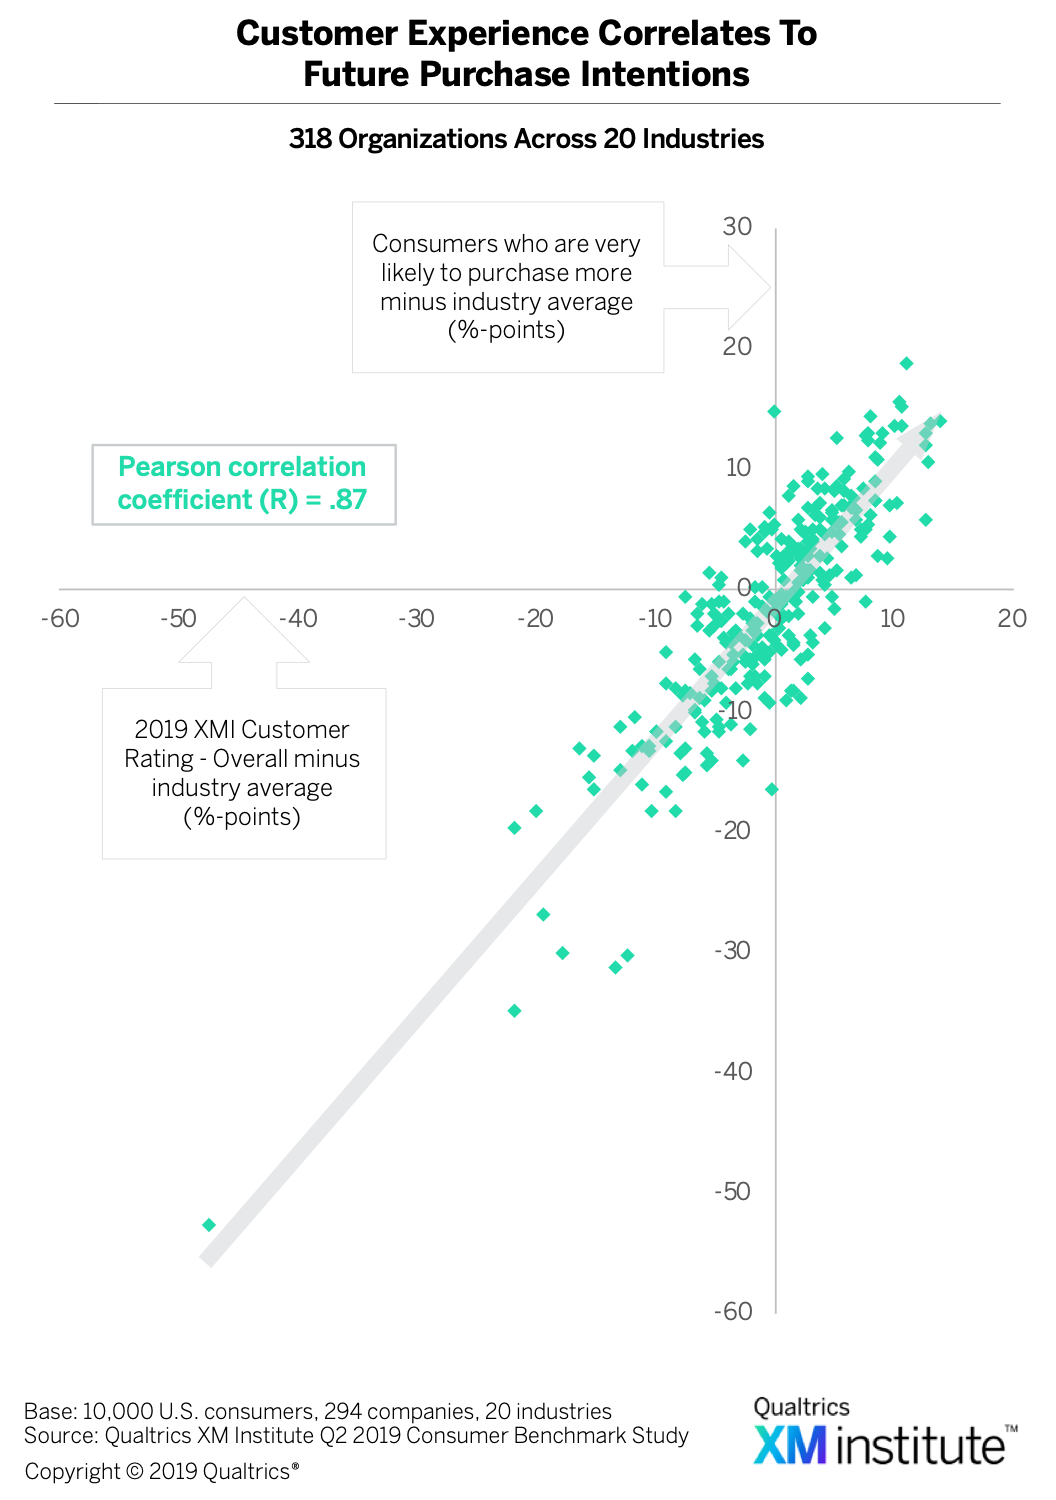 , which indicates a strong, positive relationship between these two variables.3
 - More recommendations. We also found that there is a strong, positive relationship between CX and Net Promoter Score (NPS®) with a correlation coefficient of .82
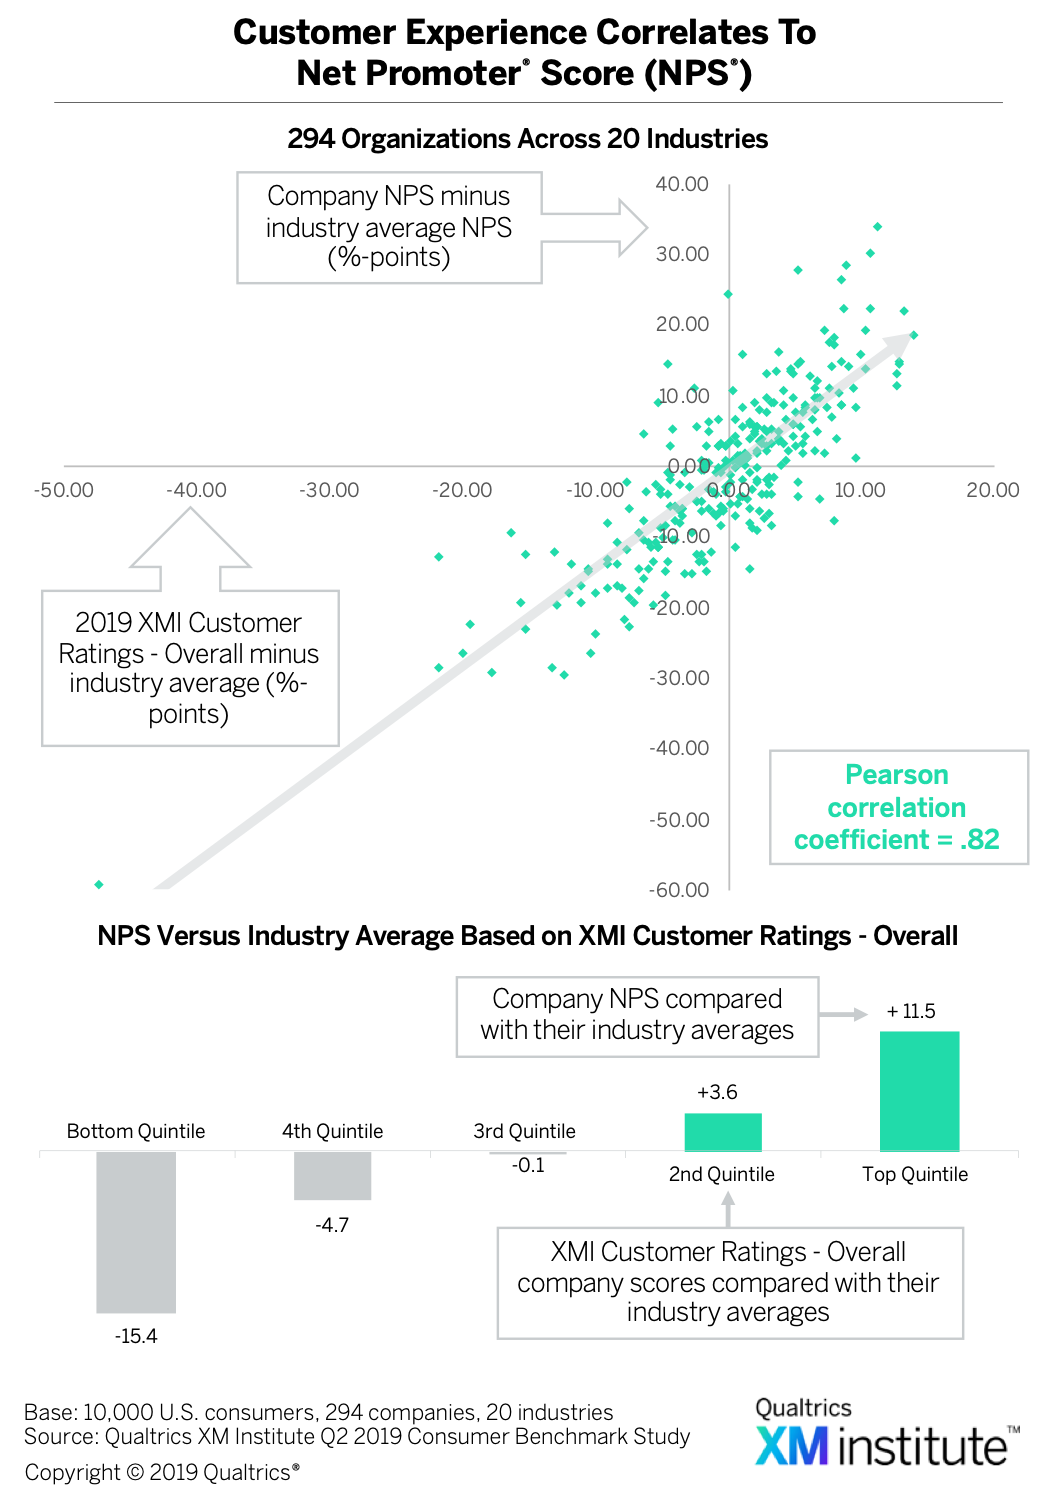 .4 The average NPS of companies in the highest quintile of the Customer Ratings is 11.5 points above the industry average — more than 26 points higher than the average NPS of companies in the bottom quintile.
Loyalty and the Three Elements of Customer Experience
In addition to comparing overall customer experience to different loyalty behaviors, we also examined how each of the three elements of customer experience — success, effort, and emotion — affects each of the five loyalty behaviors 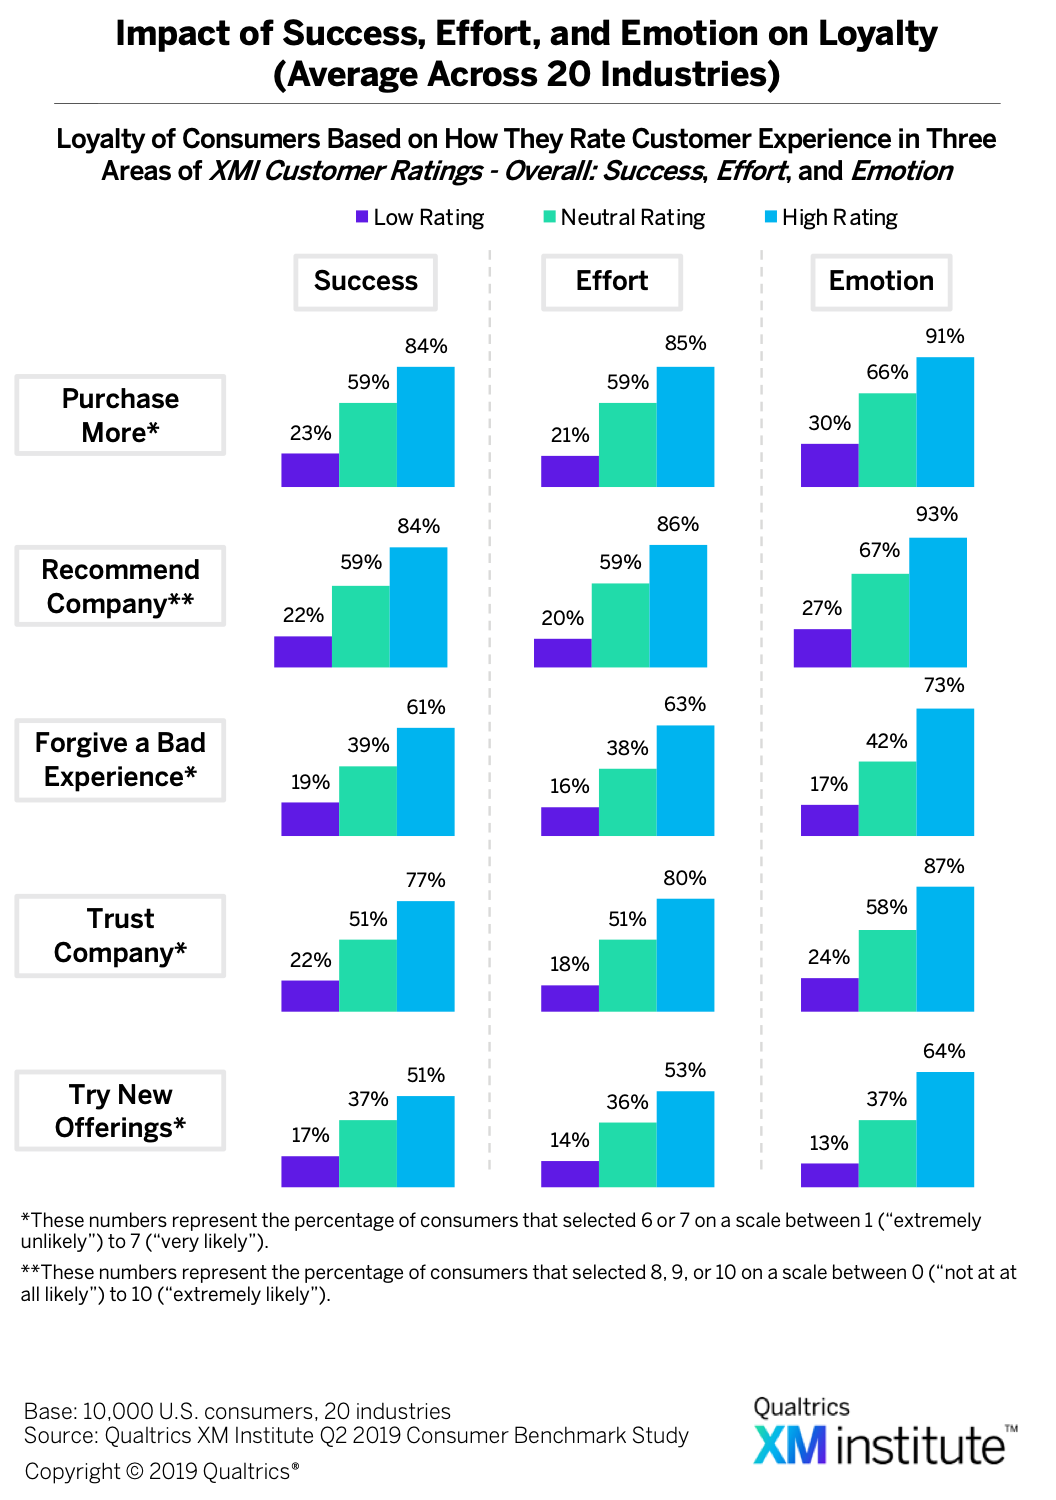 . This analysis looks at consumer attitudes across all companies and industries and is based on whether consumers gave organizations a low, medium, or high customer experience rating. When we looked at the interaction between the three elements of customer experience and the loyalty metrics, we found that:
- Emotion has the biggest impact. While an improvement in any one of the three components of customer experience increases all areas of loyalty, an improvement in emotion provides the biggest benefit. Consumers with a high rating in emotion are more likely to exhibit one of the five loyalty metrics than consumers with a high rating in success or effort.
- Success best predicts purchasing and recommendation. The way consumers rate their customer experience can help predict which loyalty behaviors they might exhibit. The success component most strongly predicts a consumer’s likelihood to make additional purchases and likelihood to recommend the company — 84% of consumers who gave a high rating in success are likely both to recommend the company and purchase more from it in the future.
- Effort has the most variability. While the general trend that better CX ratings correspond to a higher likelihood of exhibiting loyalty behaviors holds, effort has the most variation in these effects.
CX and Loyalty Across 20 Industries
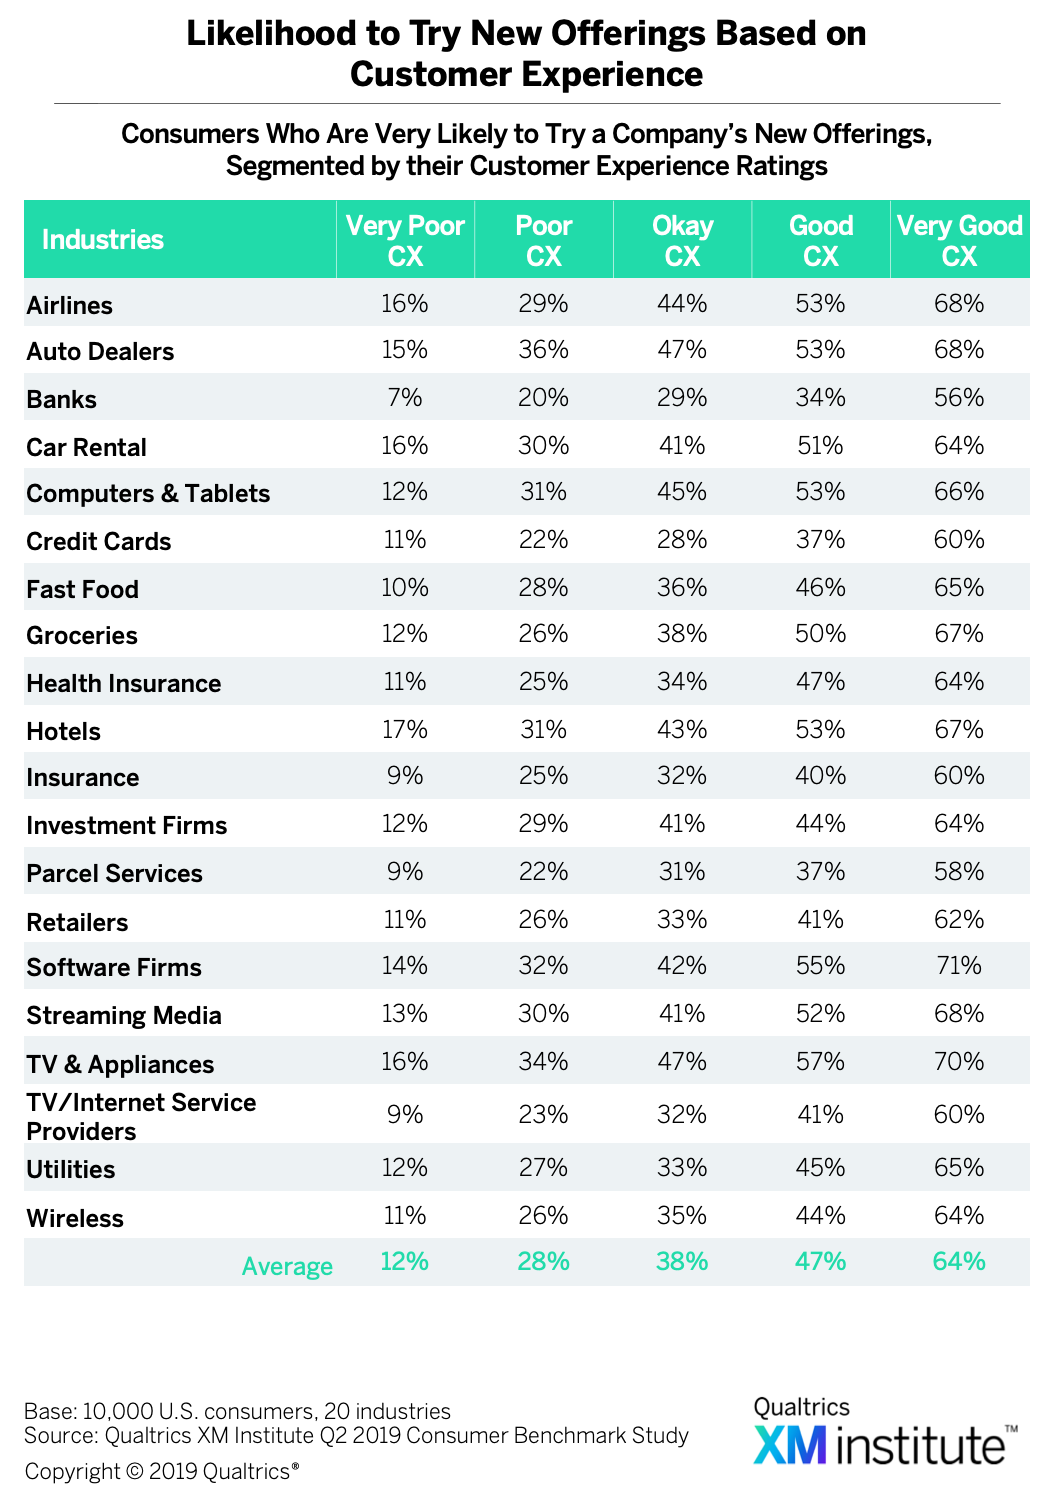
As part of our analysis, we examined consumer loyalty to companies across 20 industries based on how consumers rated their experiences with those companies 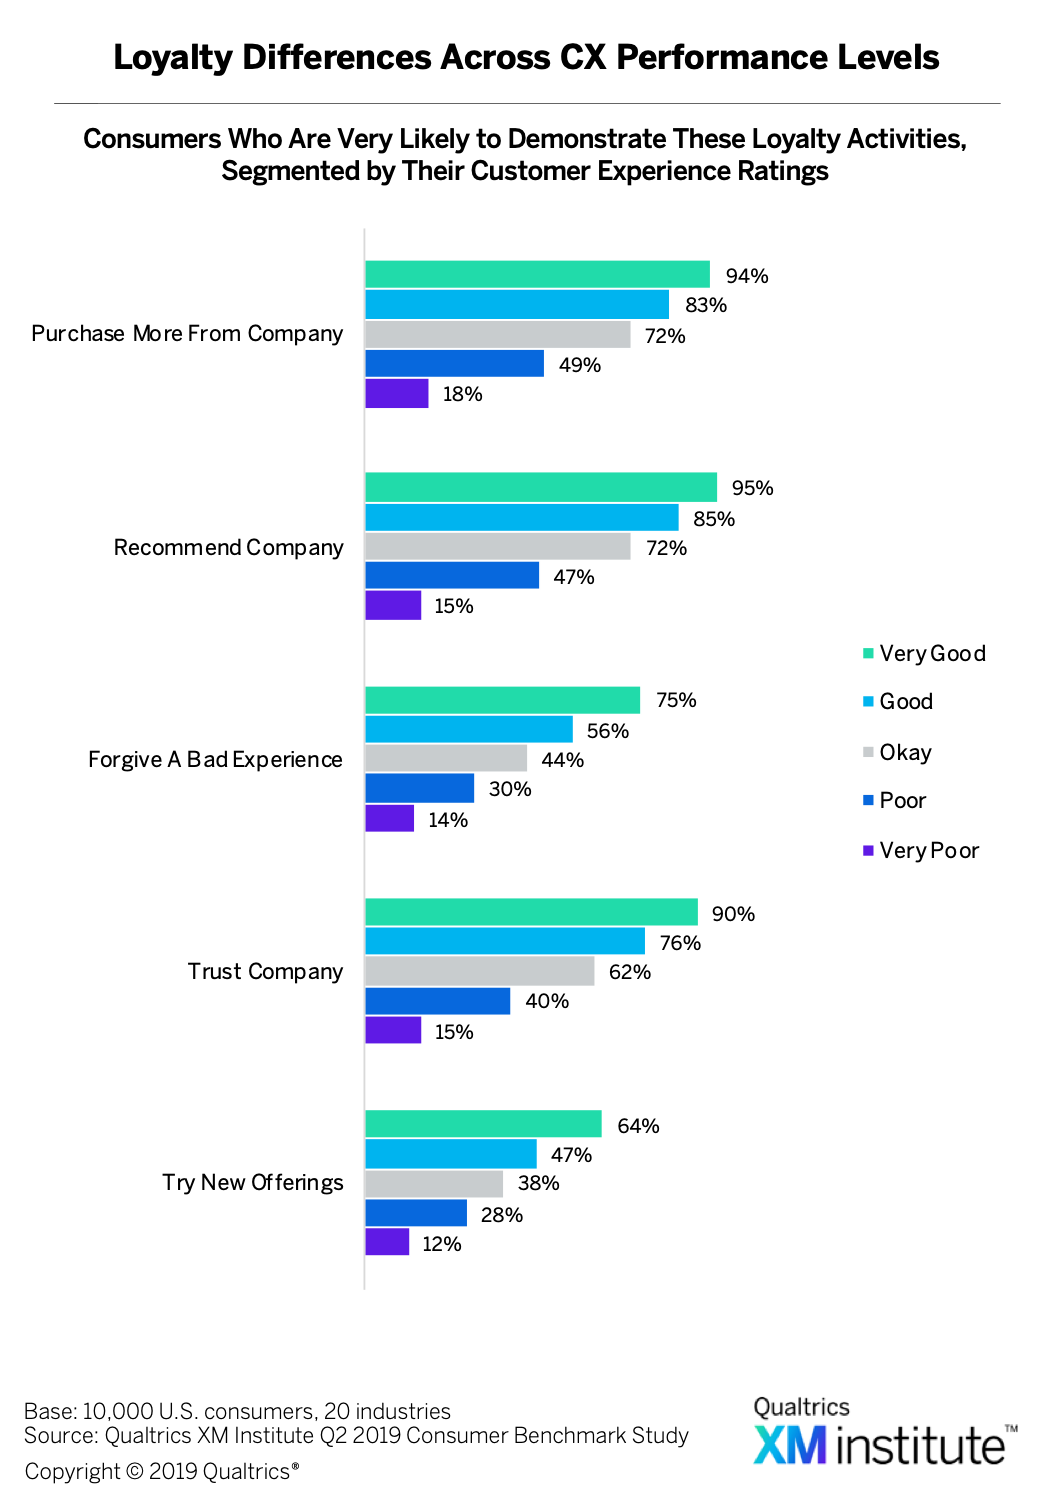 . When we looked at the averages across all of the industries, we discovered that CX influences how likely the customer is to:
- Purchase more from a company. Ninety-four percent of consumers who give a company a “very good” CX rating are “very likely” to purchase more products or services from that company in the future, while only 18% of those who gave a company a “very poor” CX rating say the same
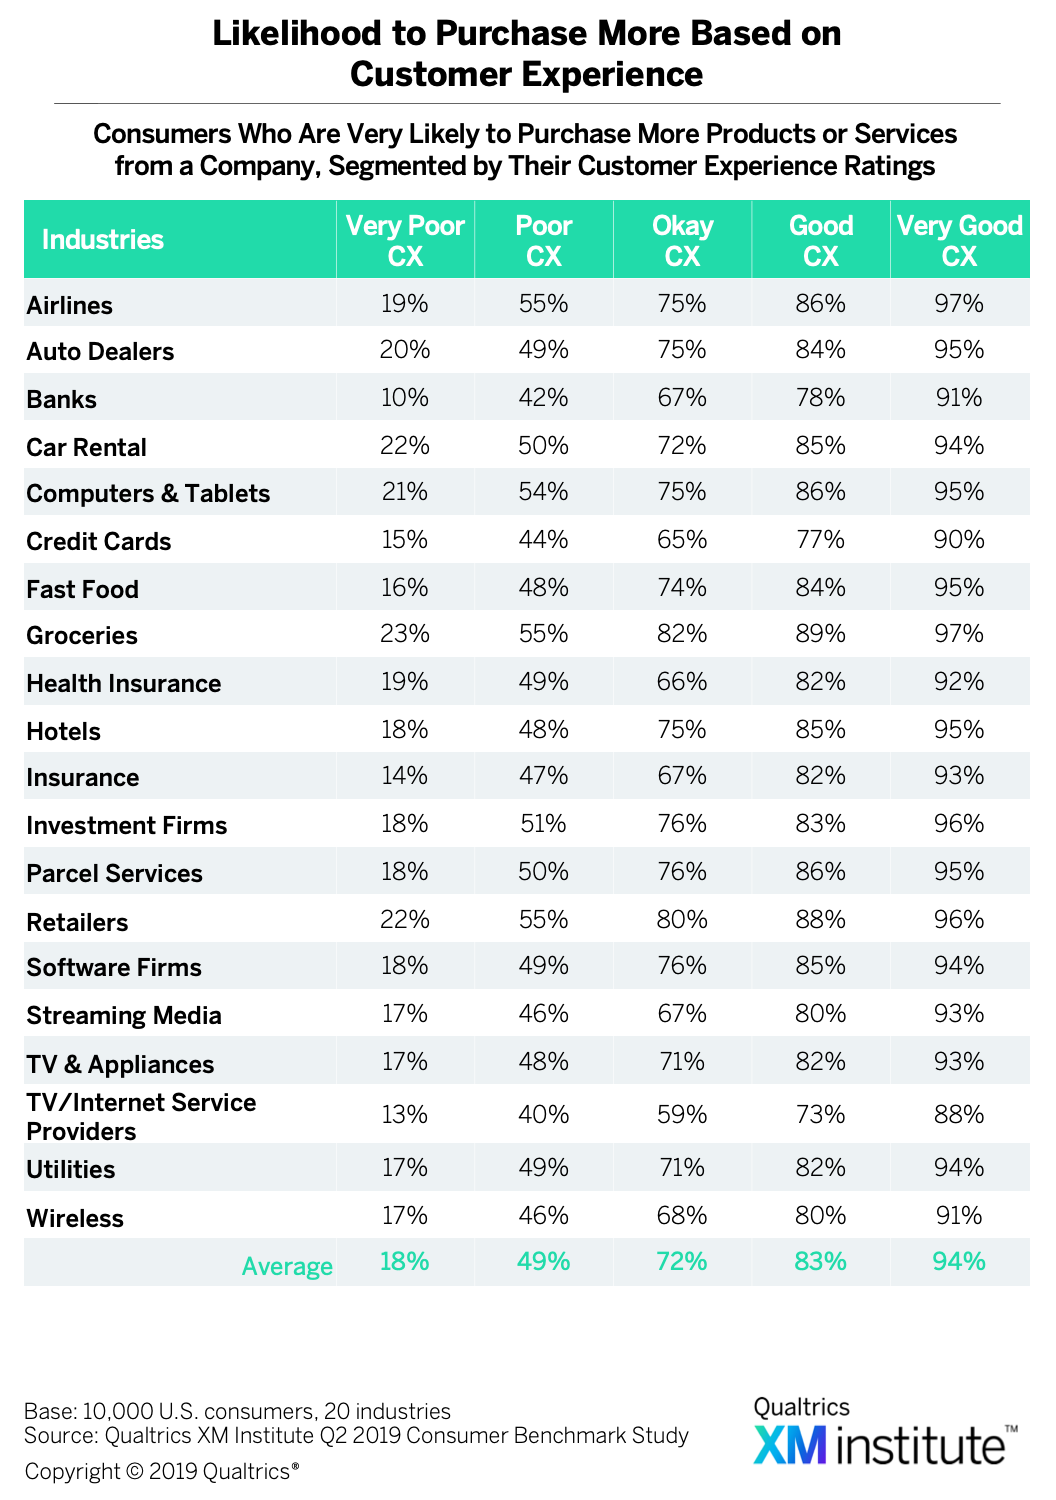 .
. - Recommend a company. Ninety-five percent of consumers who give a company a “very good” CX rating are “very likely” to recommend the company, while only 15% of those who gave a company a “very poor” CX rating say the same
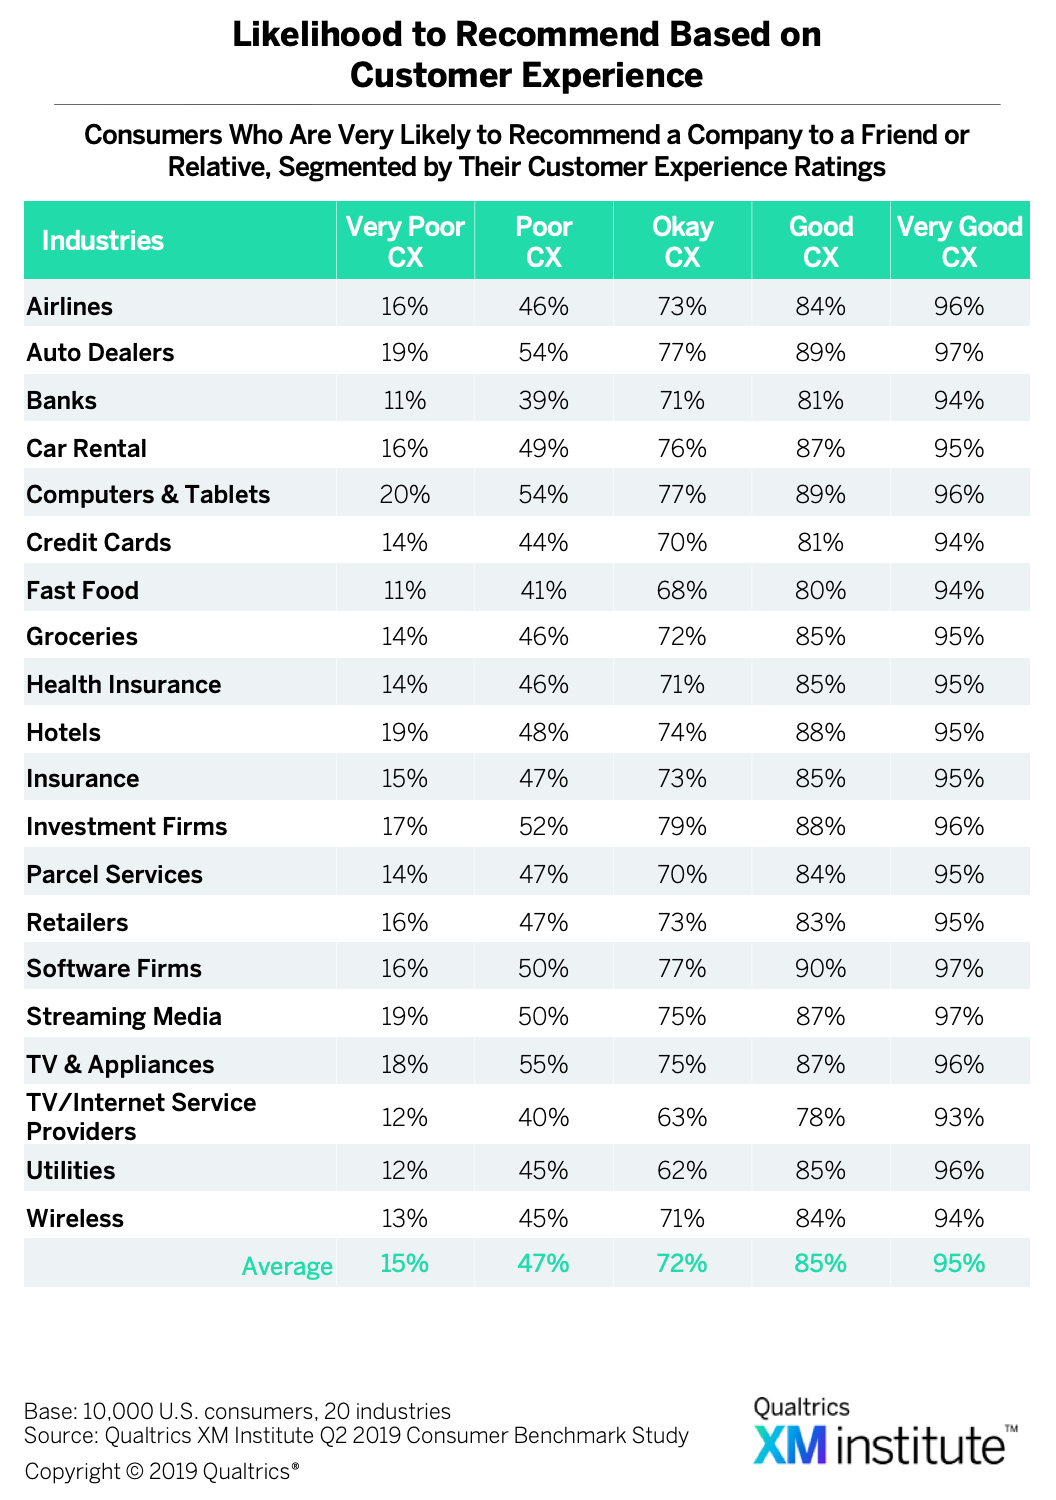 .
. - Forgive a company. Seventy-five percent of consumers who give a company a “very good” CX rating are “very likely” to forgive a company for a bad experience, while only 14% of those who gave a company a “very poor” CX rating say the same
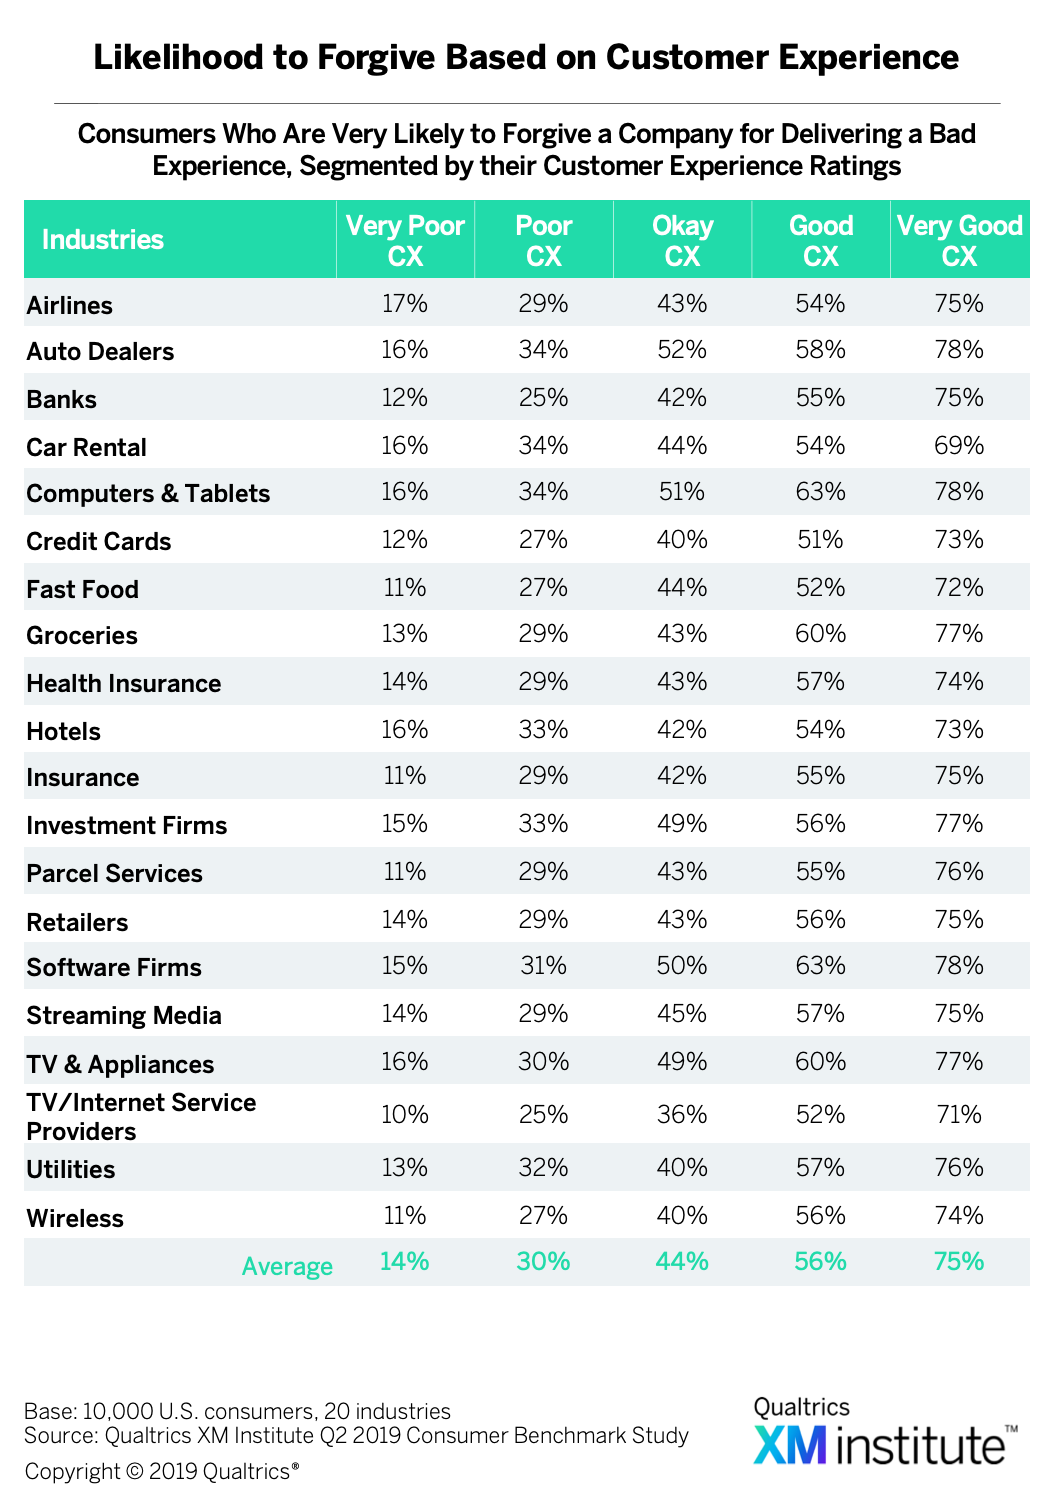 .
. - Trust a company. Ninety percent of consumers who give a company a “very good” CX rating are “very likely” to trust a company to take care of their needs, while only 15% of those who gave a company a “very poor” CX rating say the same
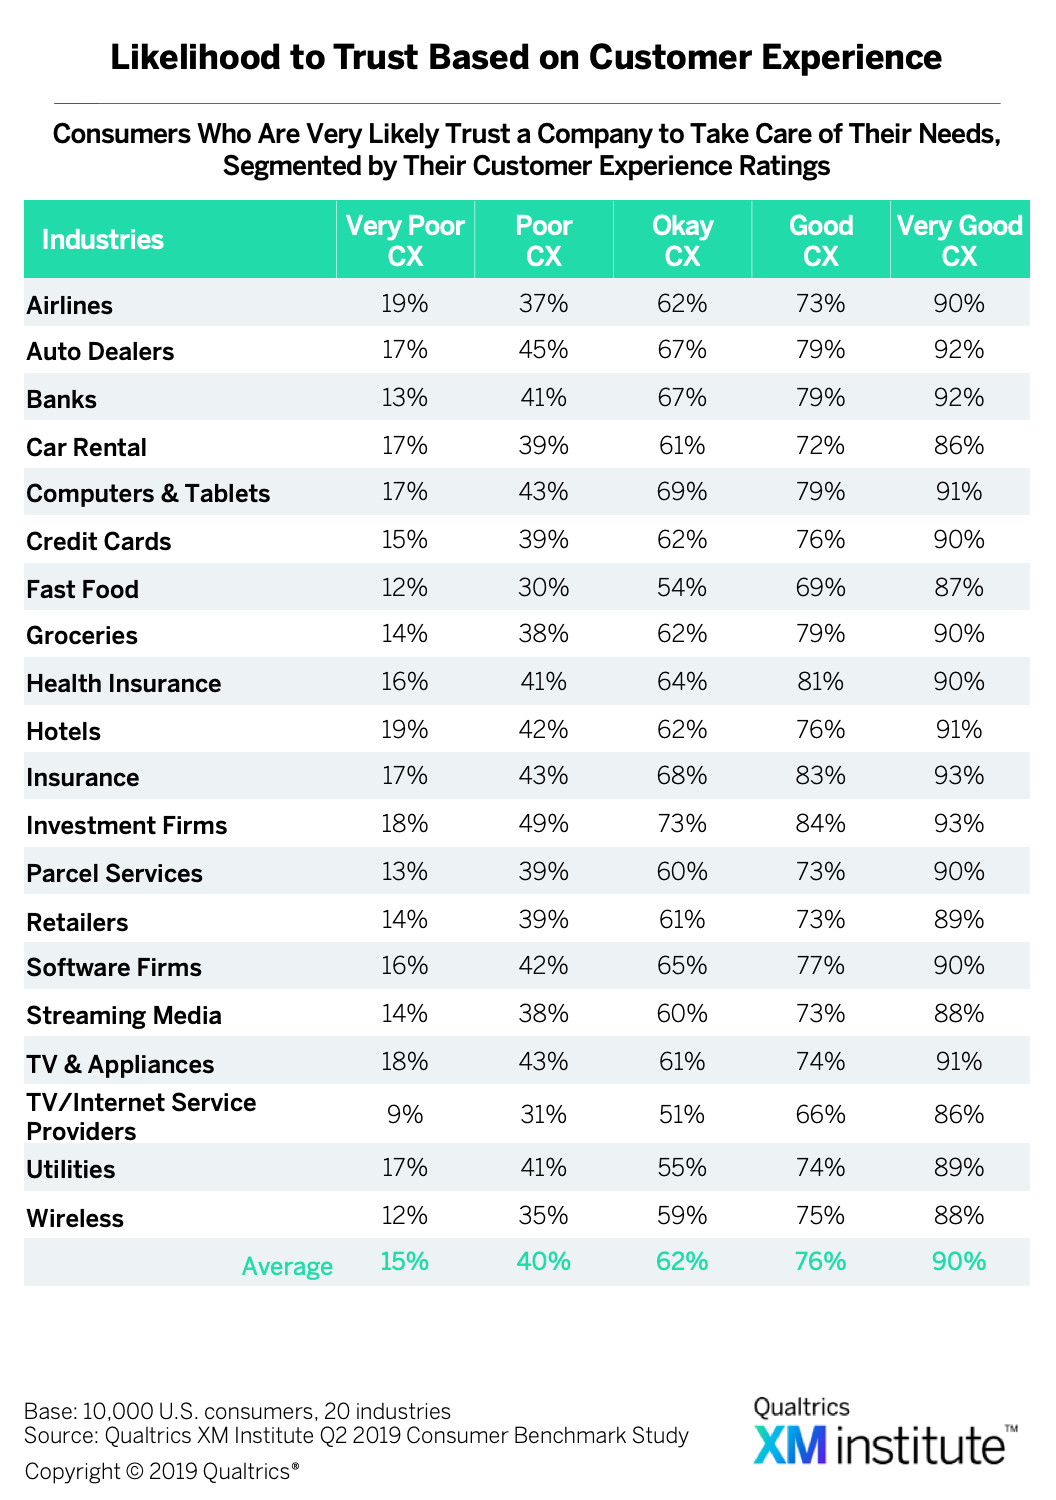 .
. - Try a new offering right away. Sixty-four percent of consumers who give a company a “very good” CX rating are “very likely” to try a new product or service from a company, while only 12% of those who gave a company a “very poor” CX rating say the same. Across the five loyalty metrics, try is the least impacted by customer experience
 .
.
Potential Improvements in Customer Loyalty
Aside from providing a more detailed understanding of the relationship between CX and consumer loyalty, these data can also provide insight into the way CX improvements translate into improvements in customer loyalty. To quantify the potential ROI of focusing more on CX, we considered how modest improvements in CX ratings correspond to an increase in customer loyalty by calculating the difference in loyalty between customers who rate a company as delivering “good” CX and those who rate a company as delivering “poor” CX 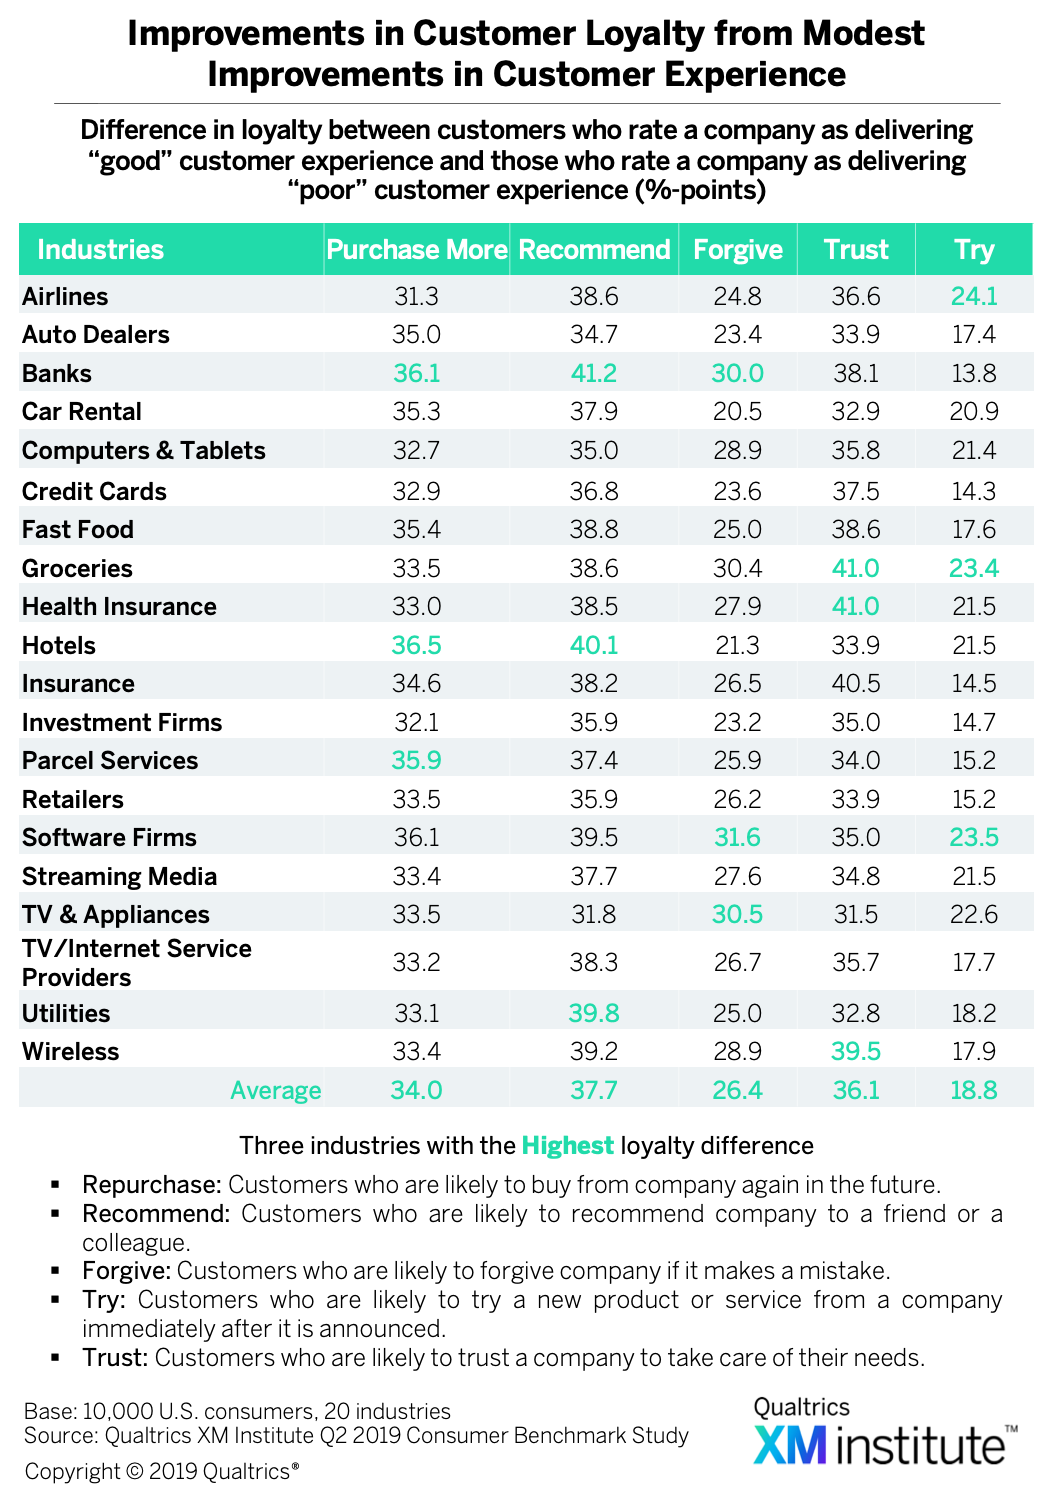 . We found that:
- CX impacts recommendations the most. Modest changes in CX quality have the largest payoffs on consumer likelihood to recommend. On average across 20 industries, there is nearly a 38 percentage-point difference in likelihood to recommend between consumers rating a company’s CX as “good” versus those rating a company’s CX as “poor.”
- CX impacts future purchasing most consistently. On average across 20 industries, there’s a 34 percentage-point difference in likelihood to purchase more products or services between consumers rating a company’s CX as “good” versus those rating a company’s CX as “poor.” Where there was variability across the other loyalty metrics, all industries were within three percentage points of the cross-industry average for purchasing more.
- The groceries industry has the highest potential. While all industries see improvements in consumer loyalty by improving CX, Groceries sees the largest difference in consumer loyalty when examining modest changes in CX. Across the five loyalty metrics, companies in Groceries have, on average, a 33 percentage-point difference in loyalty between consumers giving “good” and “poor” CX ratings.
Build Your Own CX ROI Model
As with all industry-wide research, any single company’s results may vary considerably from these aggregated results. That’s why we recommend companies build their own models for tying loyalty (and revenues) to customer experience measures 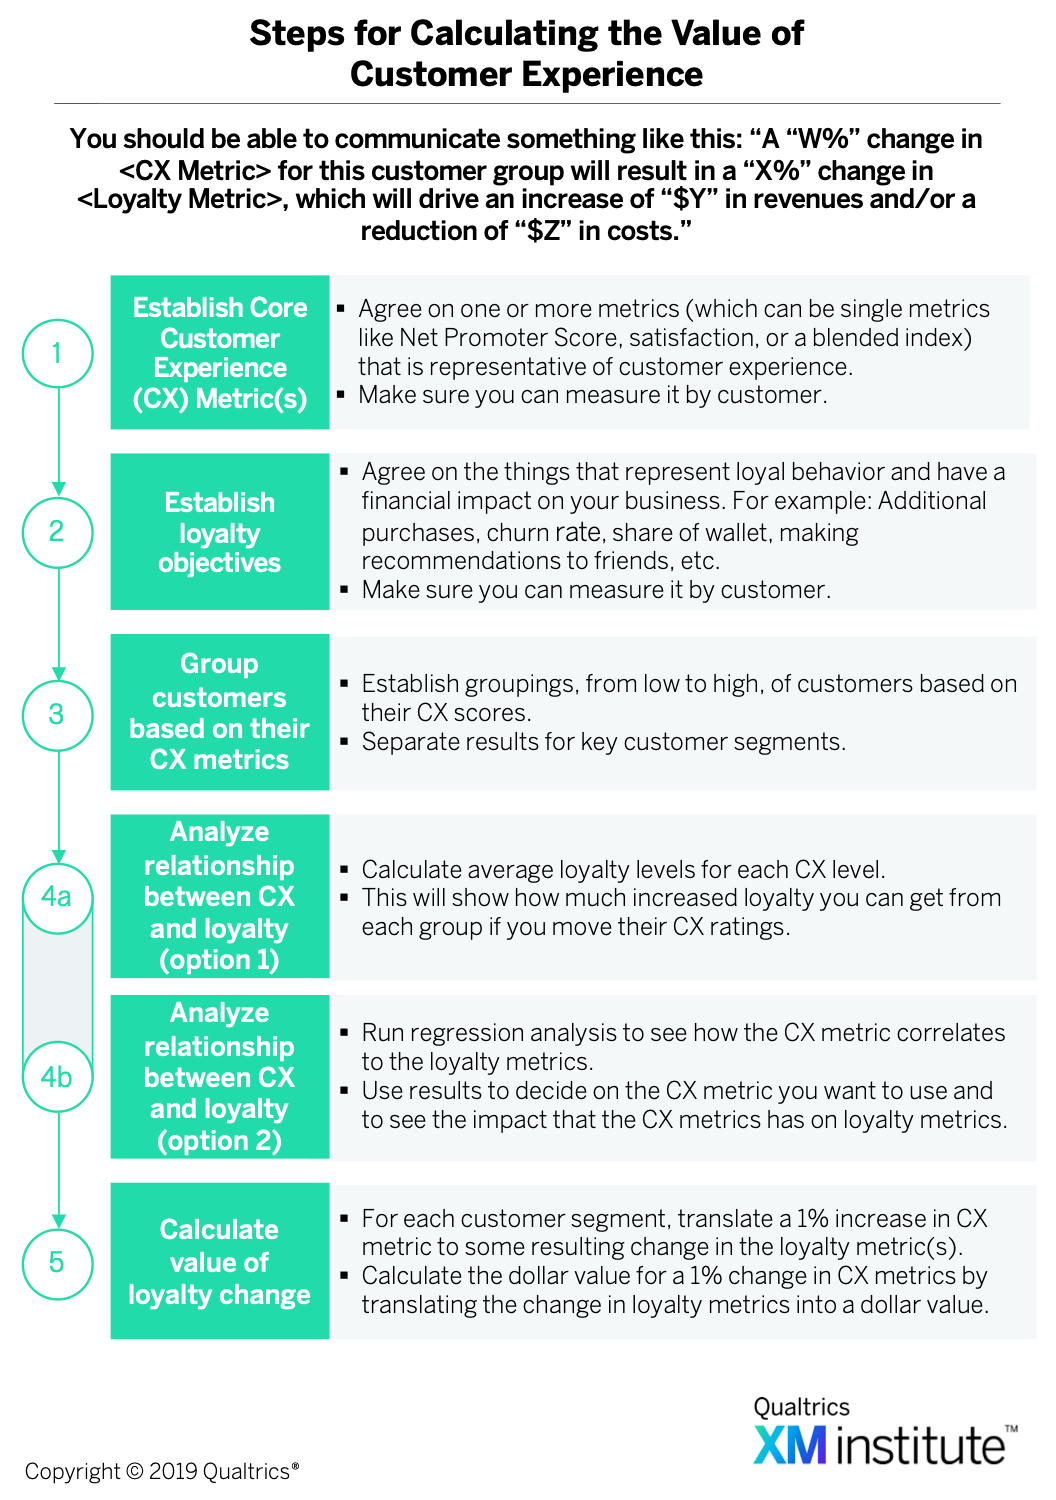 . Here’s some advice to consider as you undertake this effort:
- Enlist your CFO. Even if you have the brightest business analysts in the world on your team, if you do not involve the CFO’s team, the finance leader will always question your financial models and assumptions.
- Use existing metrics. Try to make your case based on the business metrics that your company already uses – it will make it easier for people to understand and will help you earn their buy-in.
- Be conservative. Resist the temptation to use the high end of estimates for potential benefits. While the results may seem more compelling, they will also be harder to defend.
- Create a simple story. People tend to remember very simple story lines, so make sure that you organize your results in a way that is easy for people to understand.
- See the XM Institute Insight Report, “The State of Customer Experience Management, 2019,” (August 2019).
- For the Customer Ratings, we used the “2019 XMI Customer Ratings – Overall,” which evaluates three areas of an experience: success, effort, and emotion. To normalize scores across the industries, the analysis compares the data for each company with their industry average. See the XM Institute Insight Report, “2019 XMI Customer Ratings – Overall,” (October 2019).
- For the purchasing data, we looked at consumers’ responses to the question: “How likely are you to consider purchasing more products or services from these companies in the future?” We included the percentage of consumers who selected either 6 or 7 on a scale from 1 (“extremely unlikely”) to 7 (“extremely likely”).
- See the XM Institute Insight Report, “2019 XMI Customer Ratings – Consumer NPS,” (October 2019). Net Promoter Score, Net Promoter, and NPS are registered trademarks of Bain & Company, Satmetrix, and Fred Reichheld.


