Experience Management Impacts Business Performance
To understand the state of Experience Management (XM) around the world, the XM Institute surveyed 1,221 executives from six different countries 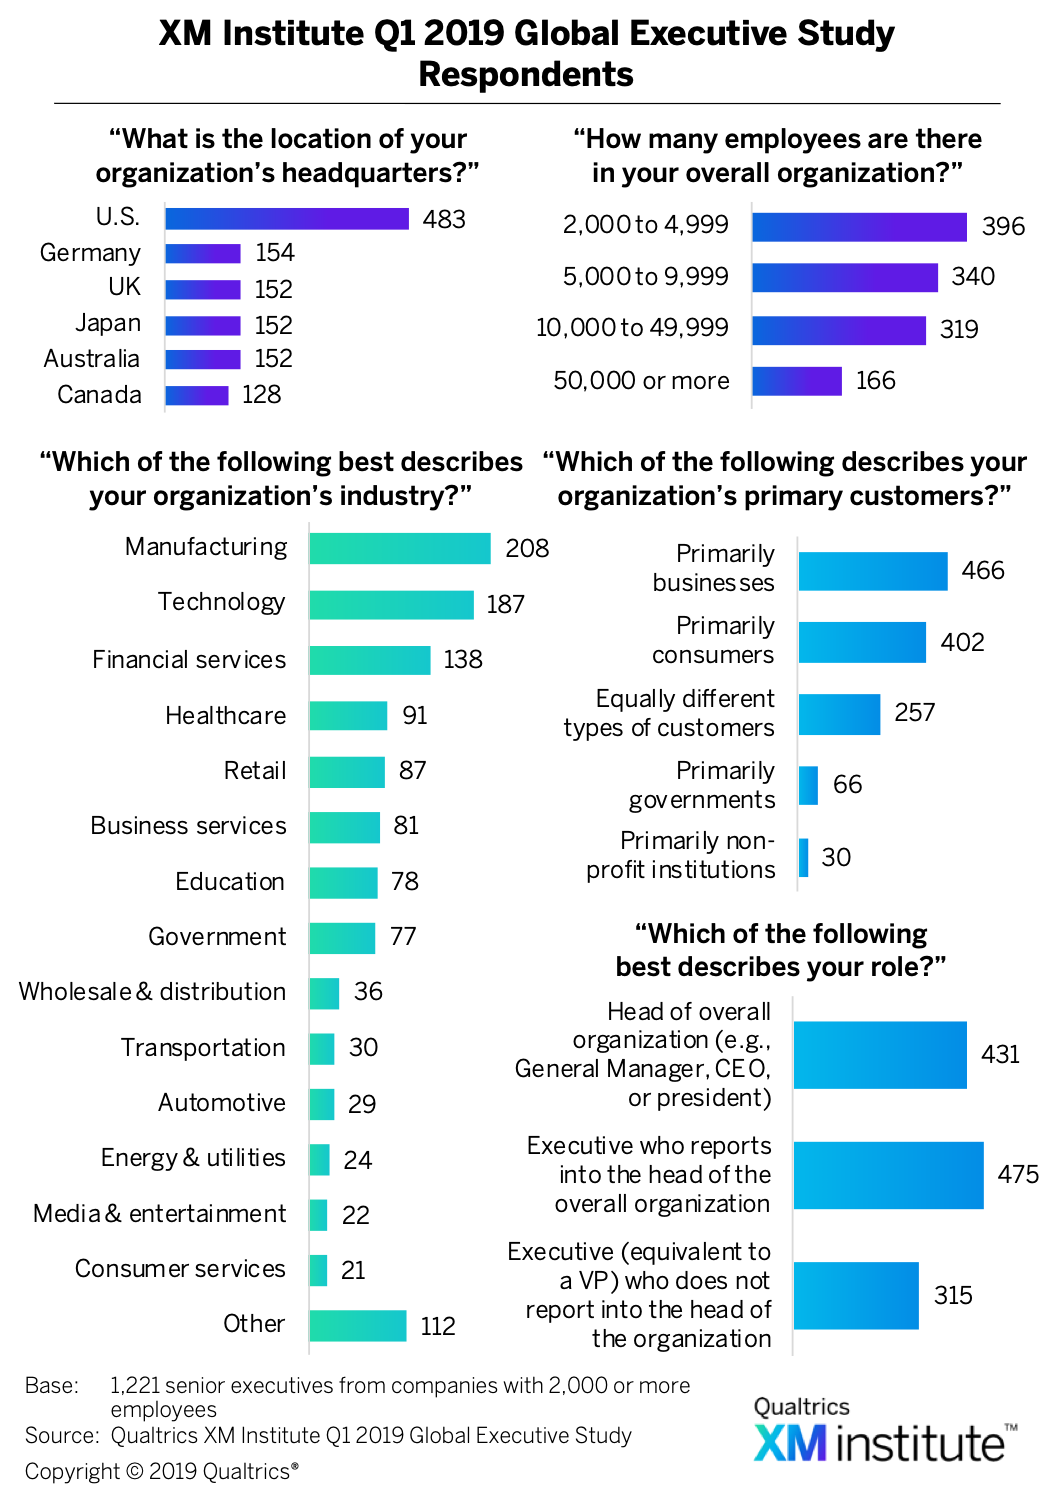 .1 In addition to exploring regional differences, we also explored variations between companies based on their XM performance – analyzing the difference between companies with strong XM capabilities and those with weaker XM capabilities. When we compared these two groups, we found a large gap in their business performance
 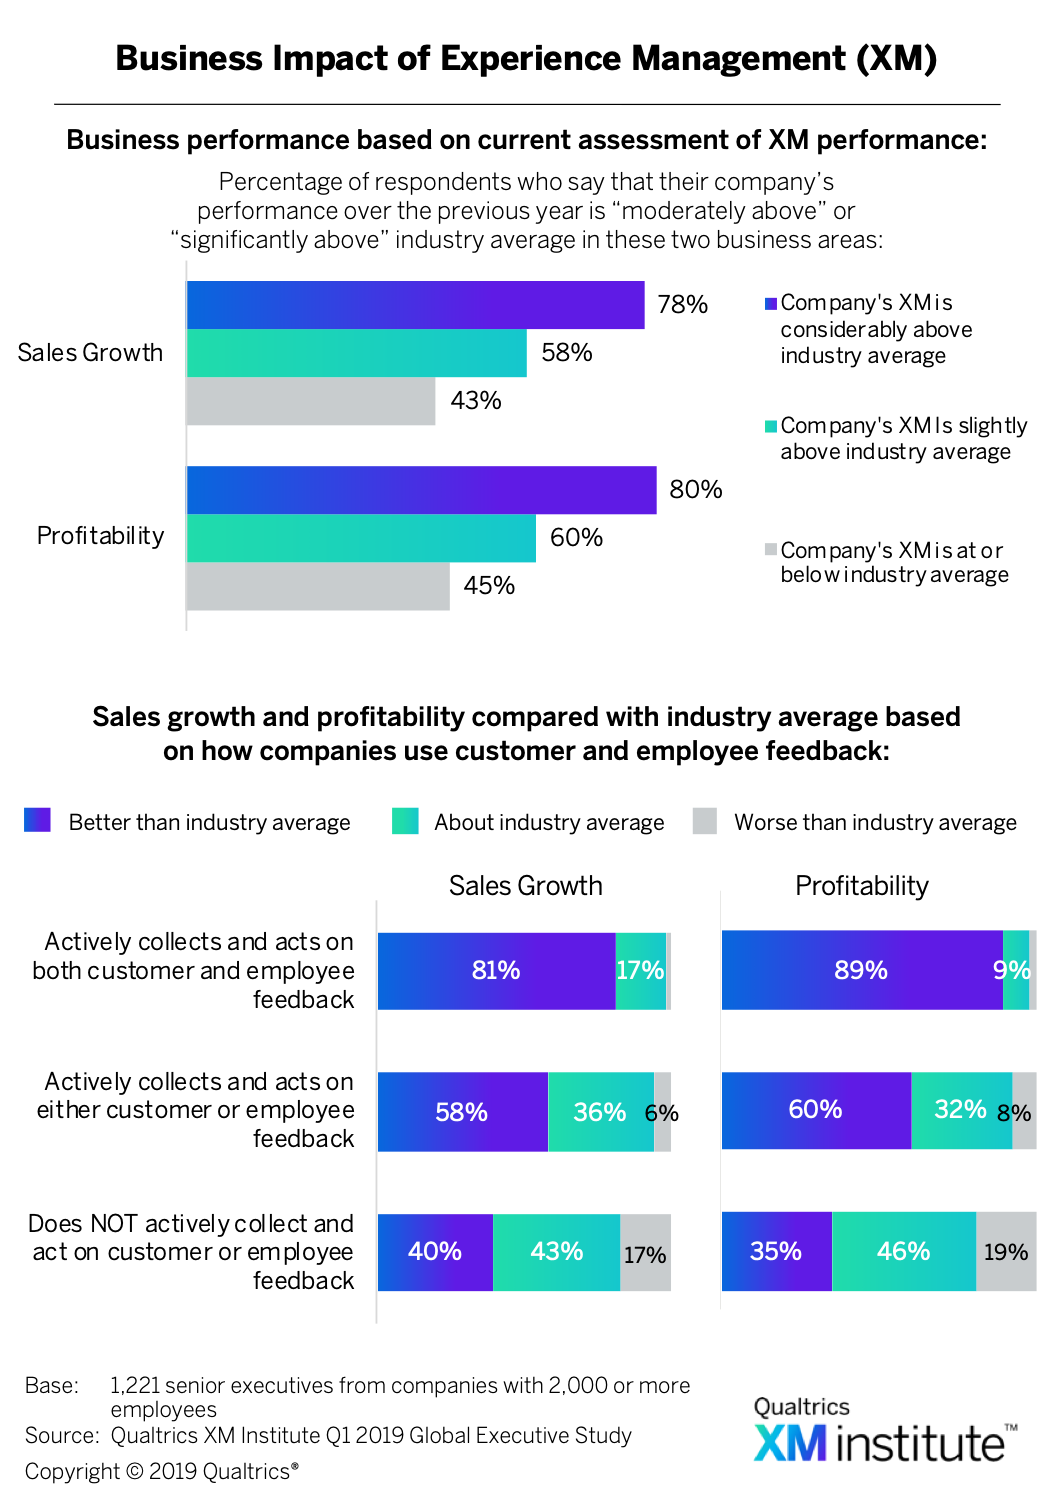 .2 The data shows that:
- XM performance correlates to growth and profitability. When we asked executives to rate their sales growth and profitability compared to their industry average, we found that companies who are better at XM are more likely to outperform their competitors on both of these business metrics. Of the respondents who rate their company’s XM as “considerably above average,” four in five say that their profitability over the last year was above average for their industry, and 78% say their sales growth was above average. Both of these results are 35 percentage-points higher than those companies with “average” or “below average” XM.
- Customer and employee feedback are a powerful combination. We also examined sales growth and profitability based on whether or not a company actively uses customer and employee feedback. Eighty-one percent of companies that use both types of feedback classify their sales growth as “above average,” whereas only 58% of companies who use only one type of feedback and 40% of companies who don’t use either type of feedback say their sales growth is better than average. The gaps are even larger when it comes to profitability, with 89% of companies who actively collect and act on customer and employee feedback saying their profits are higher than average, compared to 60% of those who use only one type of feedback and 35% who use neither type of feedback.
XM Is Important Around the World
Given this connection between XM and business results, it’s no surprise that more than 70% of respondents across all countries consider it at least moderately important for their organization to improve XM 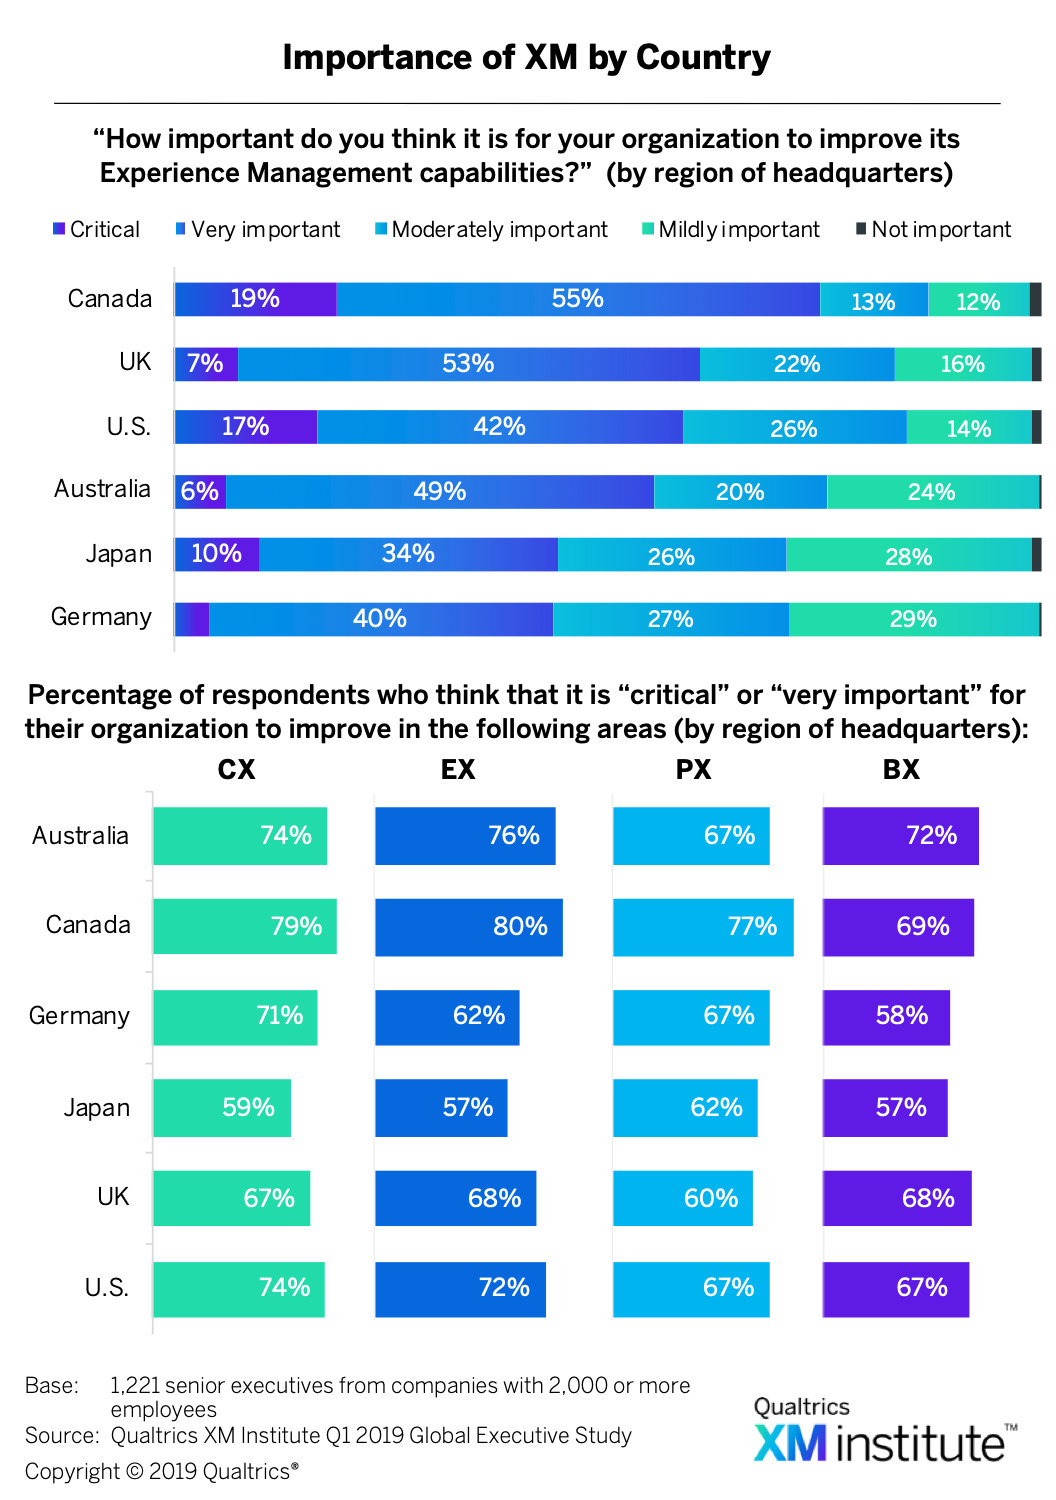 . When we examined the data across the six countries, we found that:
- Canadian companies value XM most highly. At the top of the list, 74% of Canadian respondents believe that improving XM is either “very important” or “critical” for their organization. At the other end of the spectrum, only 44% of the German respondents feel the same way.
- CX is the most important experience area for Germany and the U.S. The percentage of respondents who think it’s very important for their company to improve customer experience (CX) ranges from 79% for Canada down to 59% for Japan. When we looked across all four experiences areas, we found that Germany and the U.S. prioritize CX above the other three experience areas.
- EX is the most important experience area for Australia, Canada, and the UK. The percentage of respondents who say it’s very important to improve employee experience (EX) ranges from 80% for Canada down to 57% for Japan. When we looked across all four experience areas, we found that Australia and Canada weigh EX more heavily than the other three experience areas, while the UK weights EX and brand experience (BX) equally.
- PX is the most important experience area for Japan. The percentage of respondents who consider it very important to improve product experience (PX) ranges from 77% for Canada down to 60% for the UK. When we looked across all four experience areas, we found that only Japan prioritizes PX above all other experience areas.
- BX is the most important experience area for the UK. The percentage of respondents who believe it’s very important to improve BX ranges from 72% for Canada down to 57% for Japan. When we looked across all four experience areas, we found that only the UK prioritizes BX; although, it is equally focused on BX and EX.
XM Activities and Plans
We examined several different XM-centric activities and their prevalence across these six countries and found that 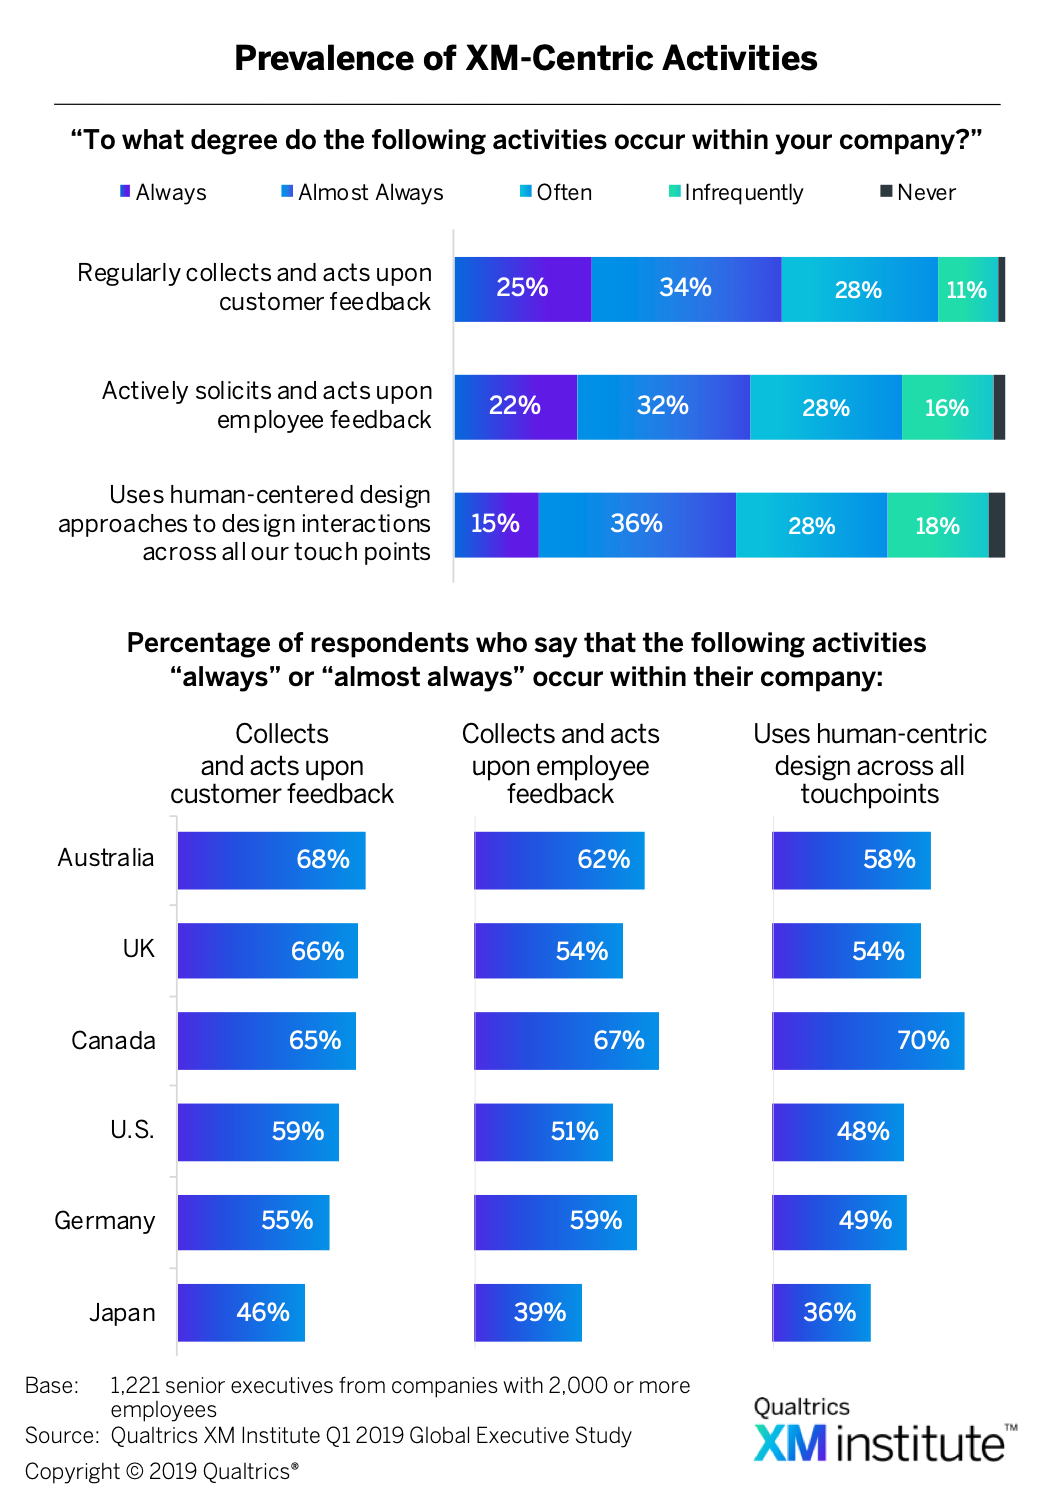 :
:
- Australia is strongest at customer feedback. Fifty-nine percent of all respondents say that their company regularly collects and acts upon customer feedback. The percentage of executives who say that their organization “always” or “almost always” uses customer feedback ranges from a high of 68% for Australia down to a low of 46% for Japan.
- Canada uses employee feedback most frequently. Fifty-four percent of all companies actively solicit and act upon employee feedback. The percentage of respondents who say that their organization “always” or “almost always” uses employee feedback ranges from a high of 67% for Canada down to a low of 39% for Japan.
- Canada leads in experience design. Fifty-one percent of all executives say that experience design is used widely across their business. The percentage of respondents who say that their organization “always” or “almost always” uses human-centric design across all touchpoints ranges from a high of 70% for Canada down to a low of 35% for Japan.
Companies Plan to Use Feedback More in the Coming Year
We asked respondents how much effort they expect their organization to put into using customer and employee feedback to improve customer experience, employee engagement, their product/service offerings, and brand perception in the next year 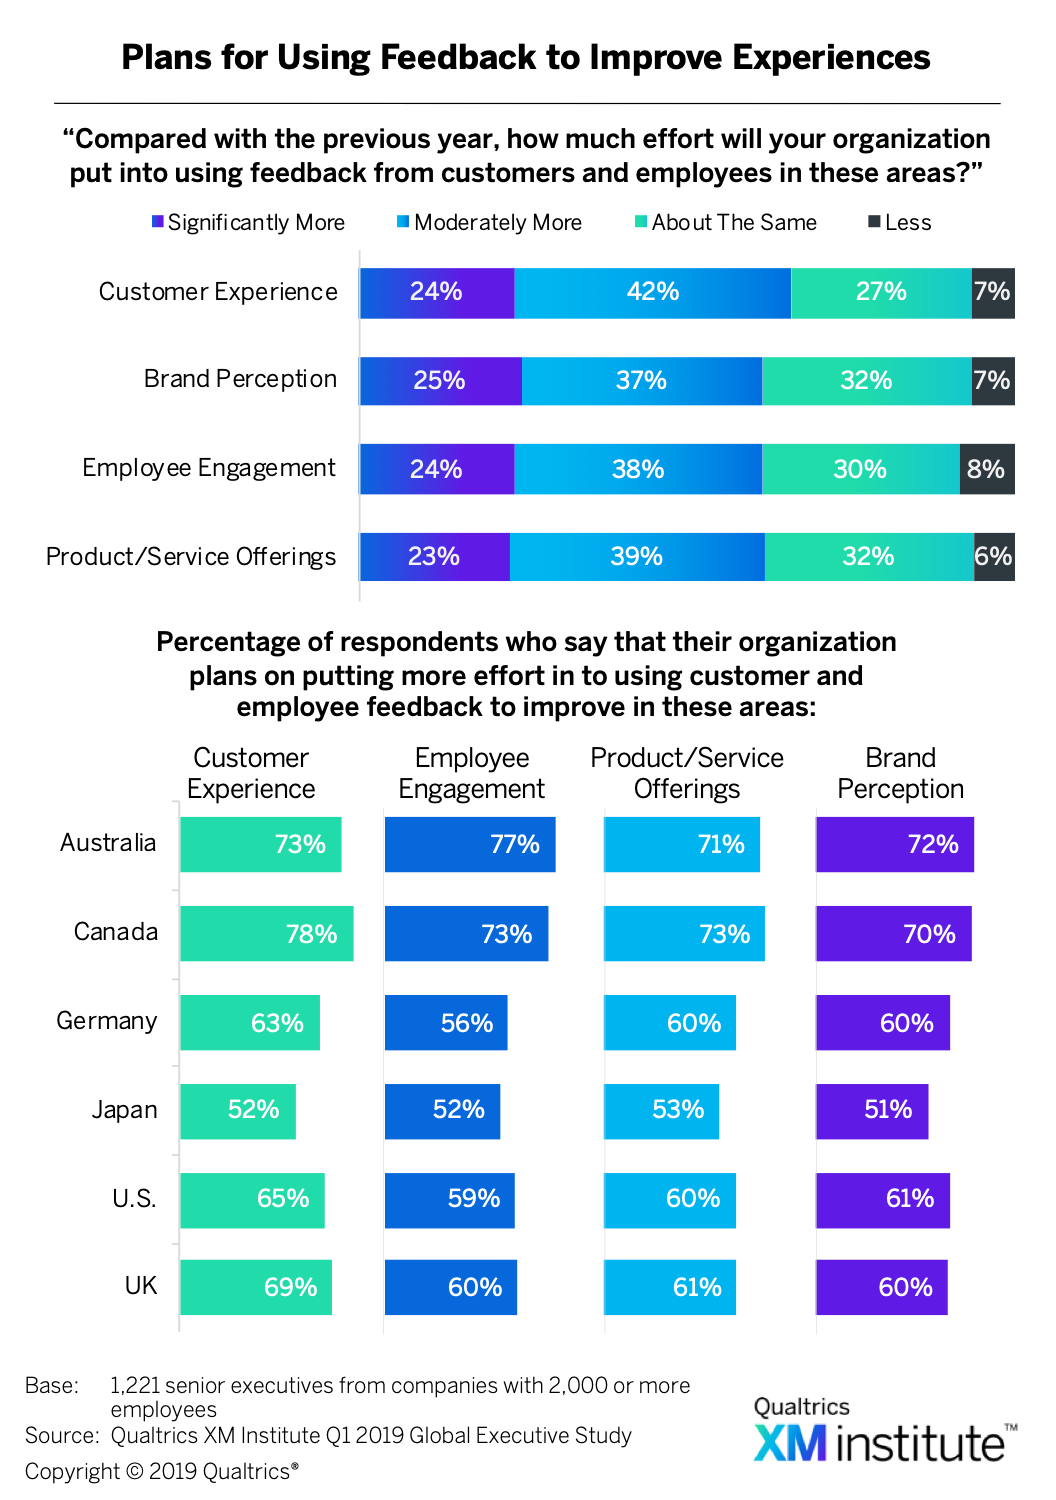 . Results show that there’s significant momentum across all four of these areas. In fact, the percentage of companies who expect to put more effort into using feedback in the future is at least seven times larger than the percentage of those who plan to cut back. In addition, we found that:
- Most countries plan to use feedback to improve CX. Respondents from Canada, Germany, the U.S., and the UK all expect their organizations to increase their use of feedback to improve their customer experiences more than to improve the other three experience areas. The range of respondents who plan to use more feedback to improve CX ranges from a high of 78% for Canada to a low of 52% for Japan.
- Australia is prioritizing employee engagement. Seventy-seven percent of Australian respondents expect their organizations to increase their use of feedback to improve employee engagement, which is both the highest percentage for any country and the highest percentage of the four areas. At the low end, only 52% of Japanese companies are planning to put more effort into using feedback to engage employees.
- Japan will increase their focus most on products and services. Fifty-three percent of Japanese respondents expect their organizations to increase their use of feedback to improve their products and services, making it the highest priority area for Japanese companies. However, of all the countries, Japan still has the lowest percentage of companies who intend to leverage feedback to improve products and services. Canada has the highest percentage (73%), followed by Australia (71%) and the UK (61%).
- Brand perception is not being prioritized. Compared to the other three experience areas, respondents from all six countries are less likely to be planning on increasing their use of feedback to improve brand perception. The range of respondents who plan to use more feedback to improve brand perception ranges from a high of 72% for Australia to a low of 51% for Japan.
Obstacles to XM Success
We asked respondents to select the items that they feel are significant obstacles to their company’s XM efforts. Here’s what we found:
- XM leaders run into technology limitations. Twenty-six percent of companies whose XM capabilities are considerably above average selected technology limitations as a significant obstacle to their XM efforts
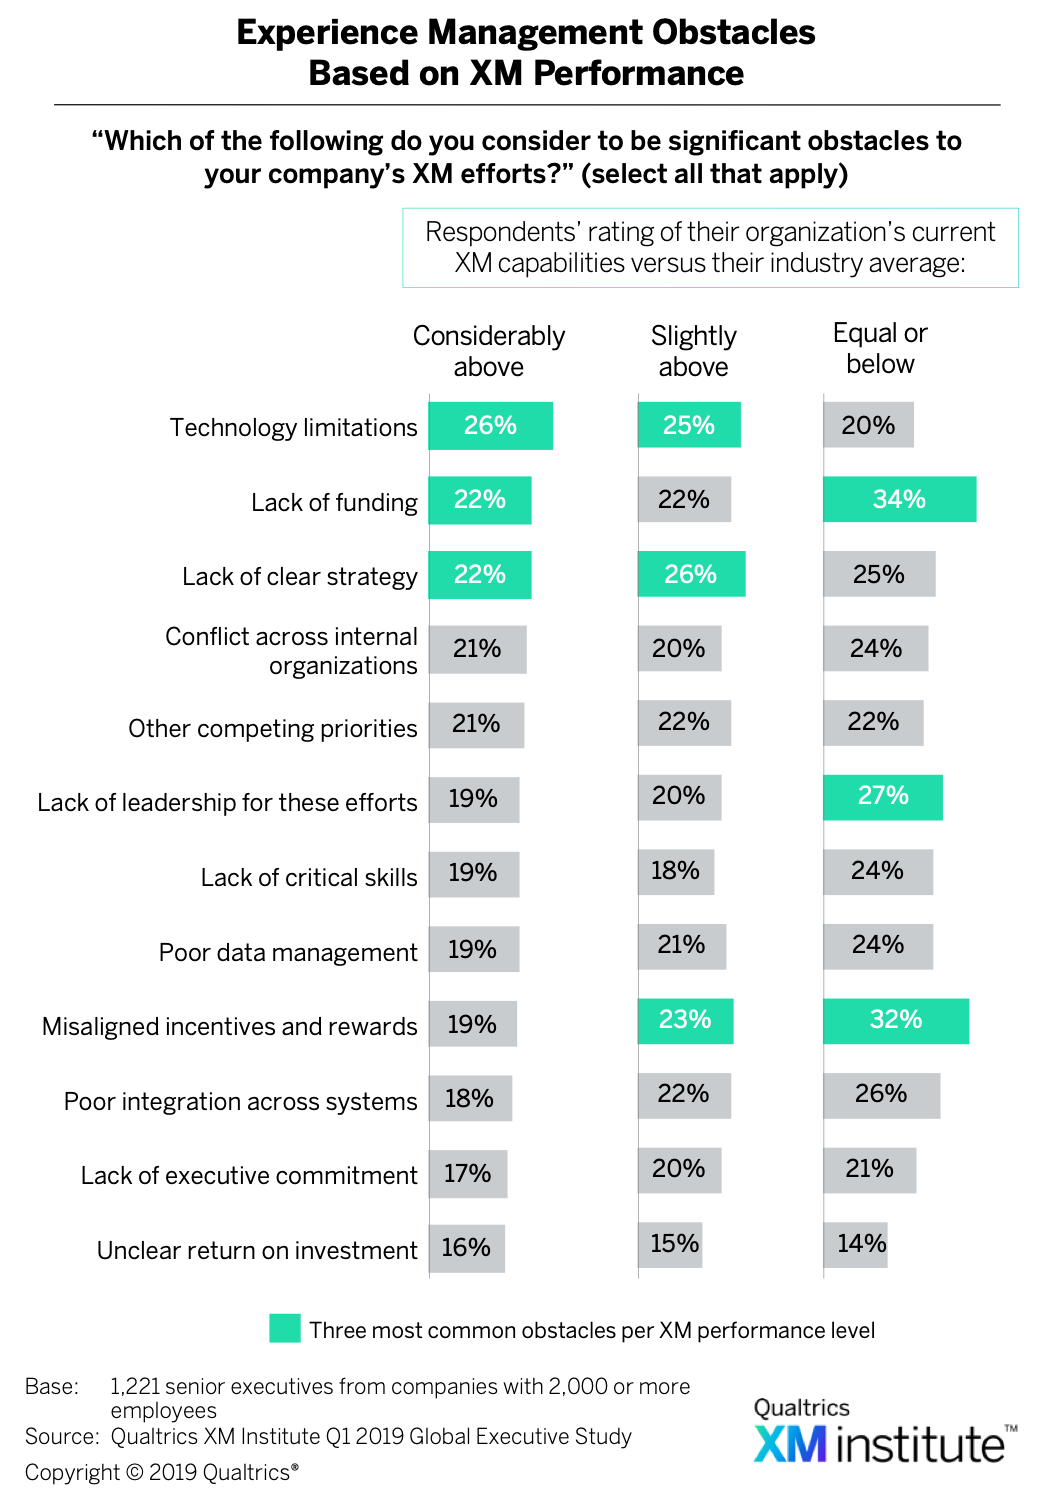 . This was not only the most common obstacle for this group, but these companies also ran into this problem more frequently than organizations with less strong XM capabilities.
 - XM laggards suffer from a lack of strategy and leadership. Thirty-four percent of companies whose XM capabilities are average or below average selected lack of clear strategy as a significant obstacle, making it the most frequently encountered obstacle for this group. The second most common issue is lack of leadership for these efforts, with 32% of this group identifying it as a problem.
- Japanese companies struggle with XM strategy and skills. We found that the obstacles companies are likely to encounter is different across countries
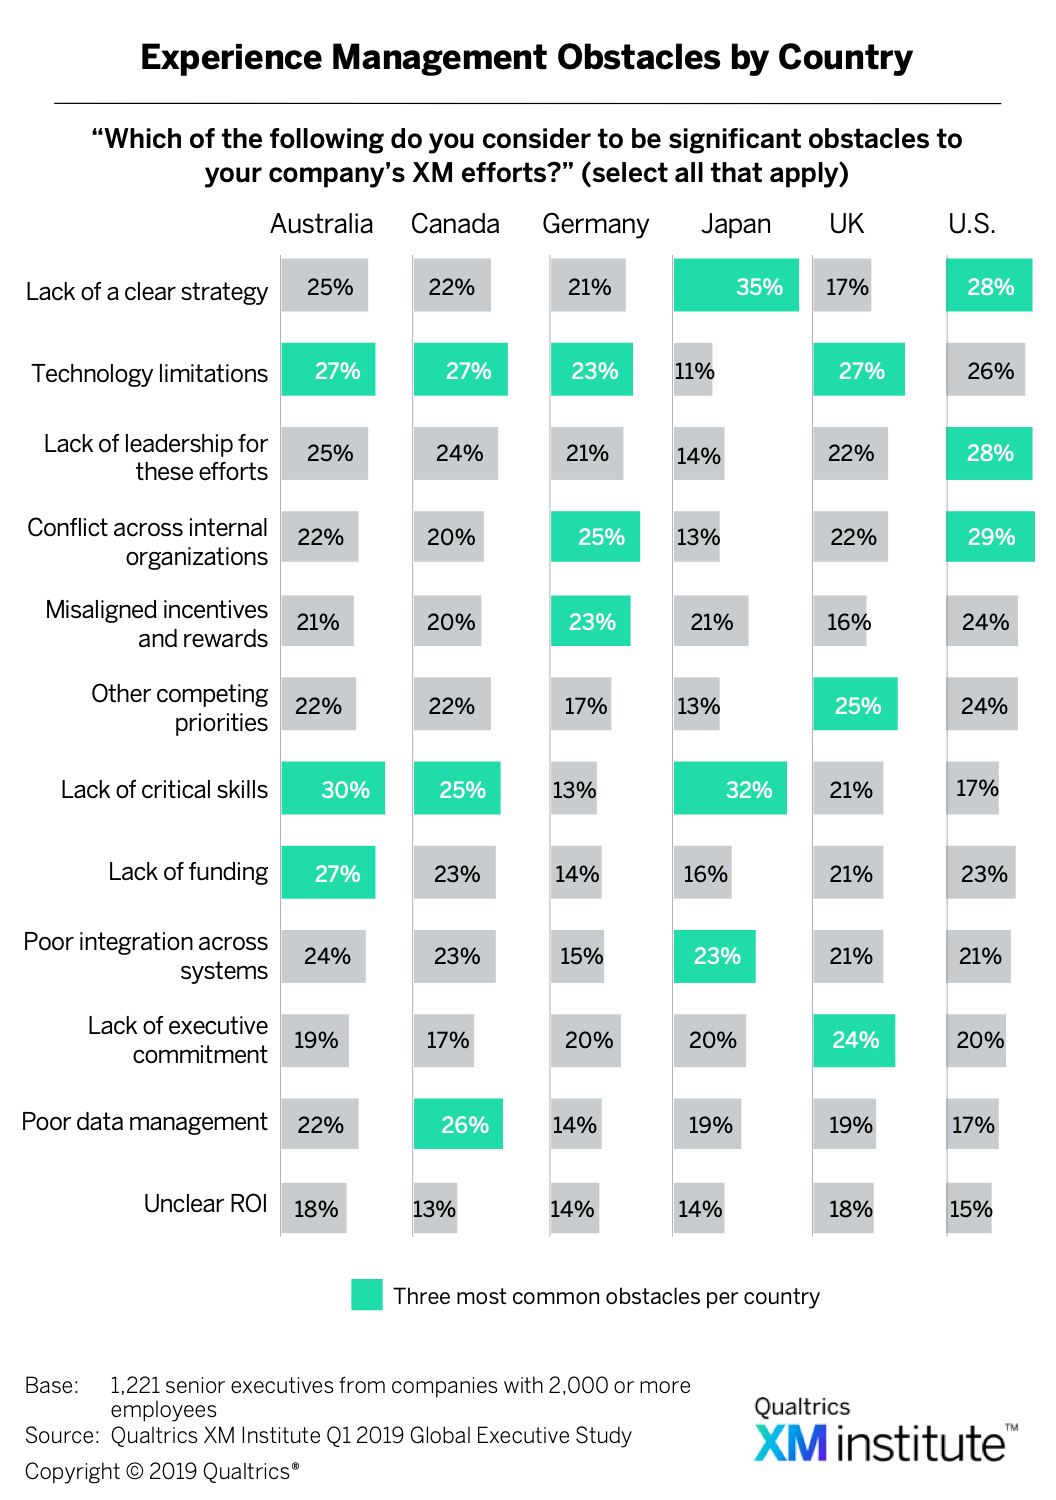 . The two top obstacles identified for any country were both in Japan, where 35% of executives selected lack of a clear strategy and 32% selected lack of critical skills. The next most commonly selected obstacle also lack of critical skills as 30% of Australian respondents identified it as a significant issue.
The Path to XM Maturity
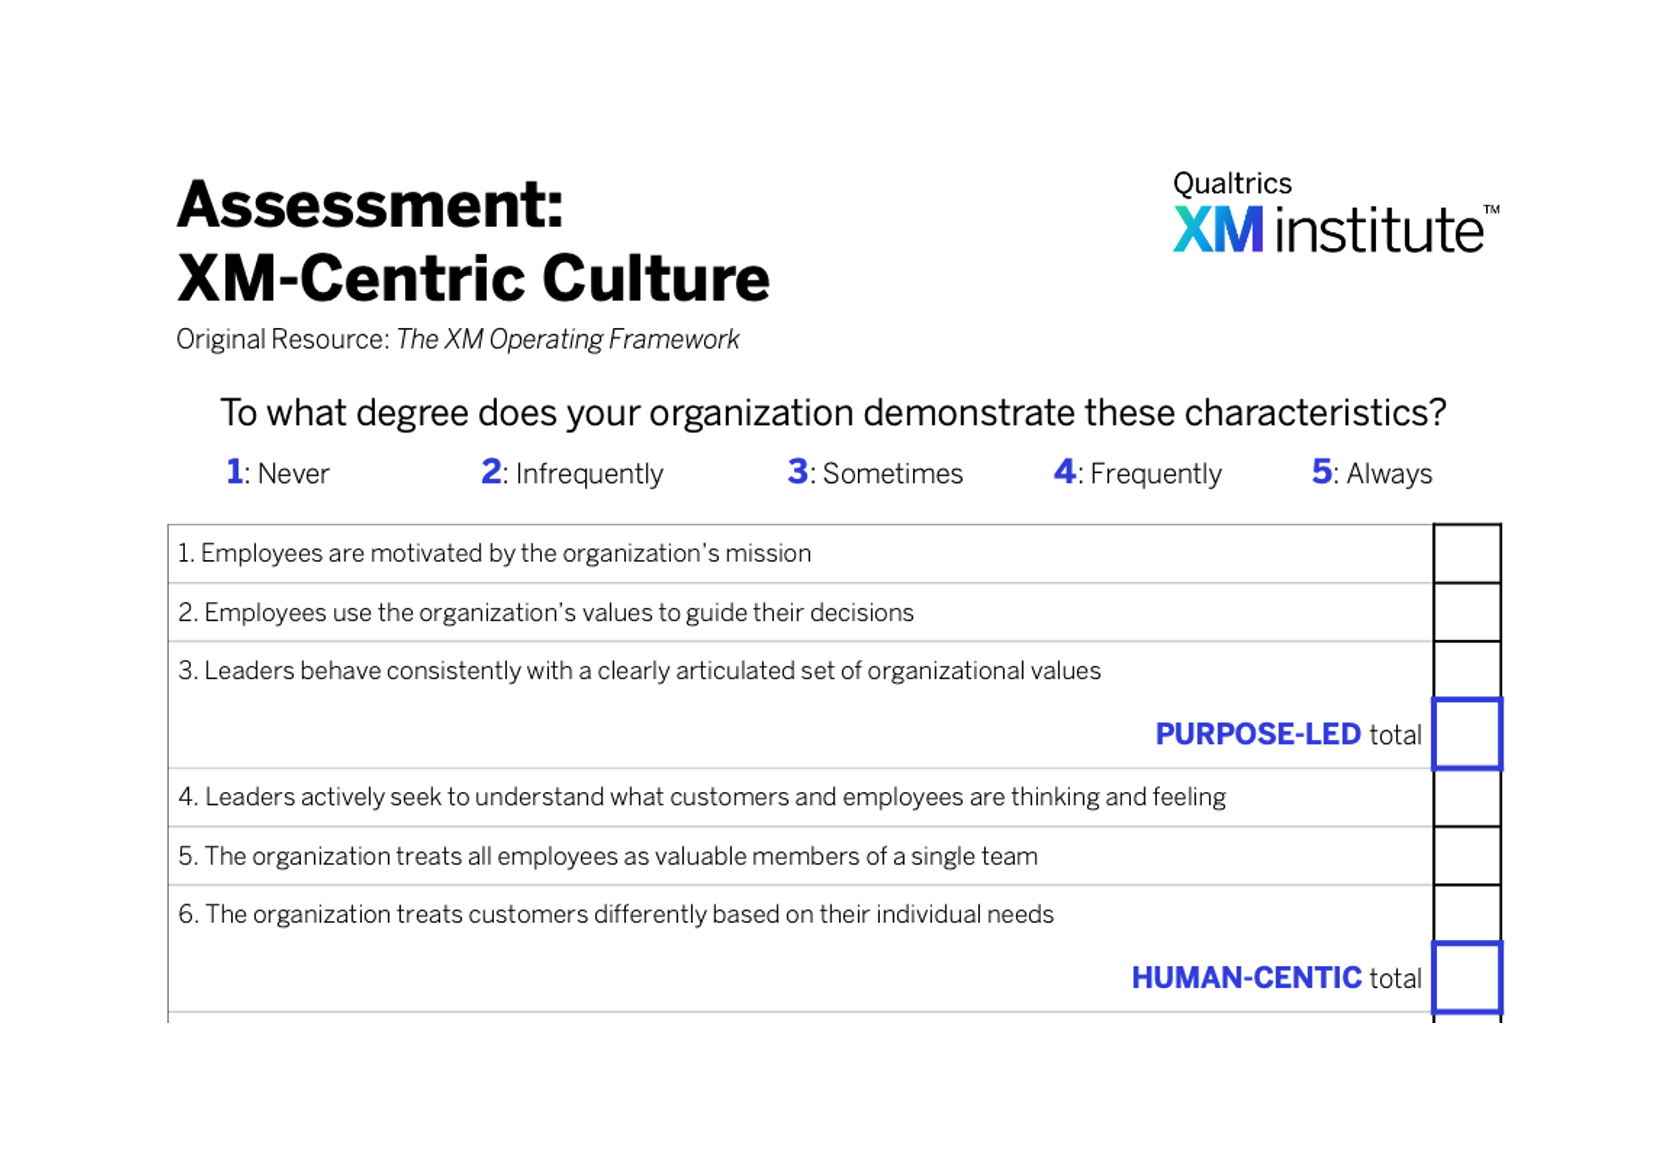
How can organizations around the world improve their Experience Management? By developing a persistent set of capabilities that will drive their XM maturity 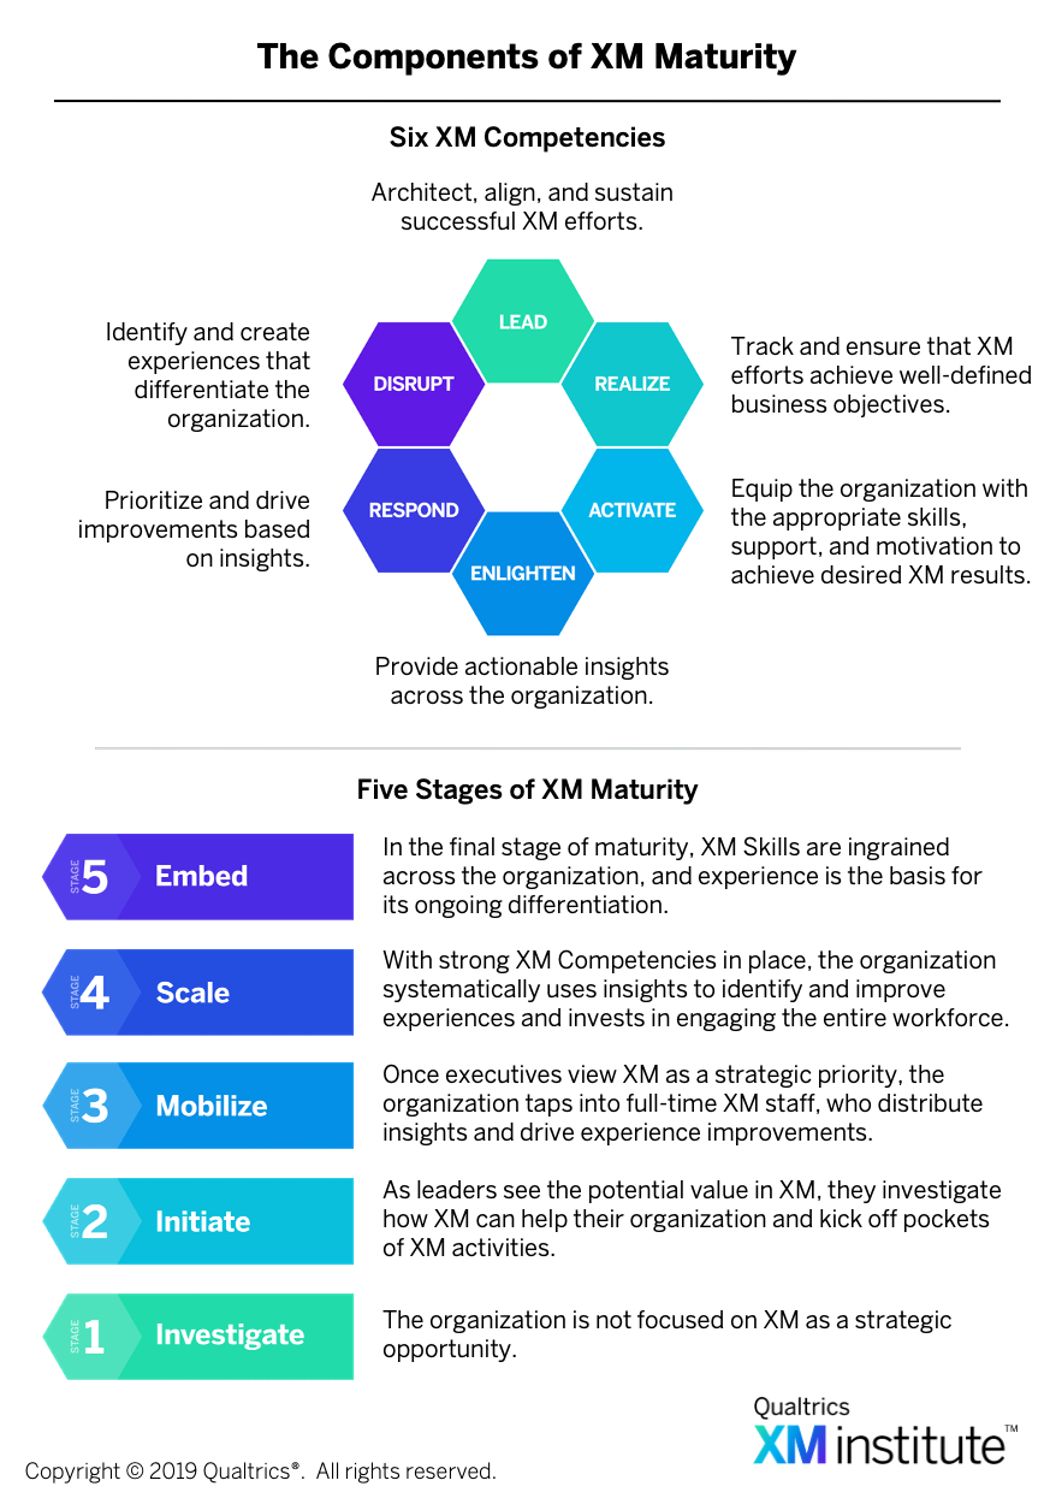 . The XM Institute has developed what it calls the XM Operating Framework, which is focused on building six XM Competencies:3
- LEAD: Architect, align, and sustain successful XM efforts.
- REALIZE: Track and ensure that XM efforts achieve well-defined business objectives.
- ACTIVATE: Equip the organization with the appropriate skills, support, and motivation to achieve desired XM results.
- ENLIGHTEN: Provide actionable insights across an organization.
- RESPOND: Prioritize and drive improvements based on insights.
- DISRUPT: Identify and create experiences that differentiate the organization.
Five Stages of XM Maturity
As organizations build out and master these six XM Competencies, they will evolve through five stages of maturity:
- Stage 1: Investigate. The organization is not focused on XM as a strategic opportunity. Companies in this stage should work on identifying the “best” first steps and building buy-in with senior executives to acquire the resources needed for moving forward.
- Stage 2: Initiate. As leaders see the potential value in XM, they investigate how XM can help their organization and kick off isolated pockets of XM activities. Companies in this stage should work on building a broader understanding of and cross-functional support for the XM strategy. They should also focus on delivering value from their initial efforts so they can gain the next level of executive and organizational commitment.
- Stage 3: Mobilize. Once executives view XM as a strategic priority, the organization taps into full-time XM staff, who distributes insights and drives experience improvements. Companies in this stage should work on developing XM programs that drive action and improve pain points. They should also educate employees across the organization on what good XM behaviors look like and how they can demonstrate them in their individual roles.
- Stage 4: Scale. With strong XM Competencies in place, the organization systematically uses insights to identify and improve experiences and invests in engaging the entire workforce in XM. Companies in this stage should use advanced analytics and XM metrics to improve experiences targeted at narrower segments of people and design new processes that span multiple lines of business. They should also reinforce good XM behaviors by deeply integrating XM into their HR processes.
- Stage 5: Embed. In the final stage of maturity, XM Skills are ingrained across the organization, and it is able to quickly react to shifts in the marketplace. Mature XM programs enable the organization to continuously listen, propagate insights, and rapidly adapt to the needs and expectations of customers, employees, partners, and suppliers.
- The data for this study came from the Qualtrics XM Institute Q1 2019 Global Executive Study, which was an online survey of 1,221 senior executives from six countries, Australia, Canada, Germany, Japan, UK, and U.S. We limited respondents to senior executives from organizations with at least 2,000 employees.
- Prior to asking respondents to rate their organization’s Experience Management (XM) capabilities, we defined XM as “the ongoing process of monitoring an organization’s product, customer, employee, and brand interactions in order to measure, prioritize, and optimize opportunities for improvement.”
- See the Qualtrics XM Institute Insight Report, “Operationalizing XM,” (July 2019).