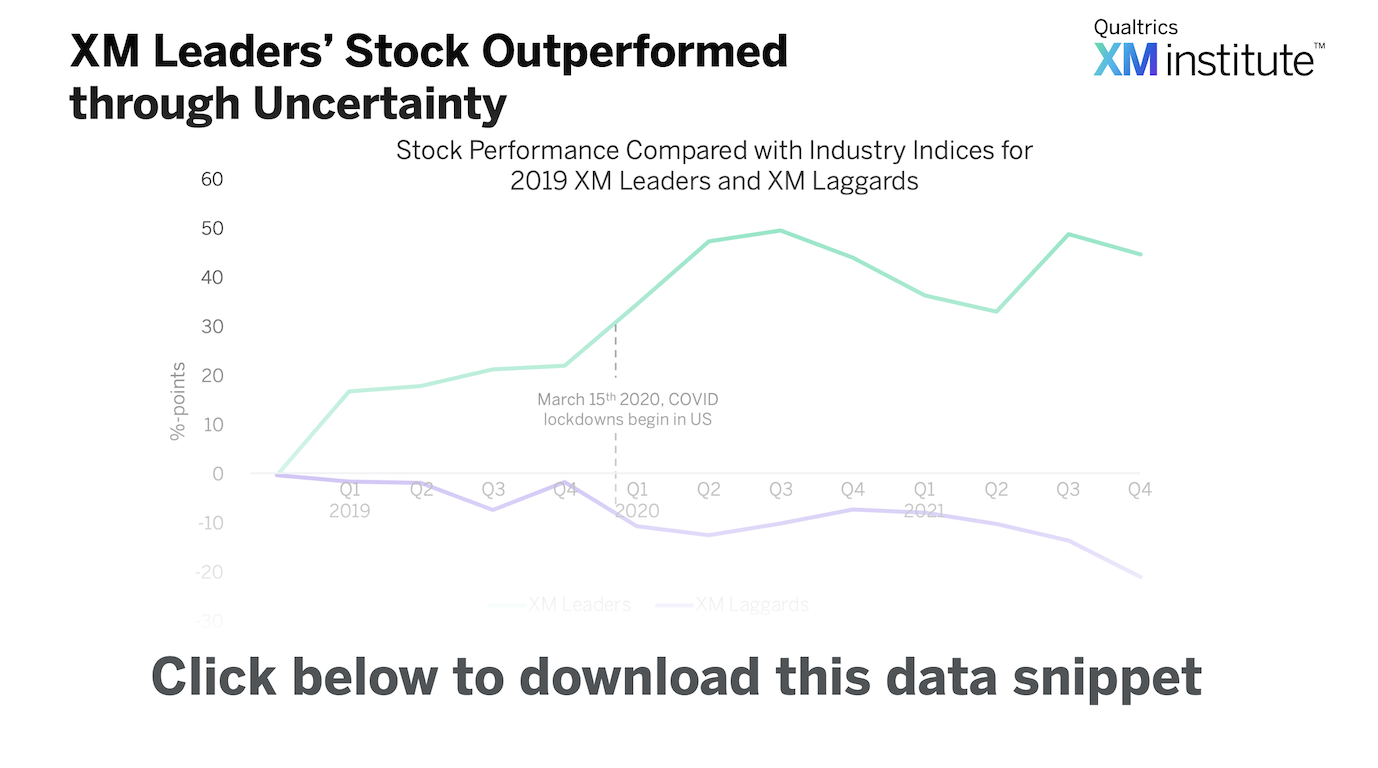
Each year, we calculate the XMI Customer Ratings – Overall, a benchmark derived from consumer evaluations of their recent customer experiences with hundreds of companies. Based on the 2019 XMI Customer Ratings – Overall, we took the top and bottom scoring publicly traded companies and compared them to corresponding industry indices to understand how the stock performance of XM leaders and laggards fared during and after the economic downturn in 2020.
We found that at the end of 2019, the normalized gap in the stock prices between XM leaders and XM laggards was 24 percentage points, but it grew to 66 percentage-points over the next two years as companies responded to COVID. Use these insights to help make the case that stronger Experience Management capabilities correspond to better business performance – particularly during times of economic uncertainty – as it enables organizations to better sense and respond to changes.
To see the full methodology behind this graphic, check out our blog post, Experience Management Leaders’ Stock Price Outperformed Peers Through COVID.
To use this Data Snippet, download and include it in presentations. The graphic is free to use but must retain the copyright notice.


