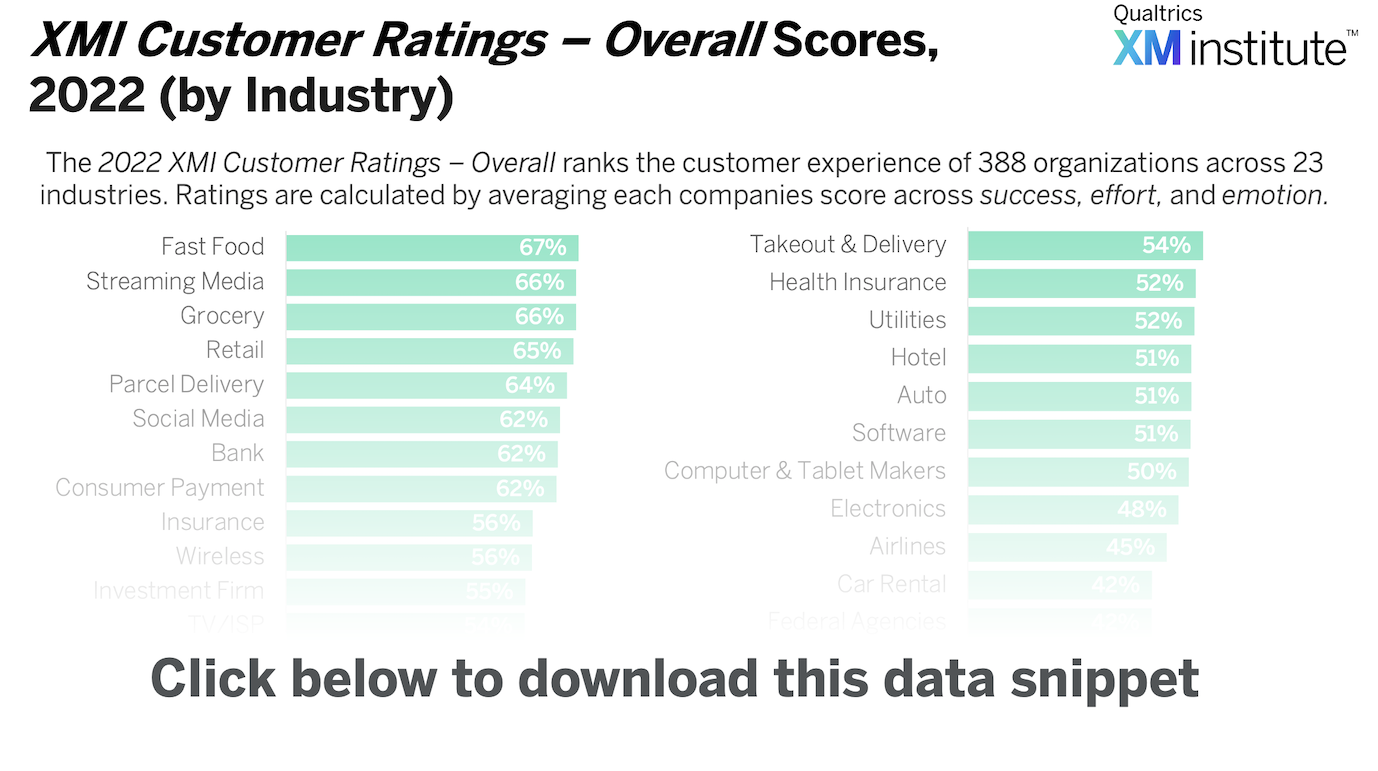
As part of our annual U.S. consumer benchmark study, we asked respondents to evaluate organizations across the three components of customer experience: success, effort, and emotion. We calculated the XMI Customer Ratings – Overall score for each company by averaging the scores organizations received across those three components. Industry scores are an average of those company scores.
We found that fast food received the highest XMI Customer Rating – Overall scores, at an industry average of 67%, while federal agencies received the lowest scores, with an industry average of just 42%. Use these insights to understand where your organization’s customer experience ranks both within your industry and across industries.
This U.S. consumer benchmark study surveyed 10,000 consumers across 388 companies and 23 industries on success, effort, and emotion. To see how industries’ performance in 2022 compares to their scores in 2021, check out last year’s version of the data snippet: XMI Customer Ratings – Overall Scores, 2021 (by Industry).
To use this Data Snippet, download and include it in presentations. The graphic is free to use but must retain the copyright notice.