Key Takeaways
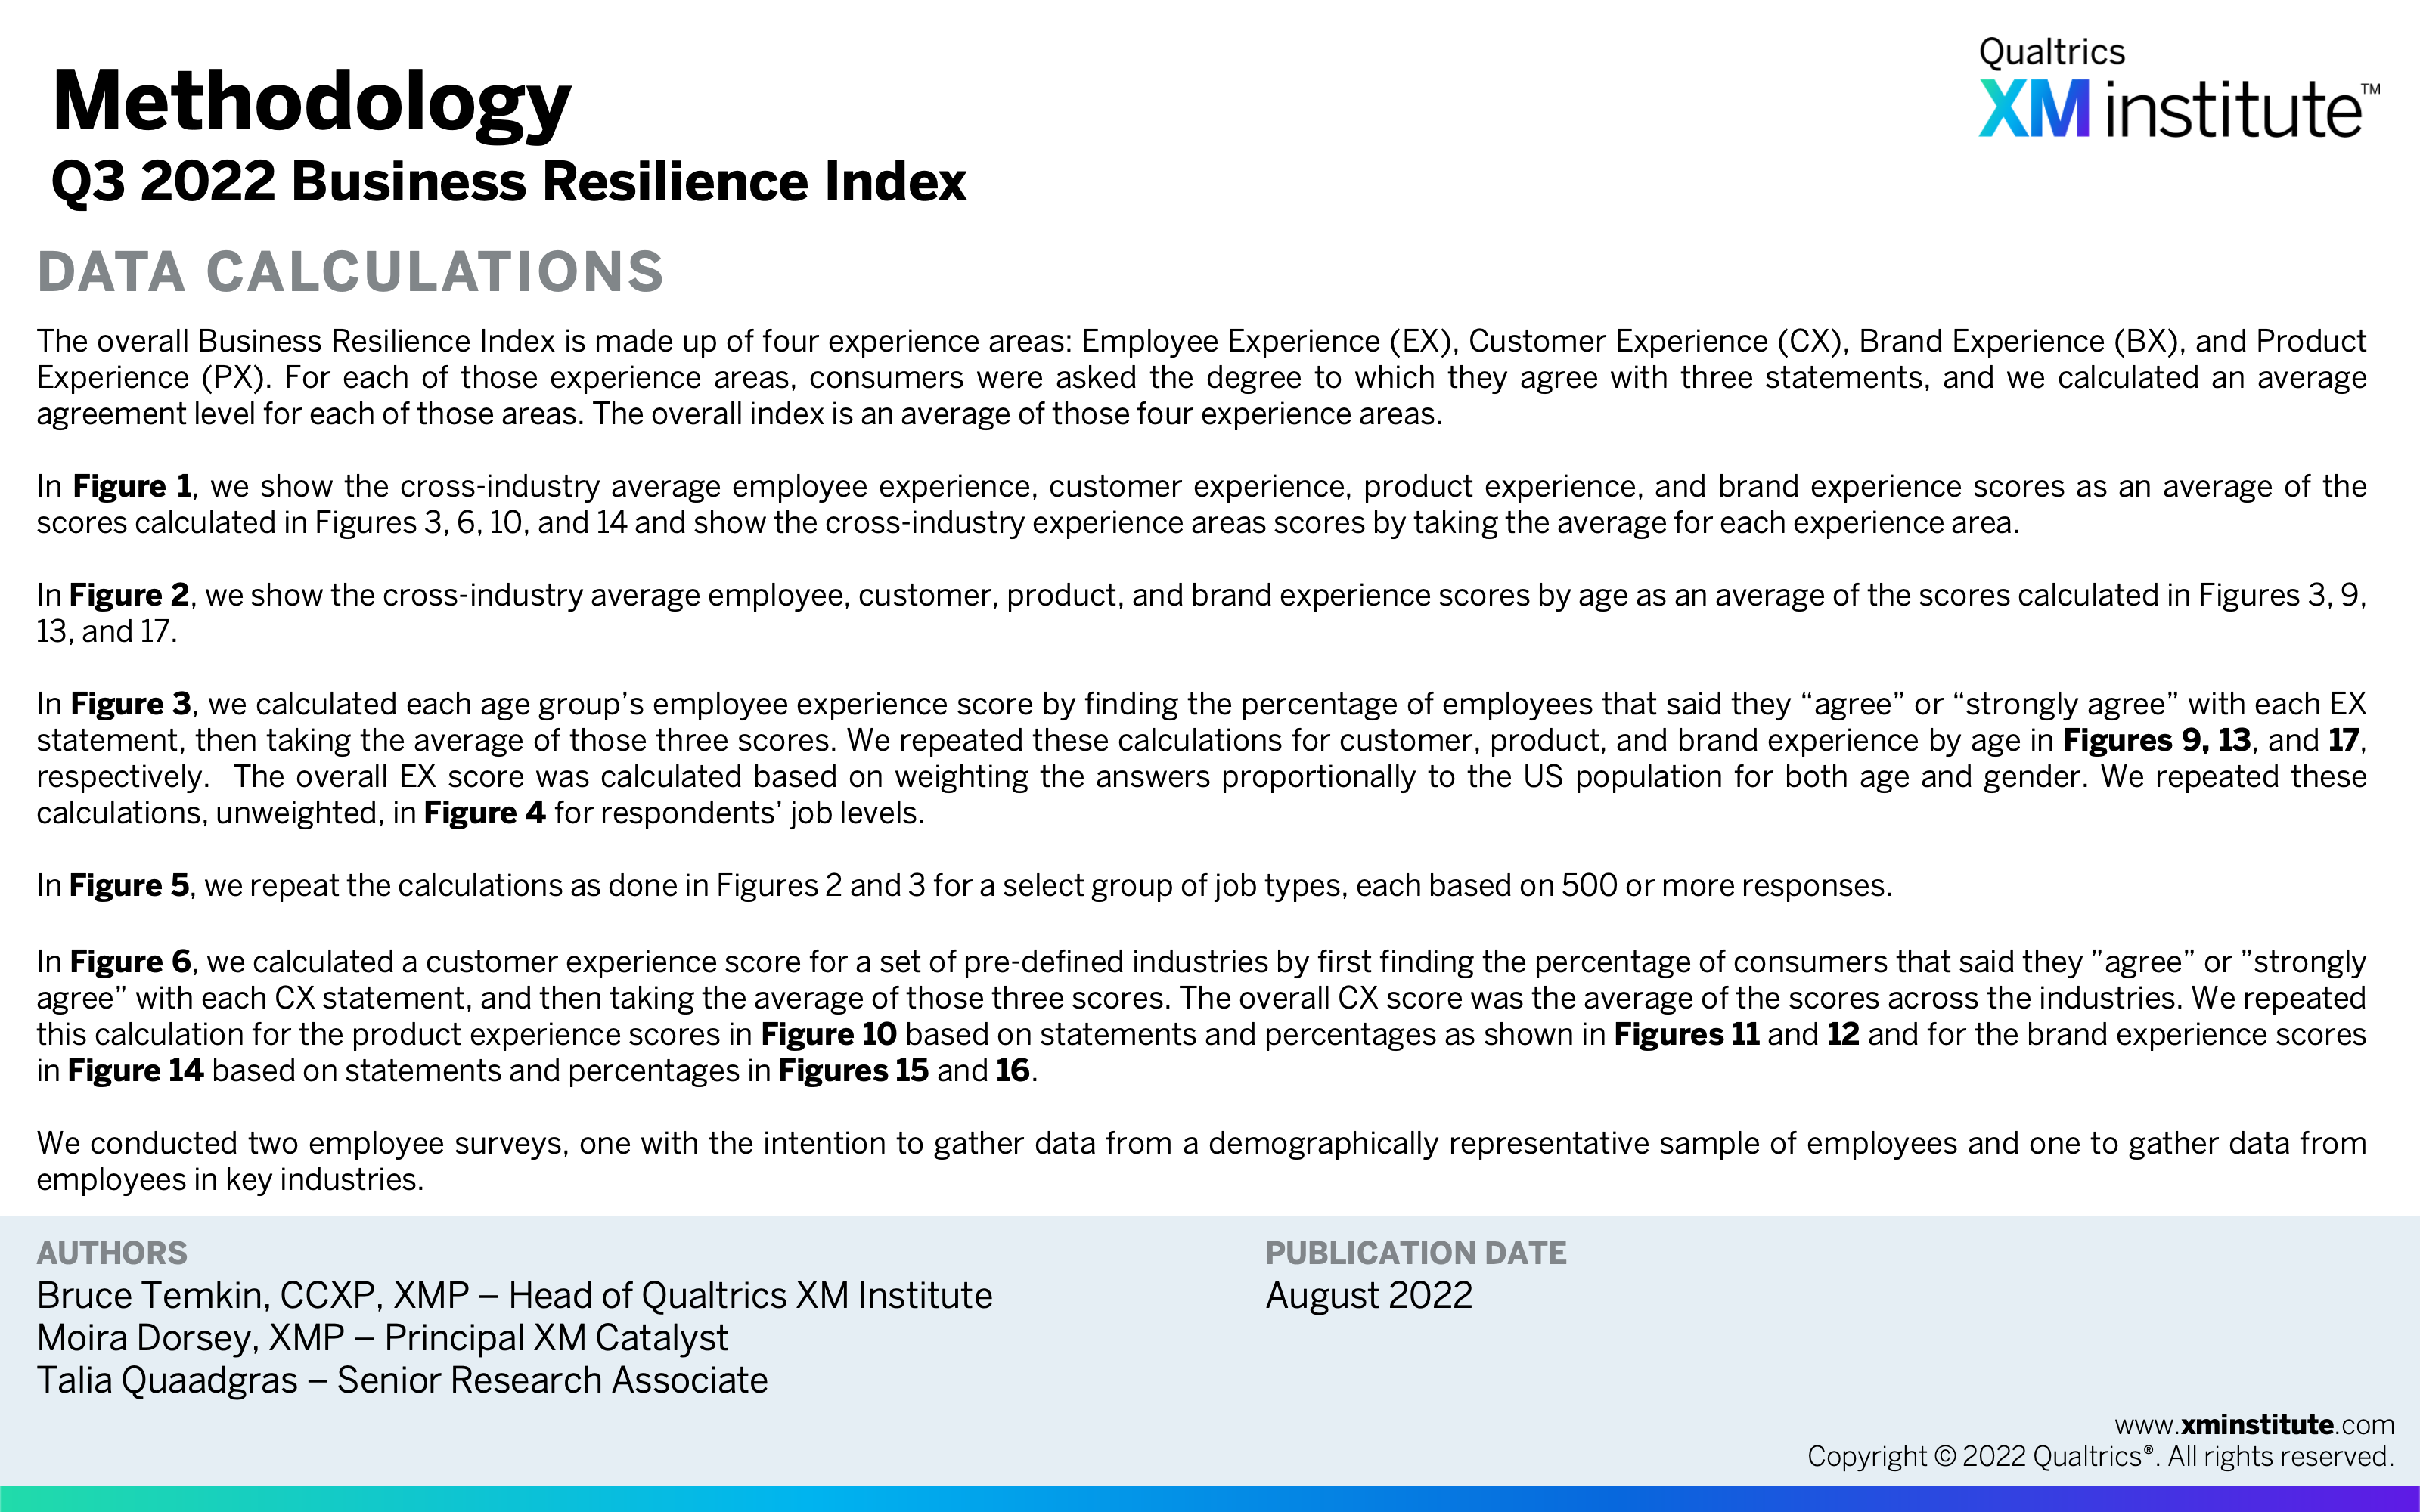
As part of our first-ever Business Resilience Index, US consumers shared their thoughts on 20 industries’ customer, product, and brand experiences, and US employees evaluated their experience with their current place of employment. Respondents evaluated three statements for each experience area, and we calculated a composite score for each experience area based on their answers. From our analysis, we found that:
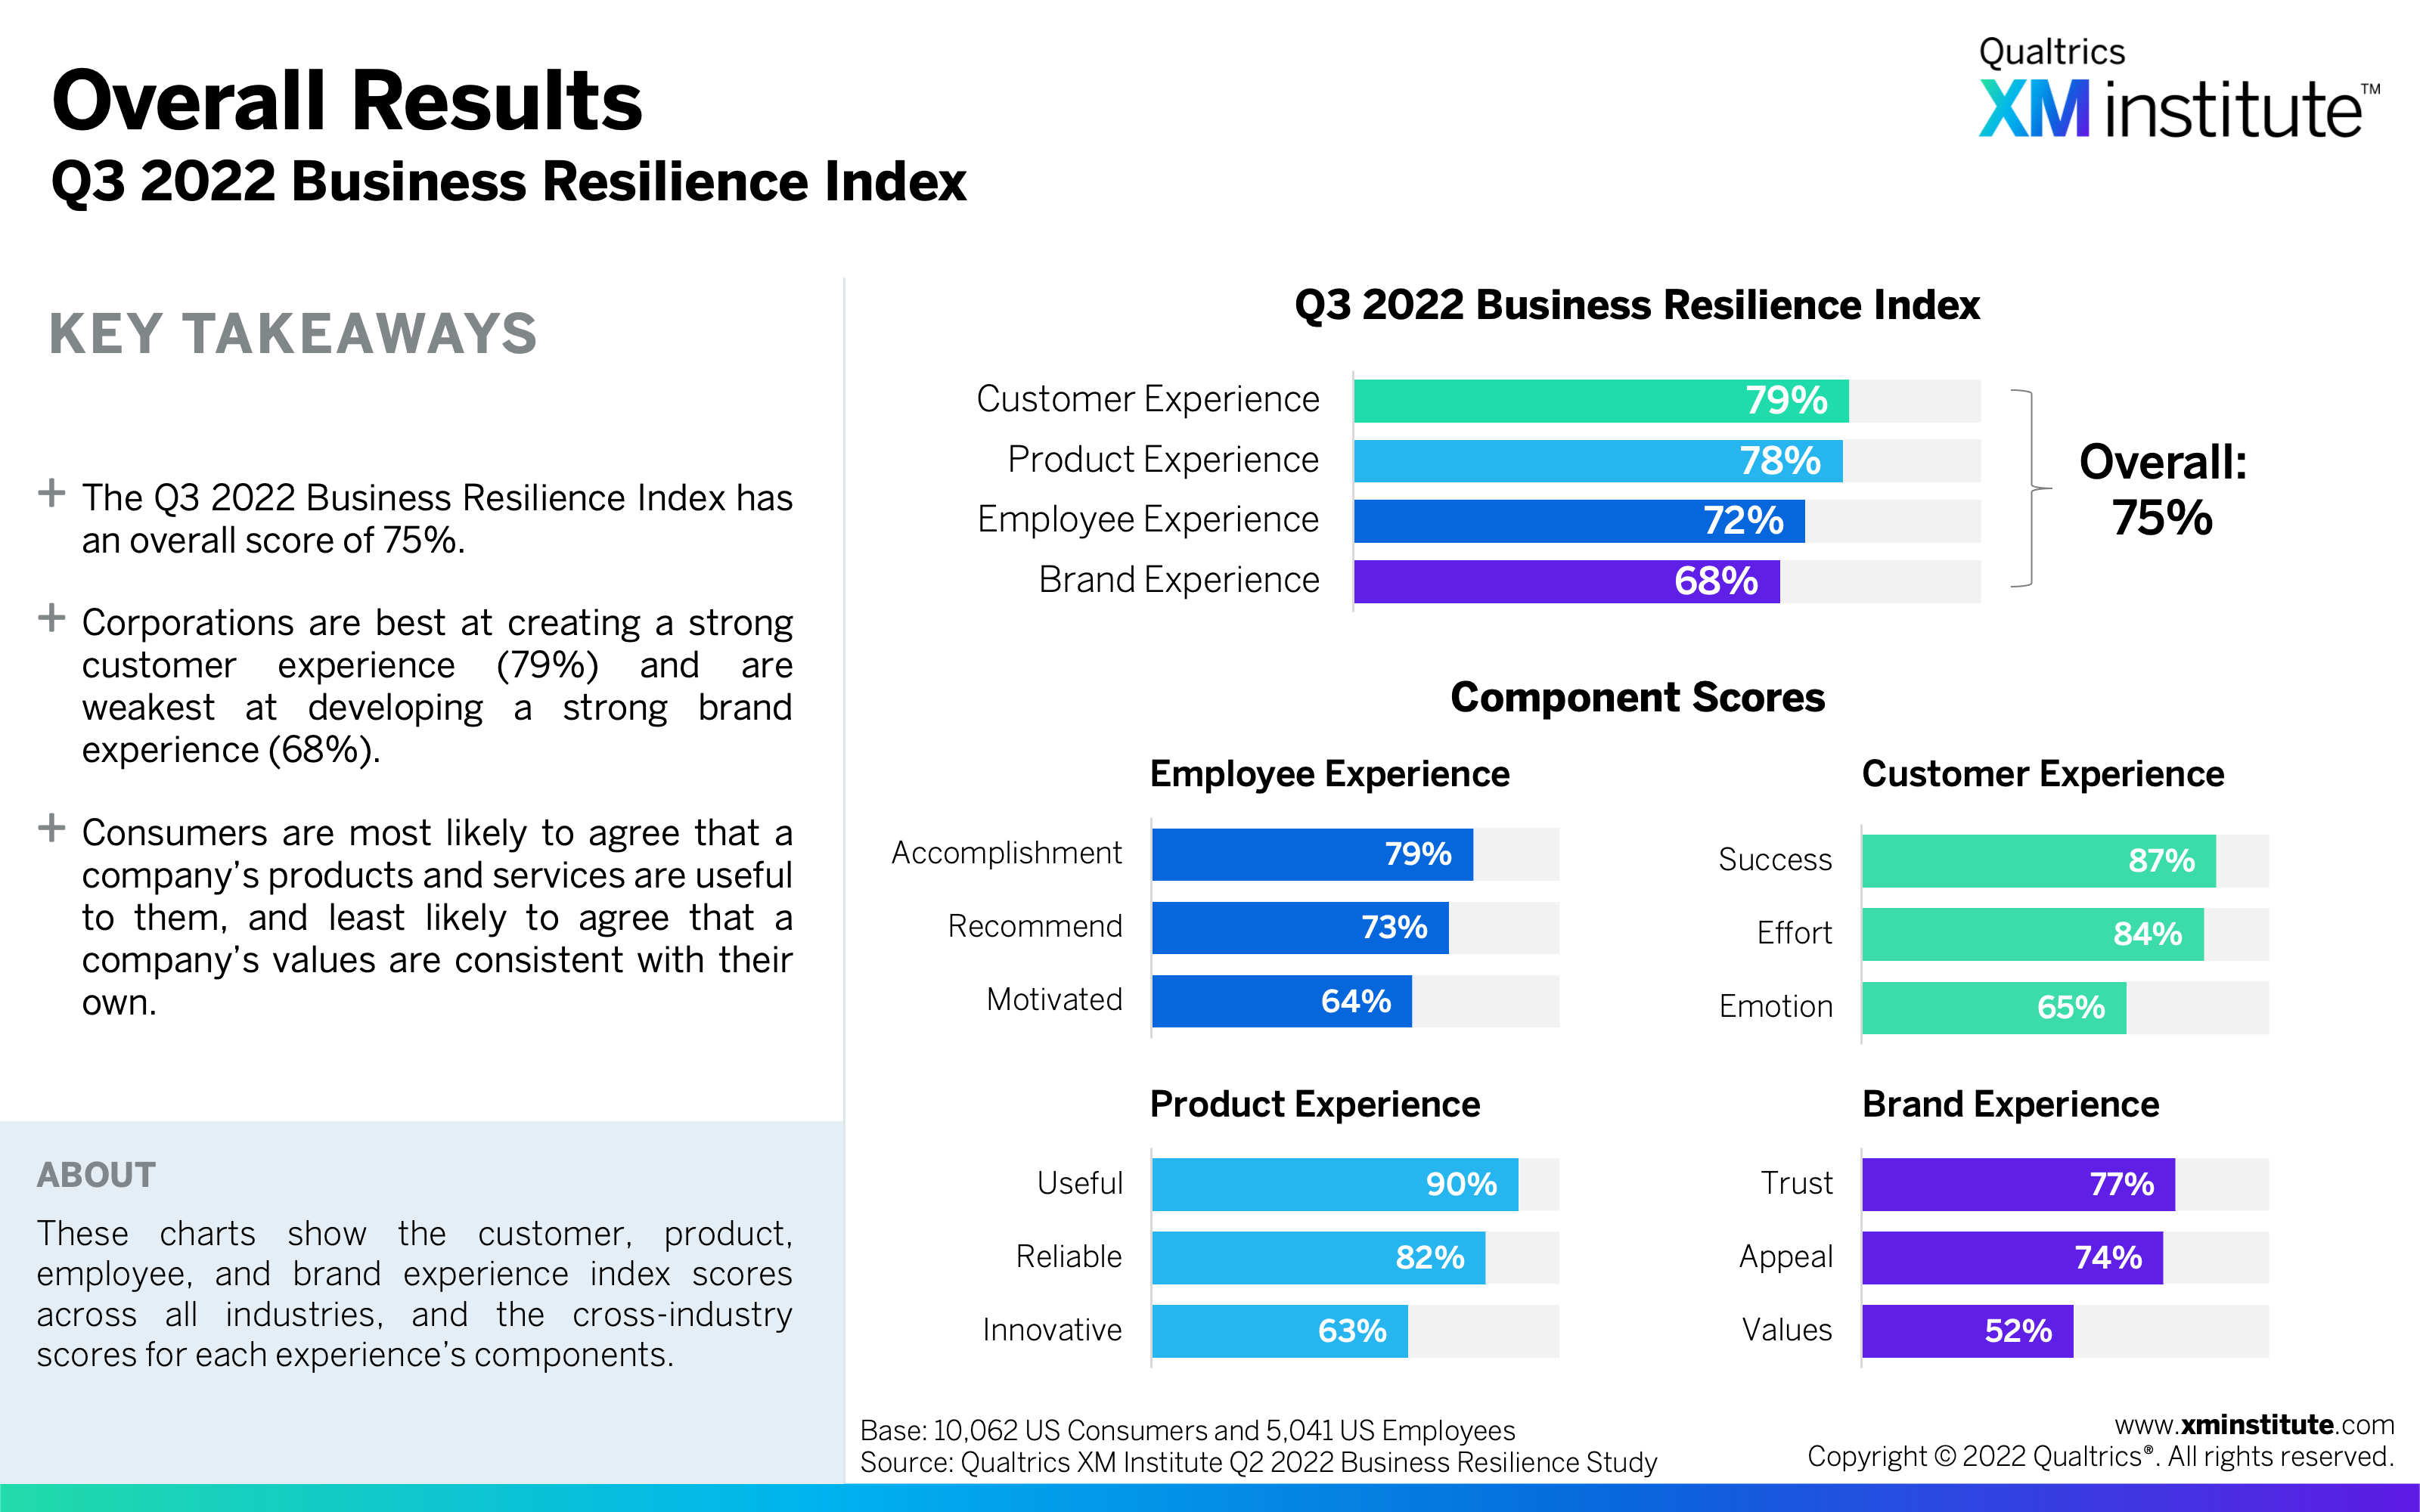
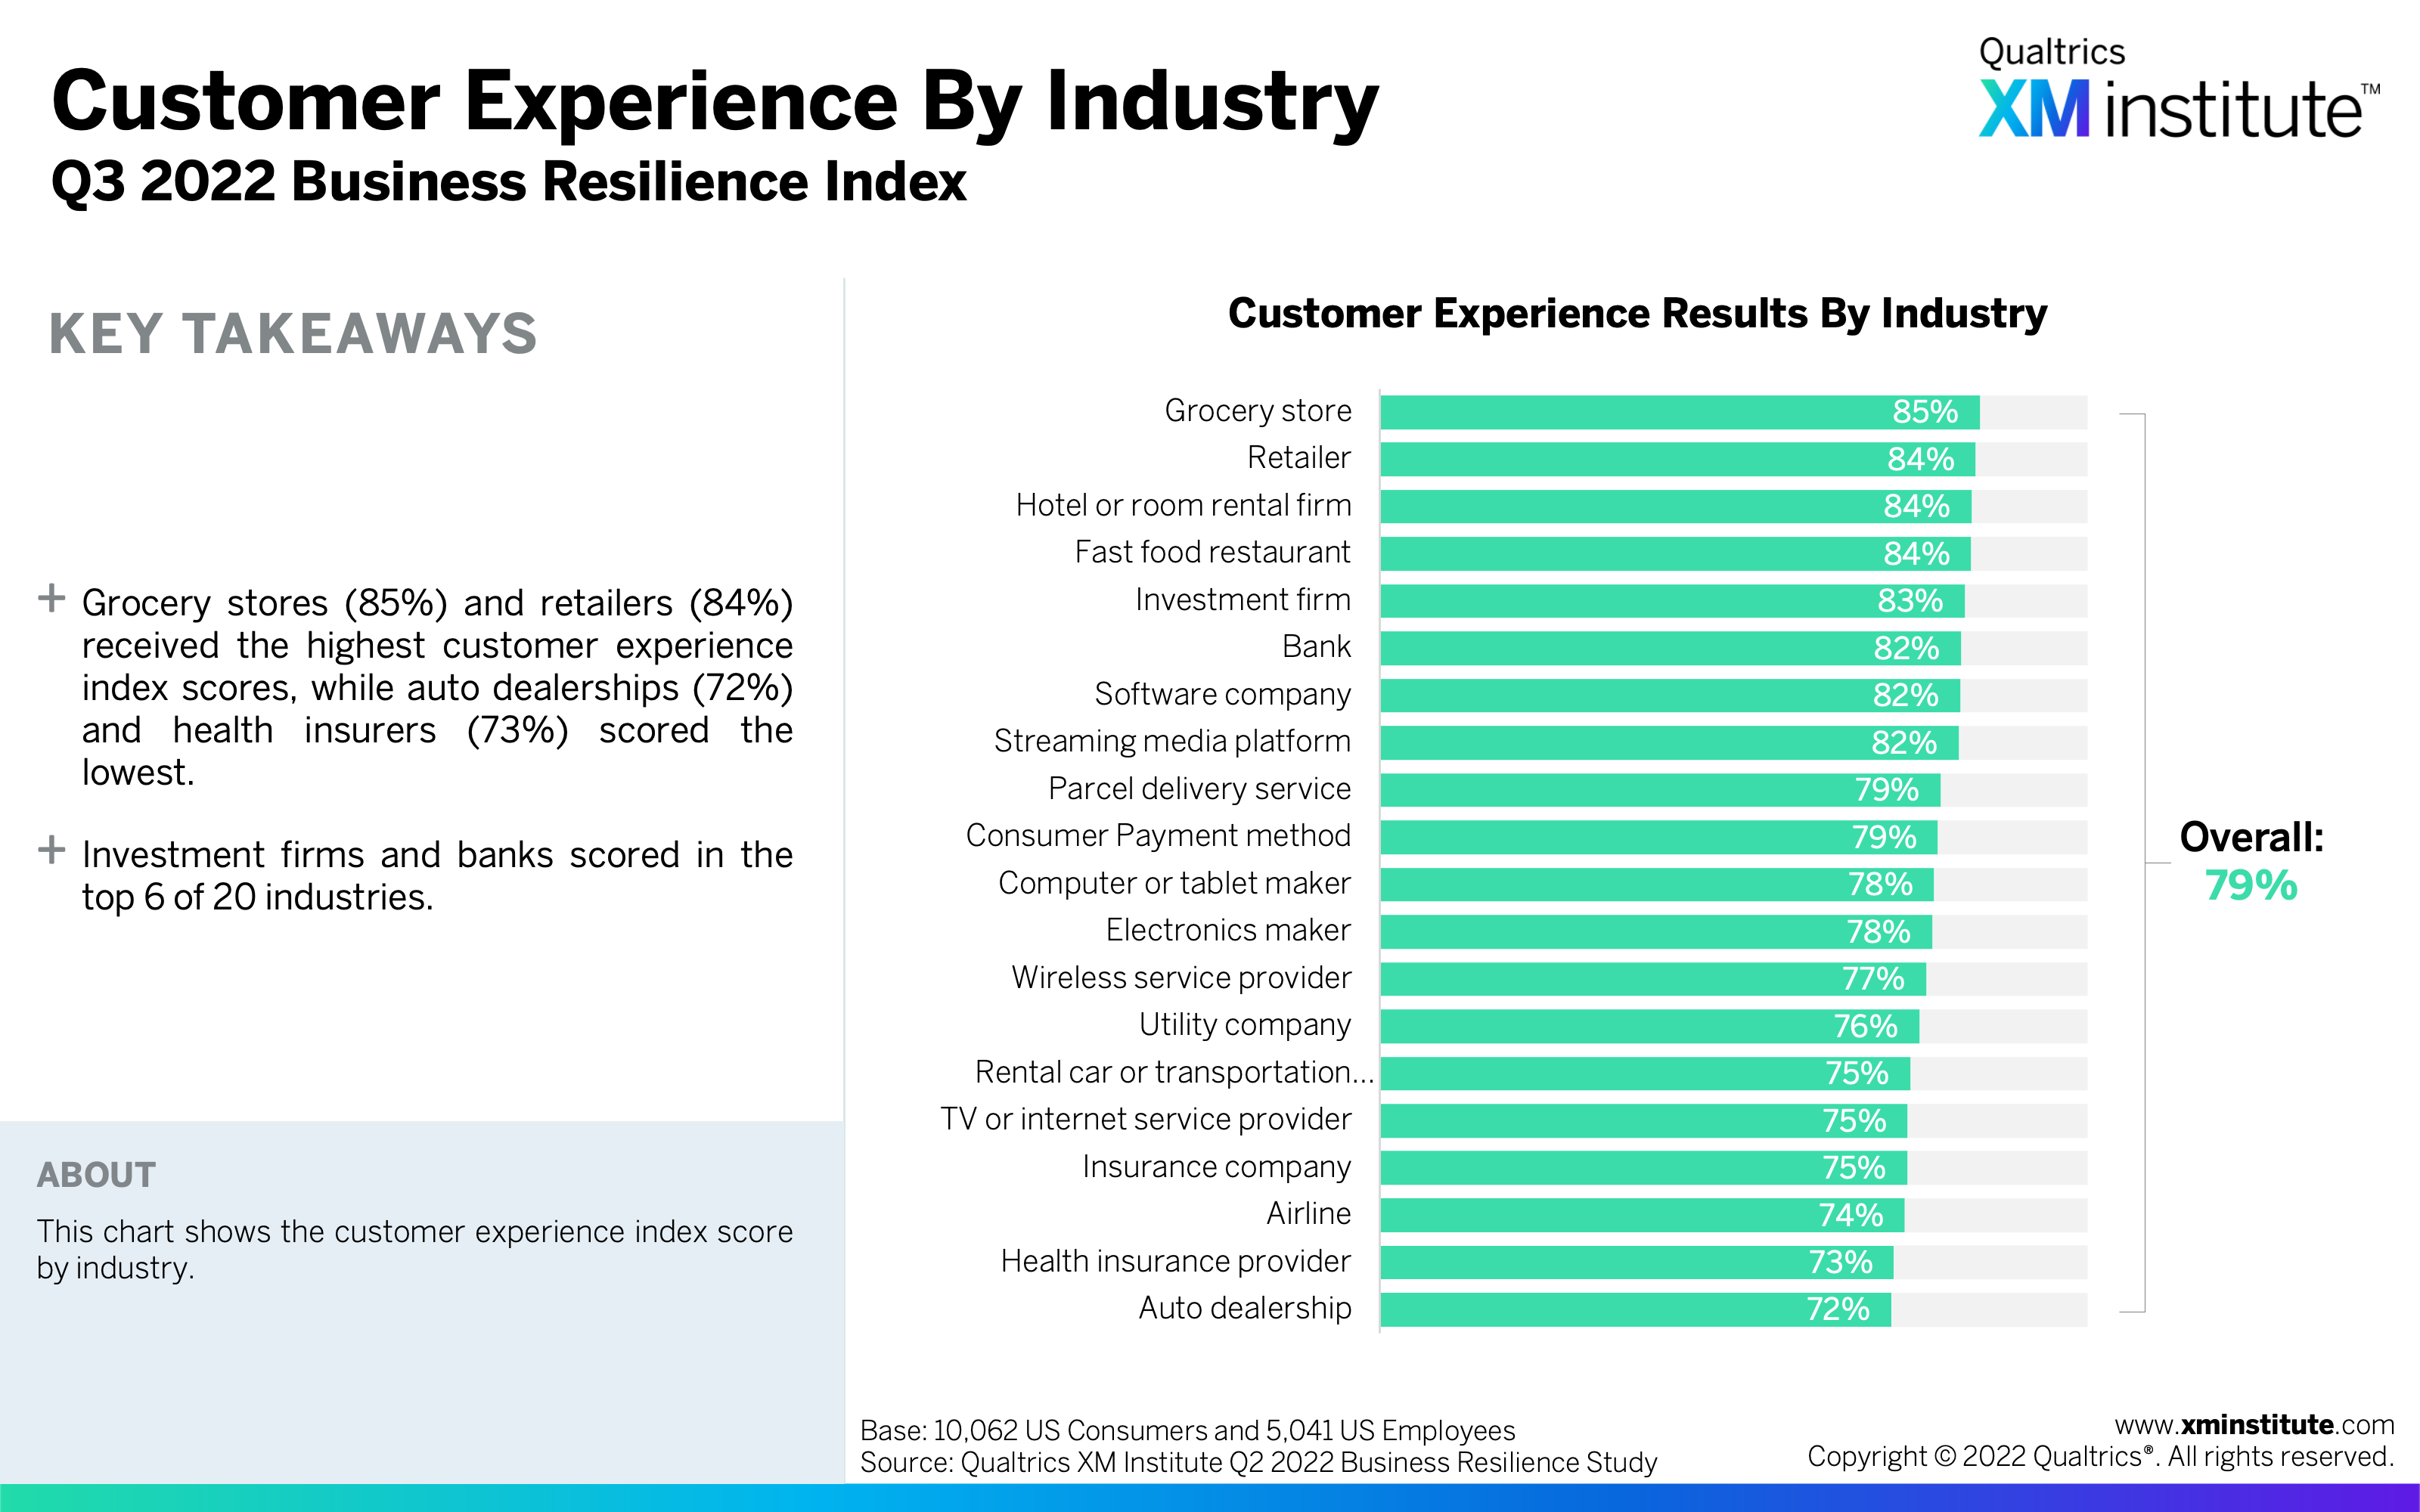
- Organizations are best at creating a strong customer experience. Of the four experience areas, respondents rated their customer experience highest, with an overall score across industries of 79%. Across all industries, organizations’ brand experience was the lowest, with an overall score of 68%.
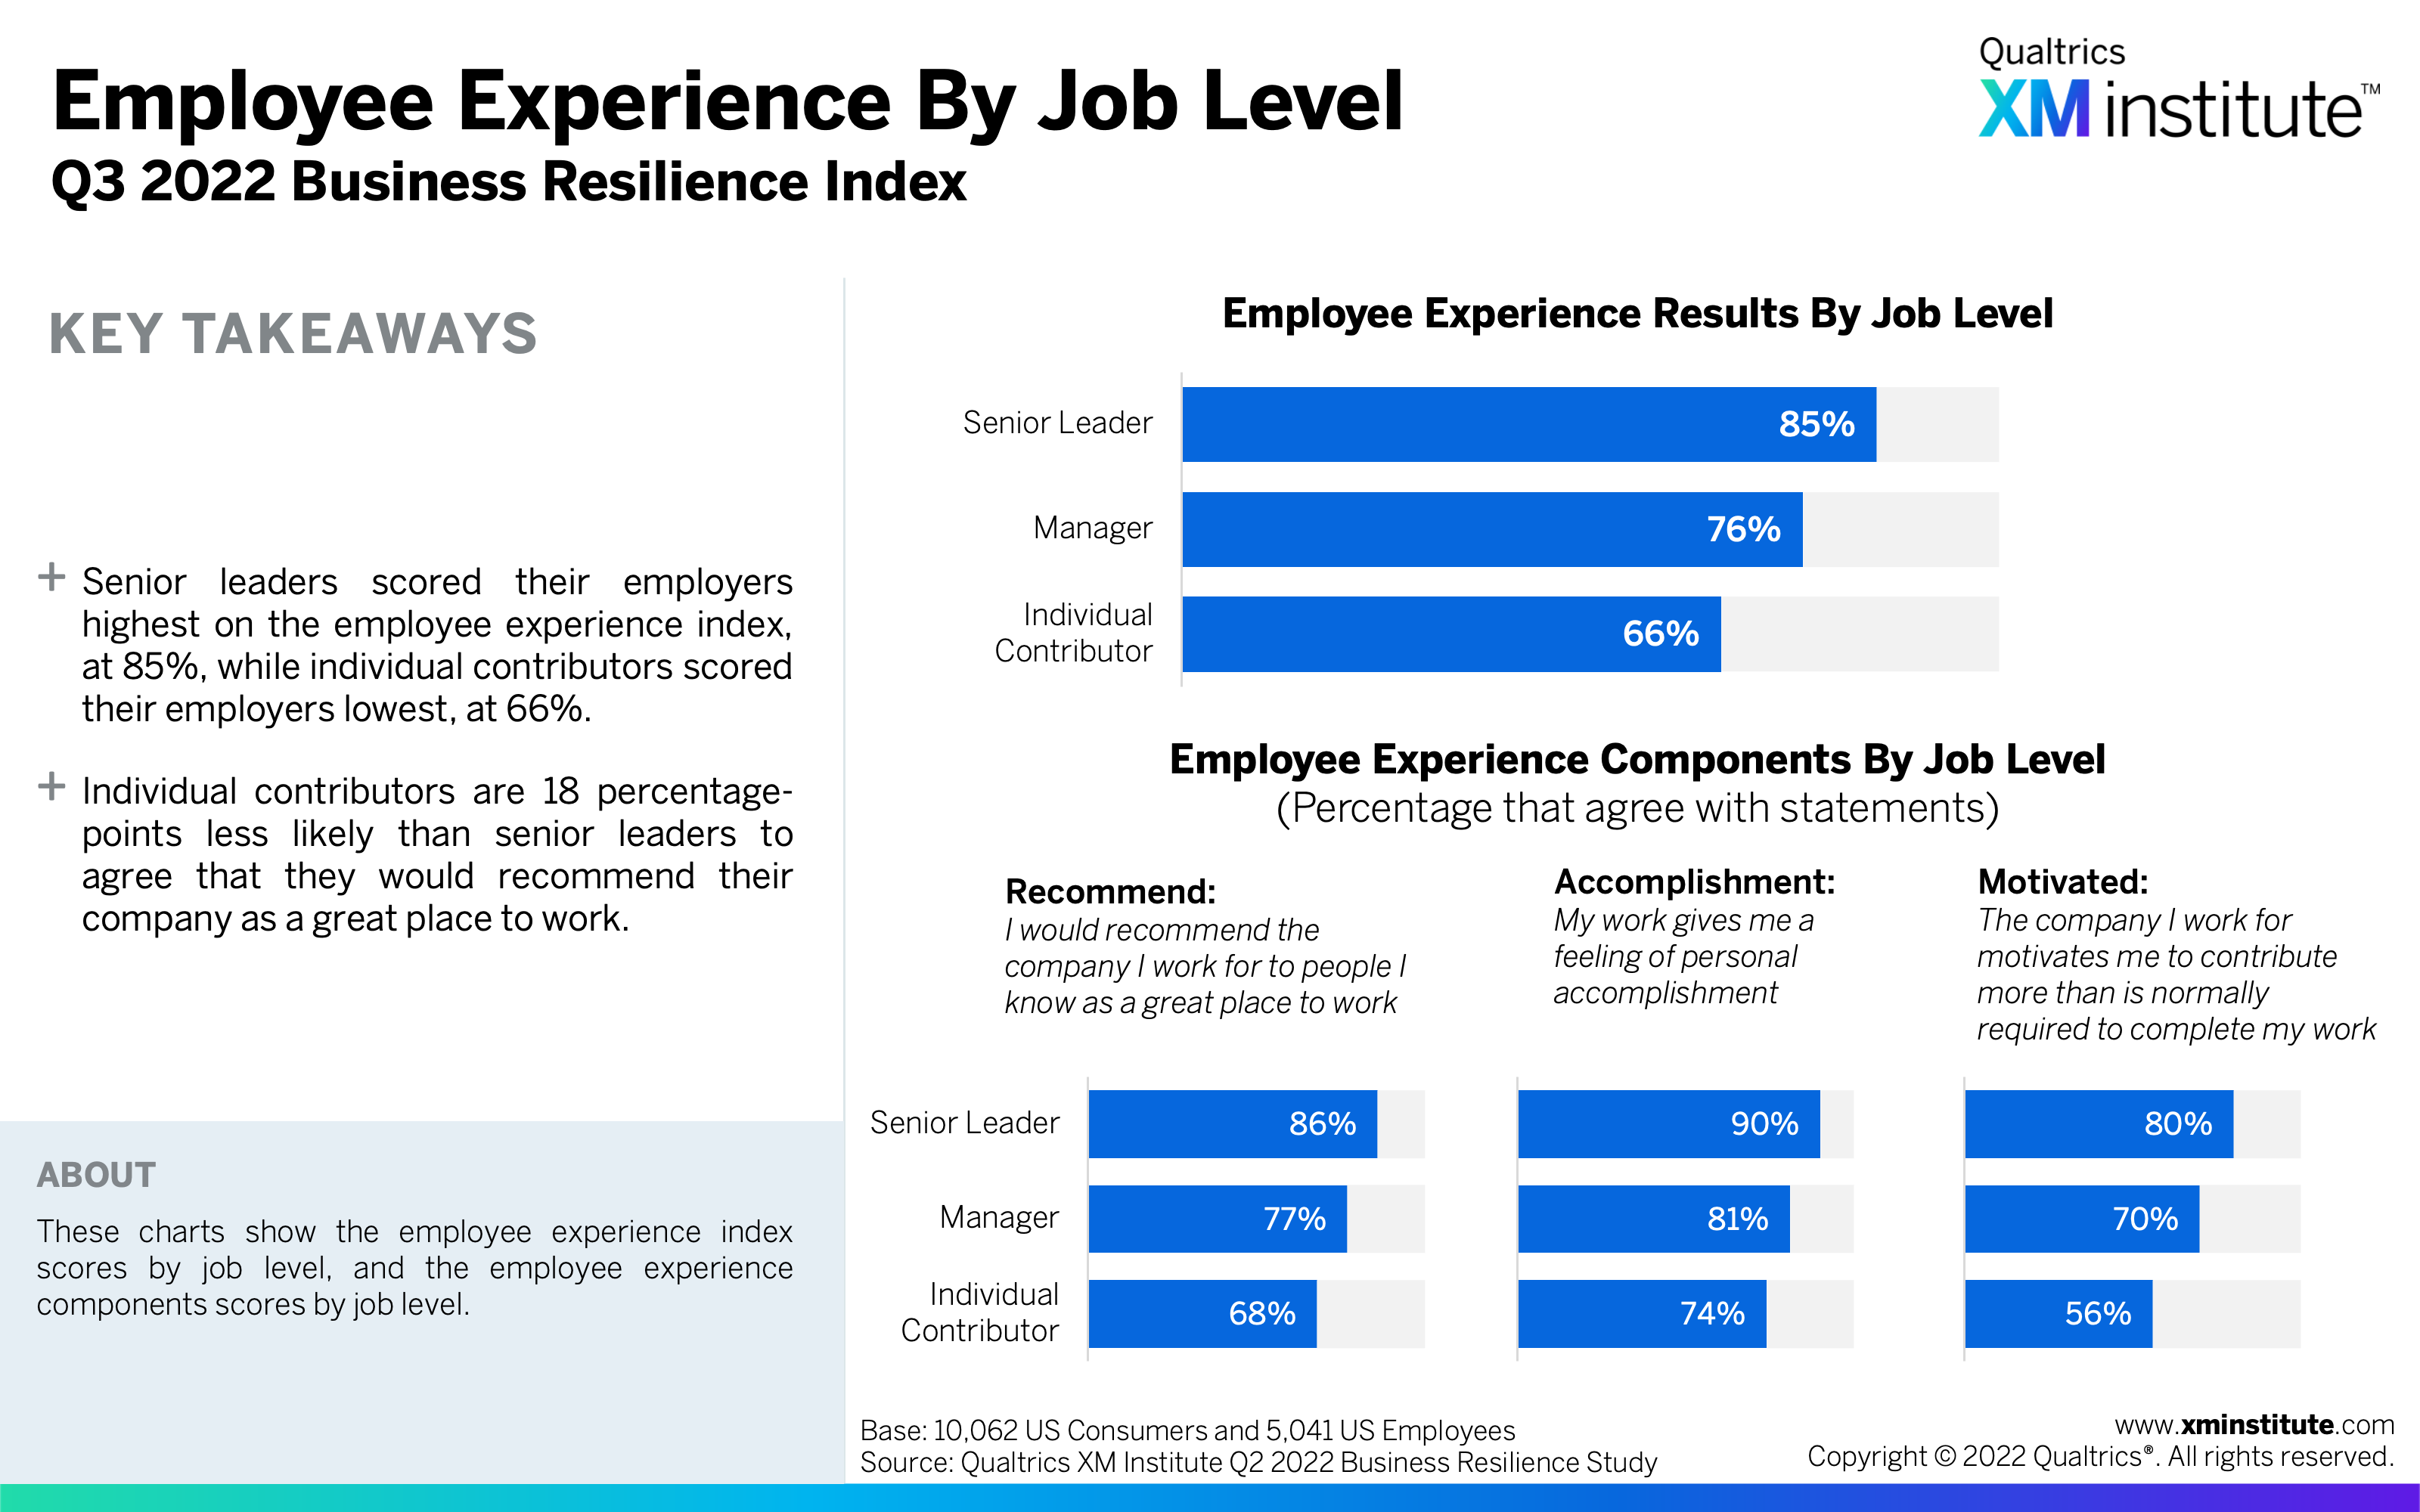
- Senior leaders report a better employee experience than managers and individual contributors. Senior leaders gave their employee experience an overall score of 85%, higher than both managers (76%) and individual contributors (66%), and 13 percentage-points higher than the overall score of 72%.
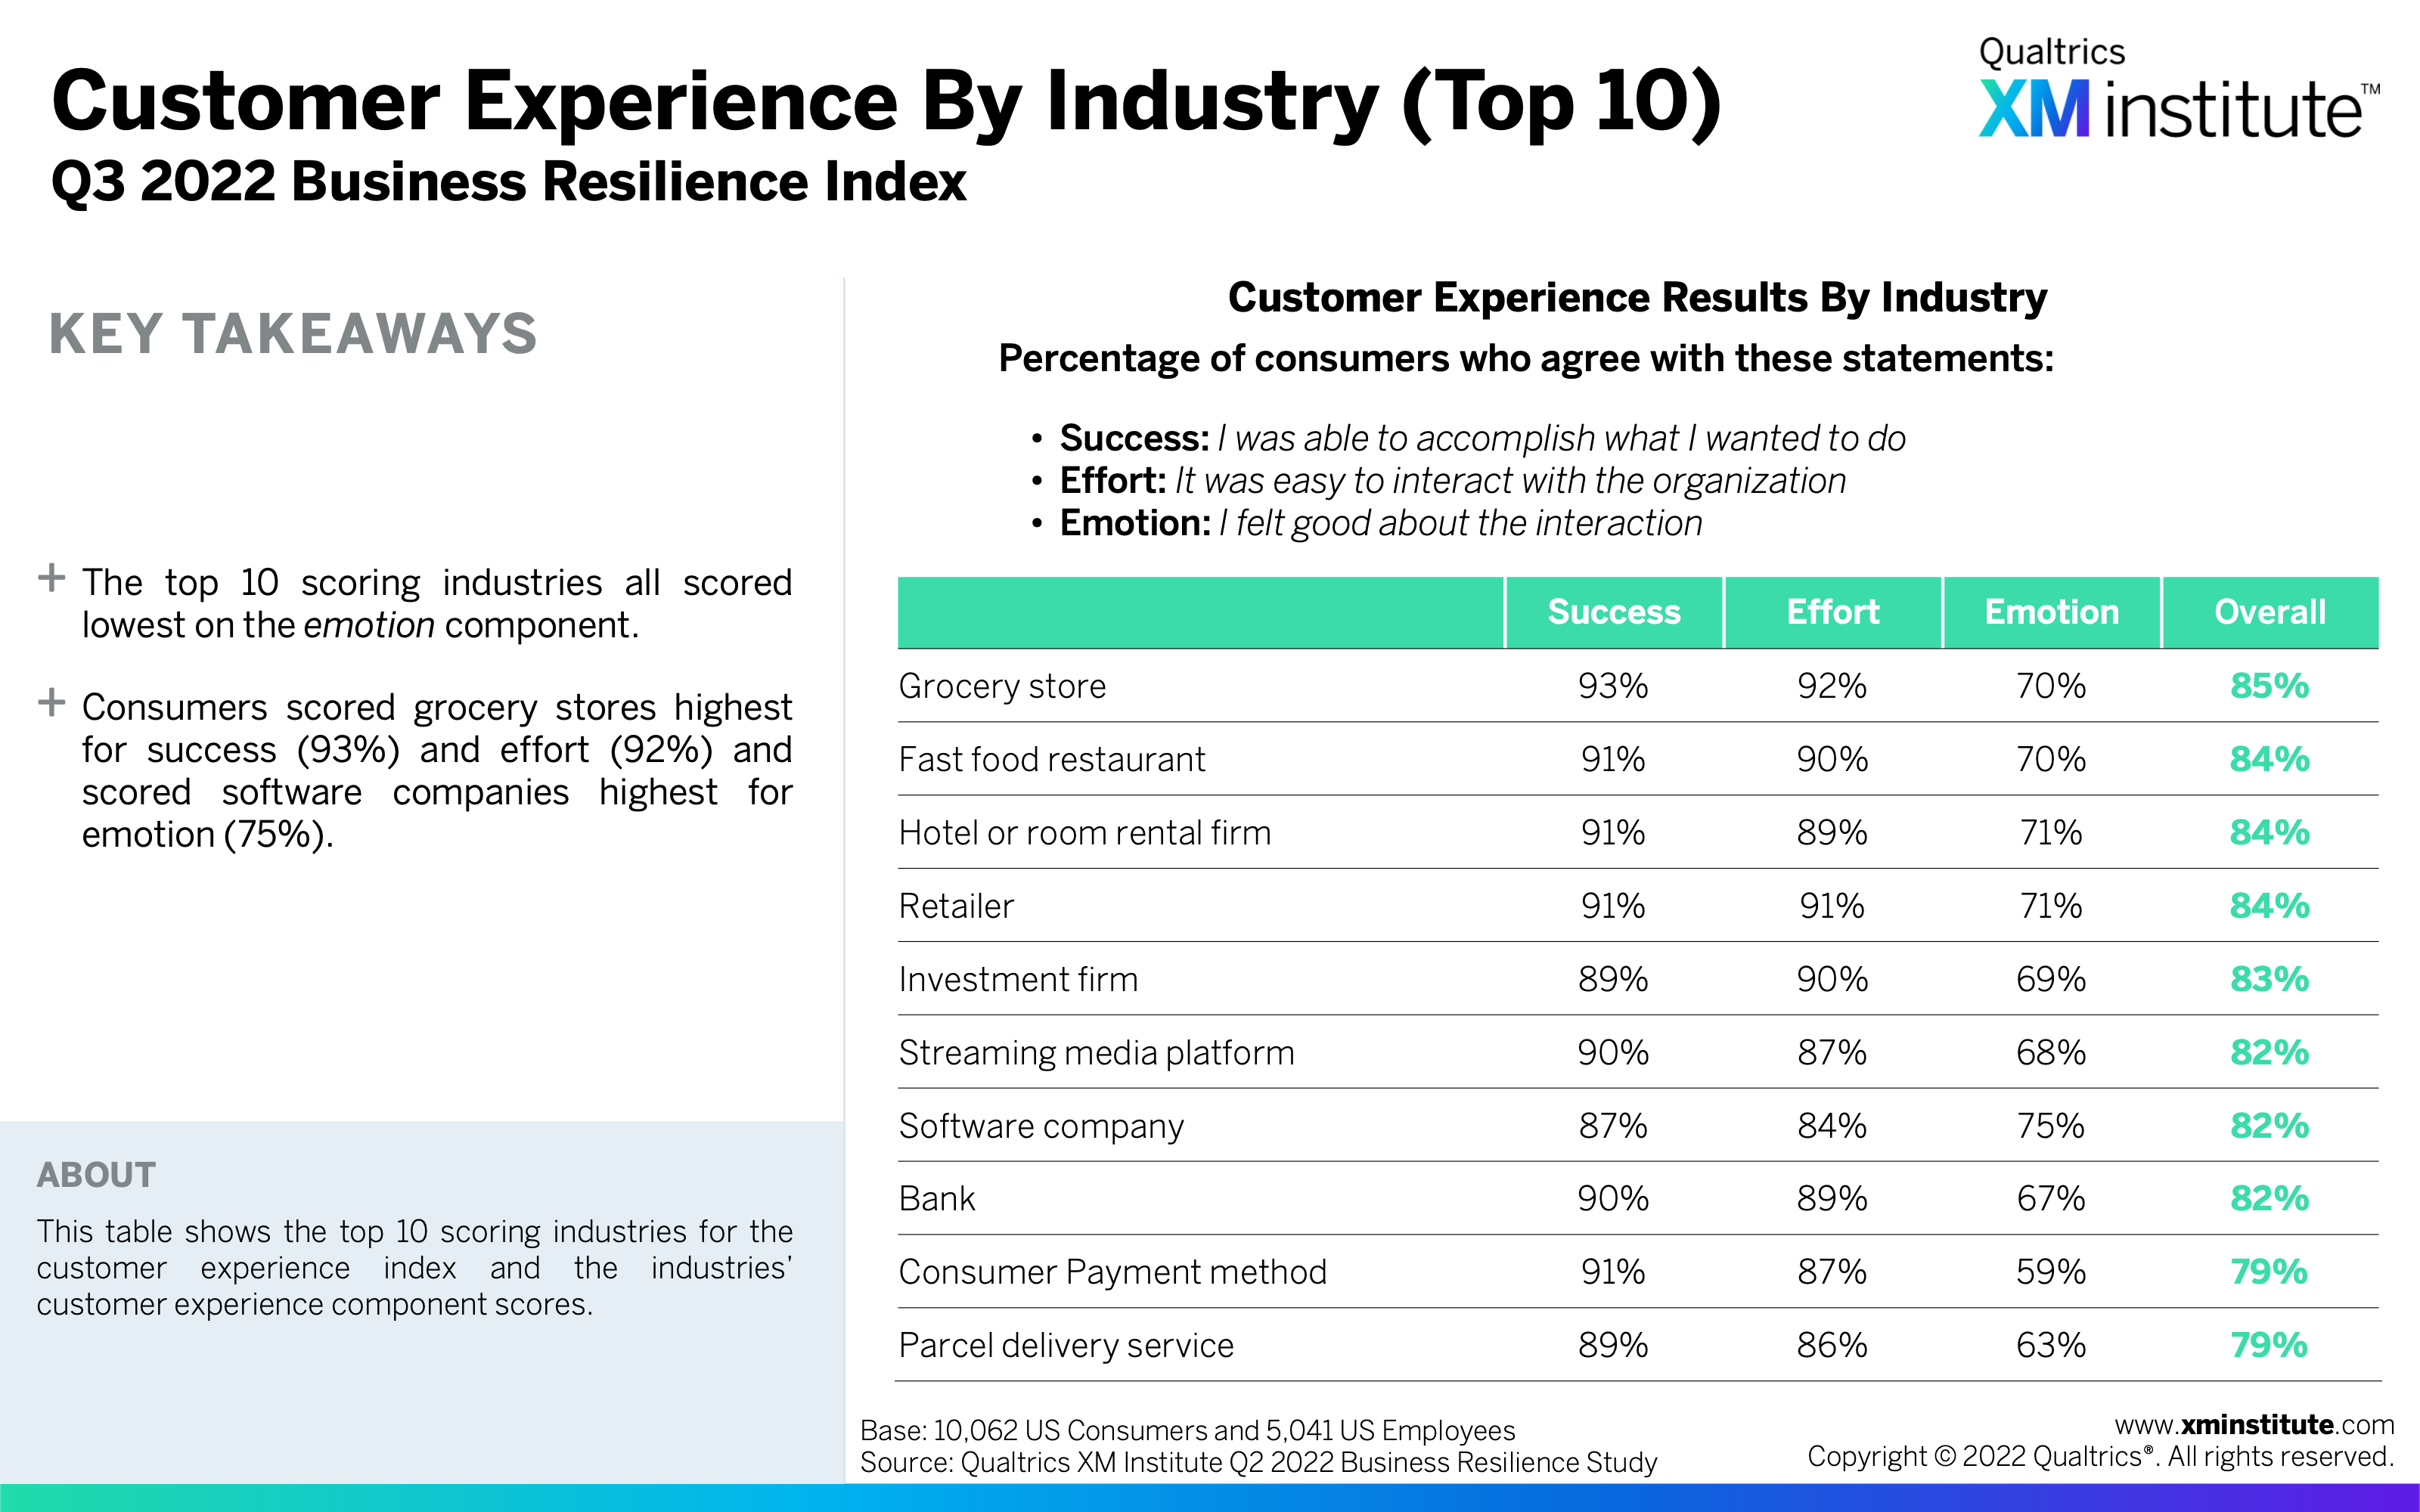
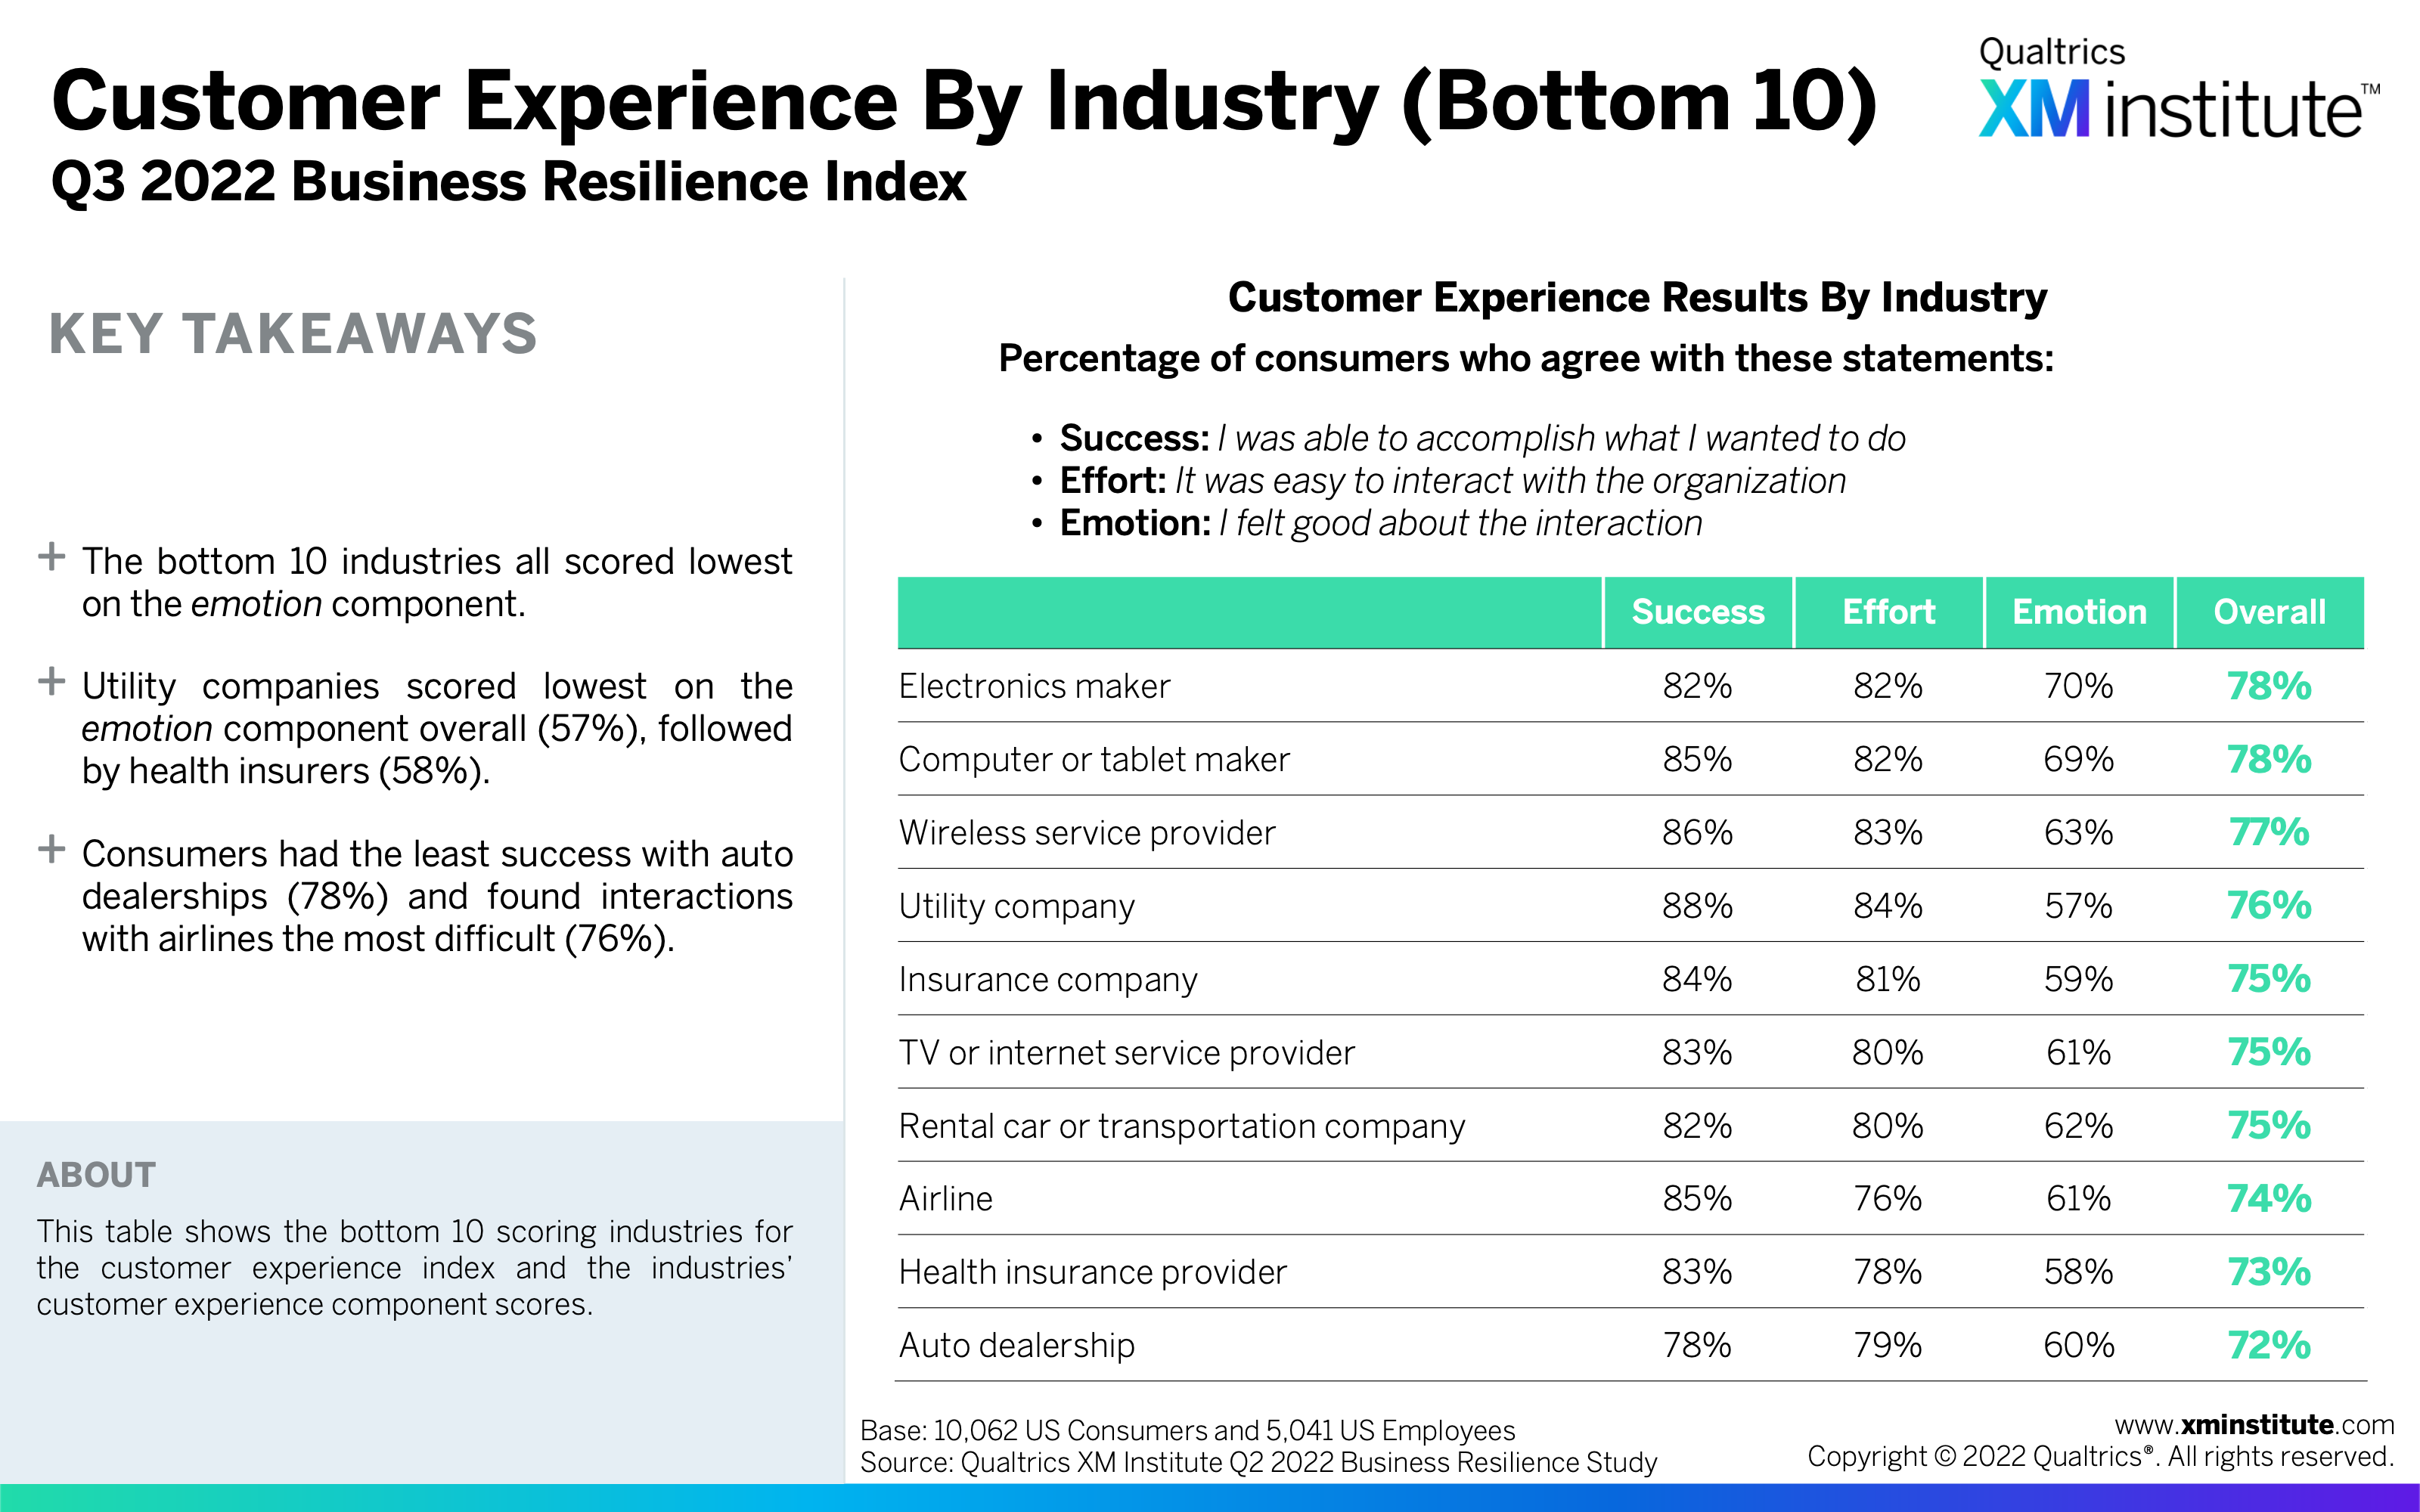
- Grocery stores provided the best customer experience. Consumers gave grocery stores a customer experience score of 85% and gave the lowest scores to auto dealerships (72%) and health insurance providers (73%).
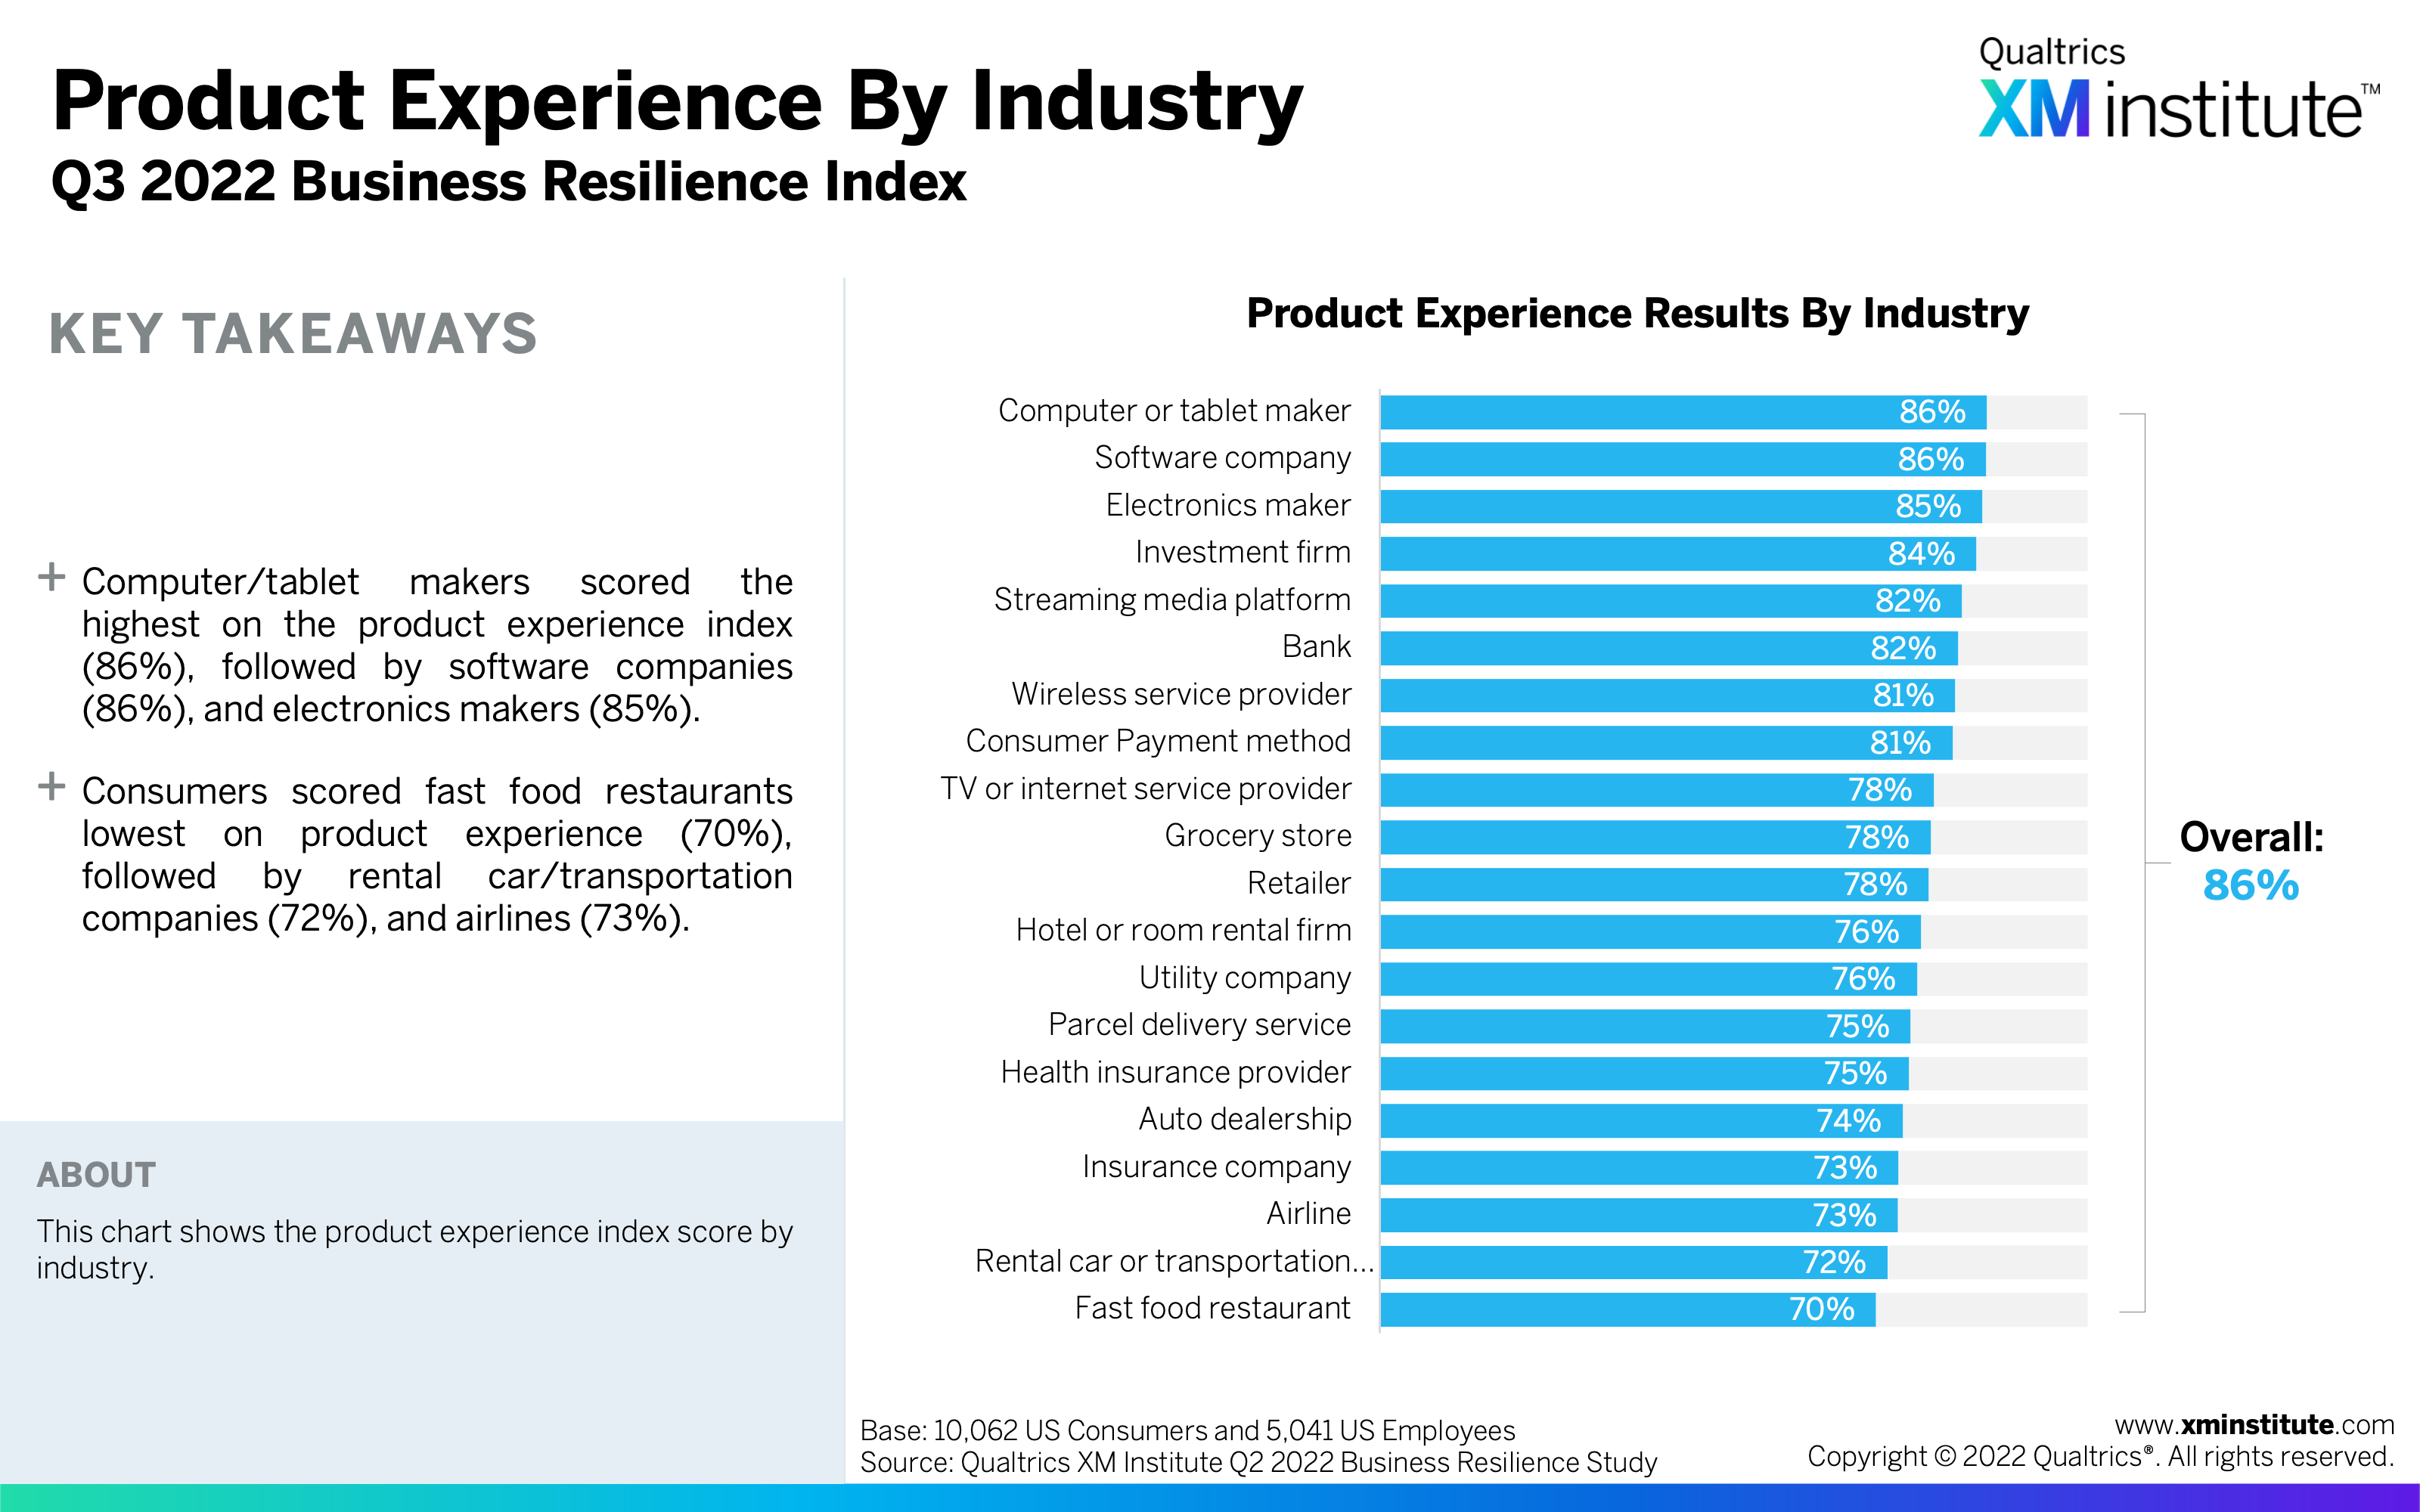
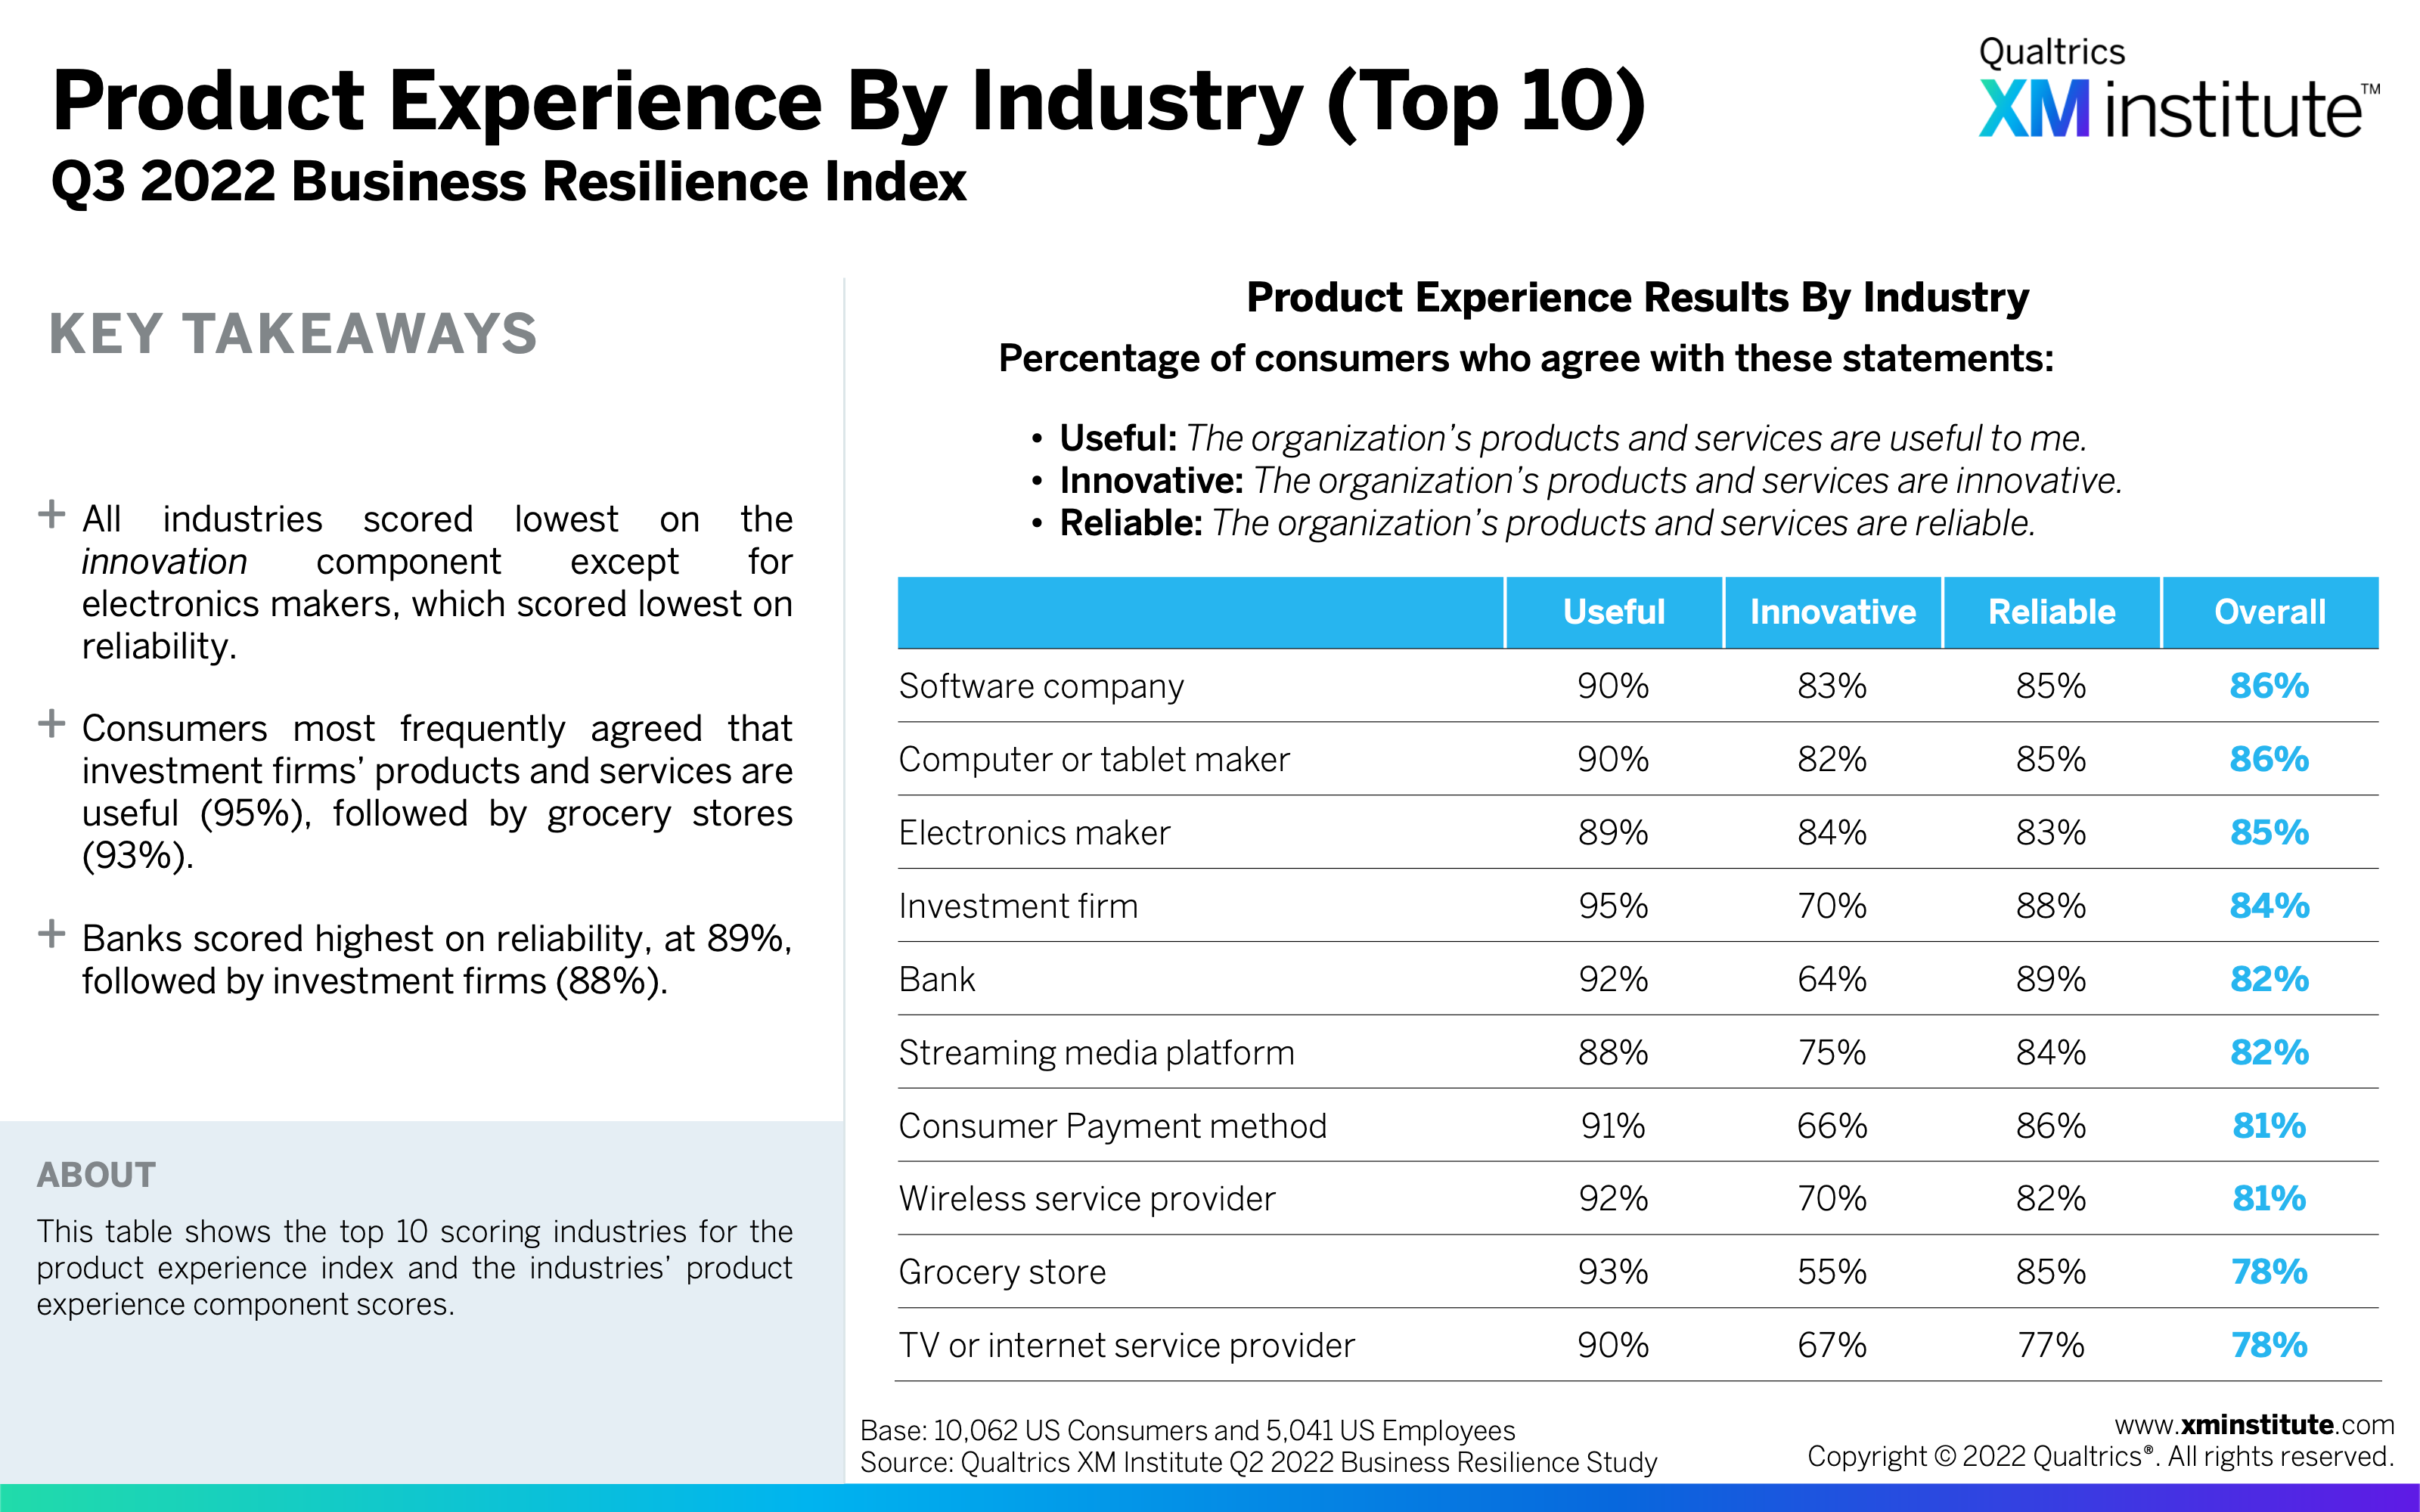
- Technology companies scored well on product experience. Computer or tablet makers (86%), software companies (86%), and electronics makers (85%) were the top three industries for product experience, propelled by their scores for the innovative component.
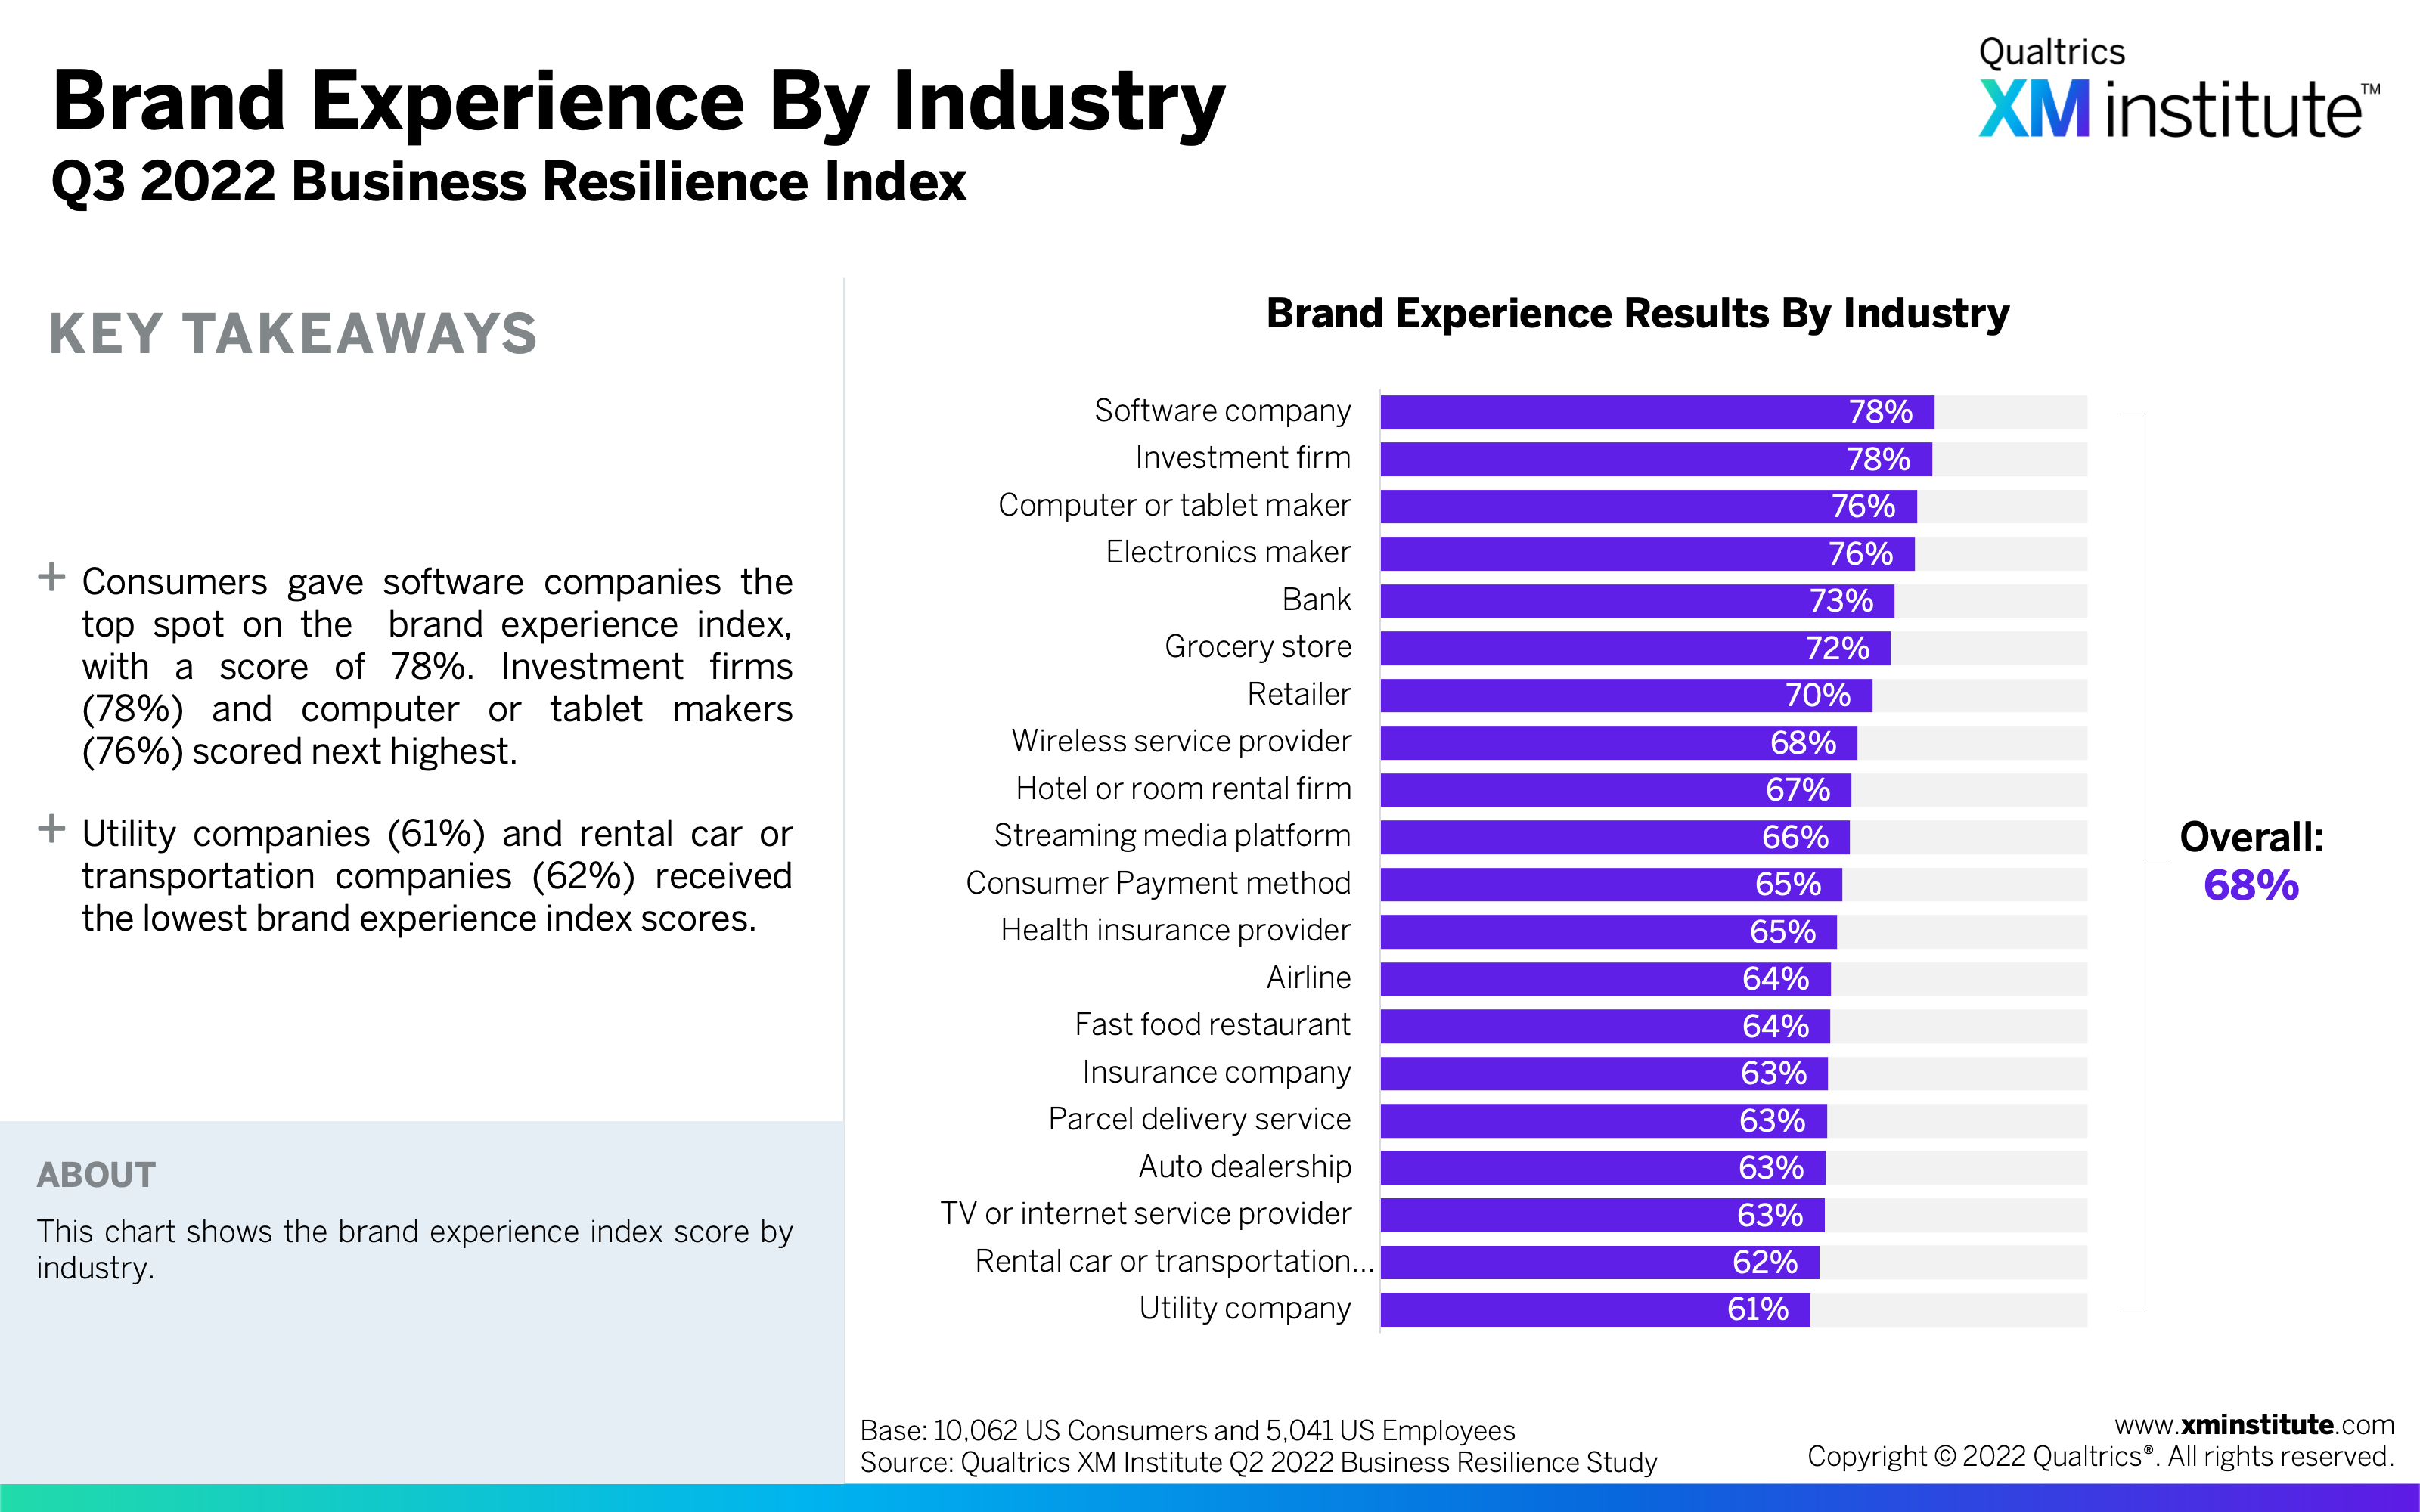
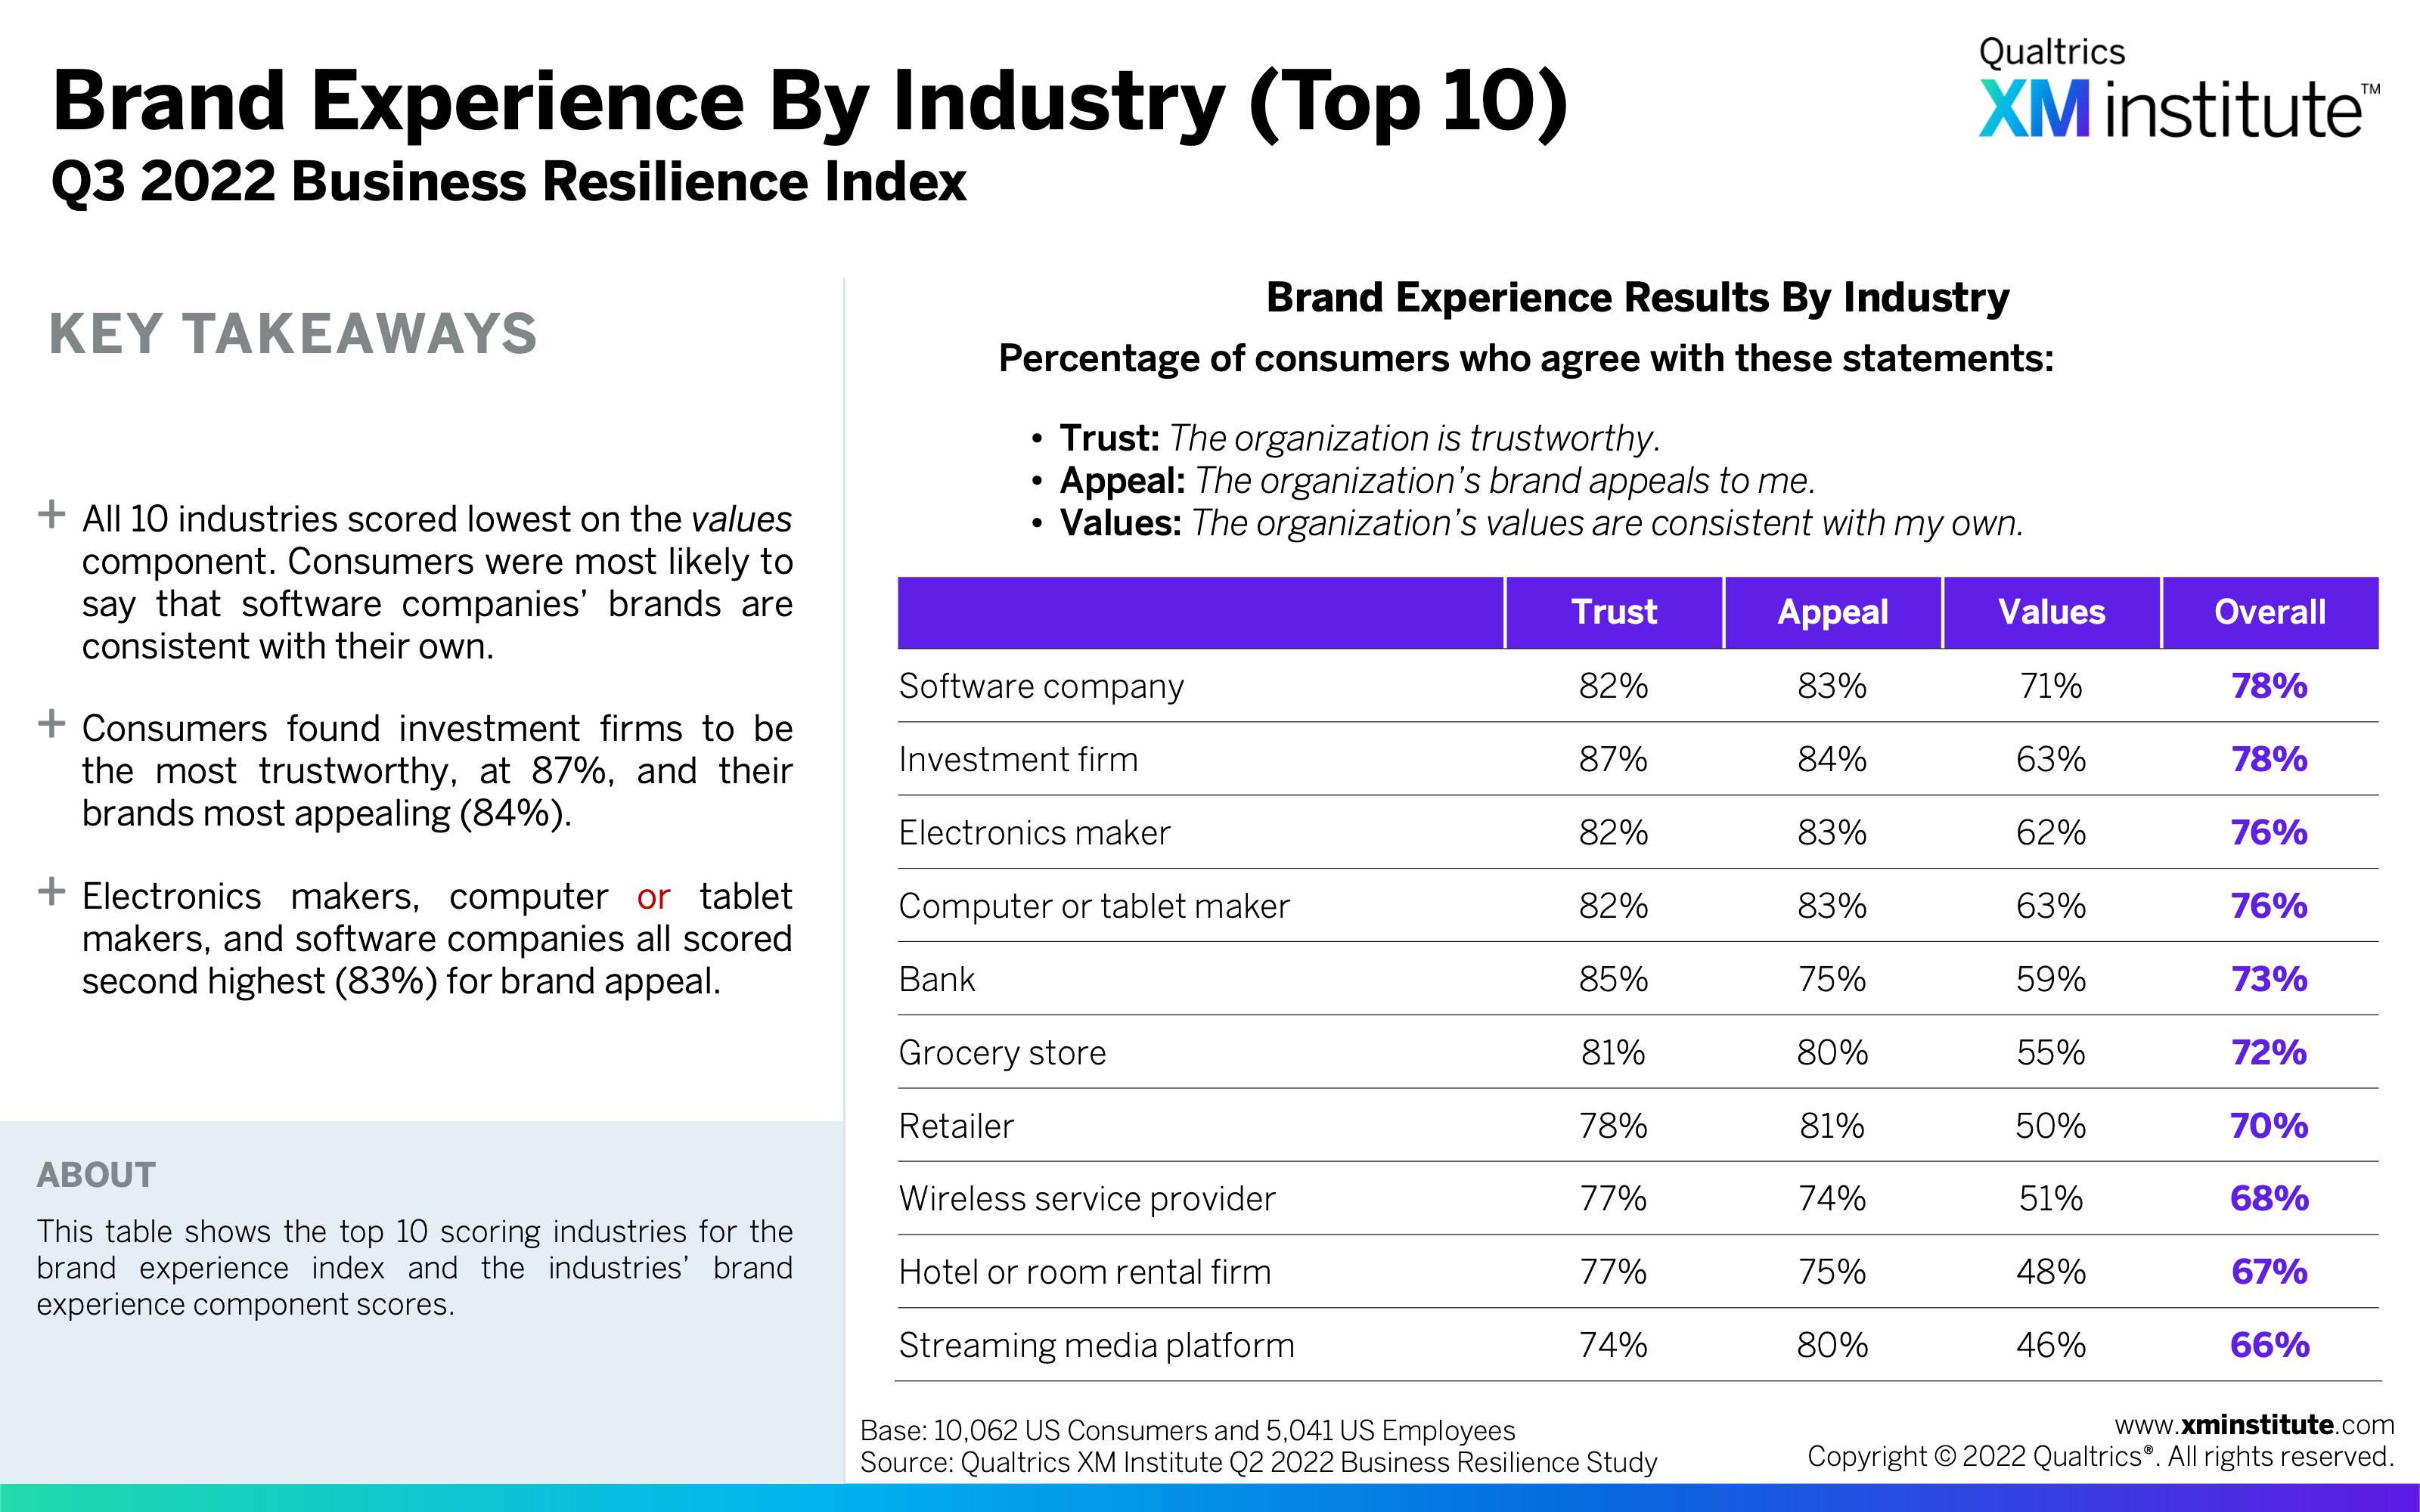
- Technology companies and financial companies earned the highest brand experience scores. Software, electronics, and computer or tablet companies led the top five industries for brand experience, along with investment firms (78%) and banks (73%). Consumers found investment firms and banks to be the most trustworthy across all 20 industries.
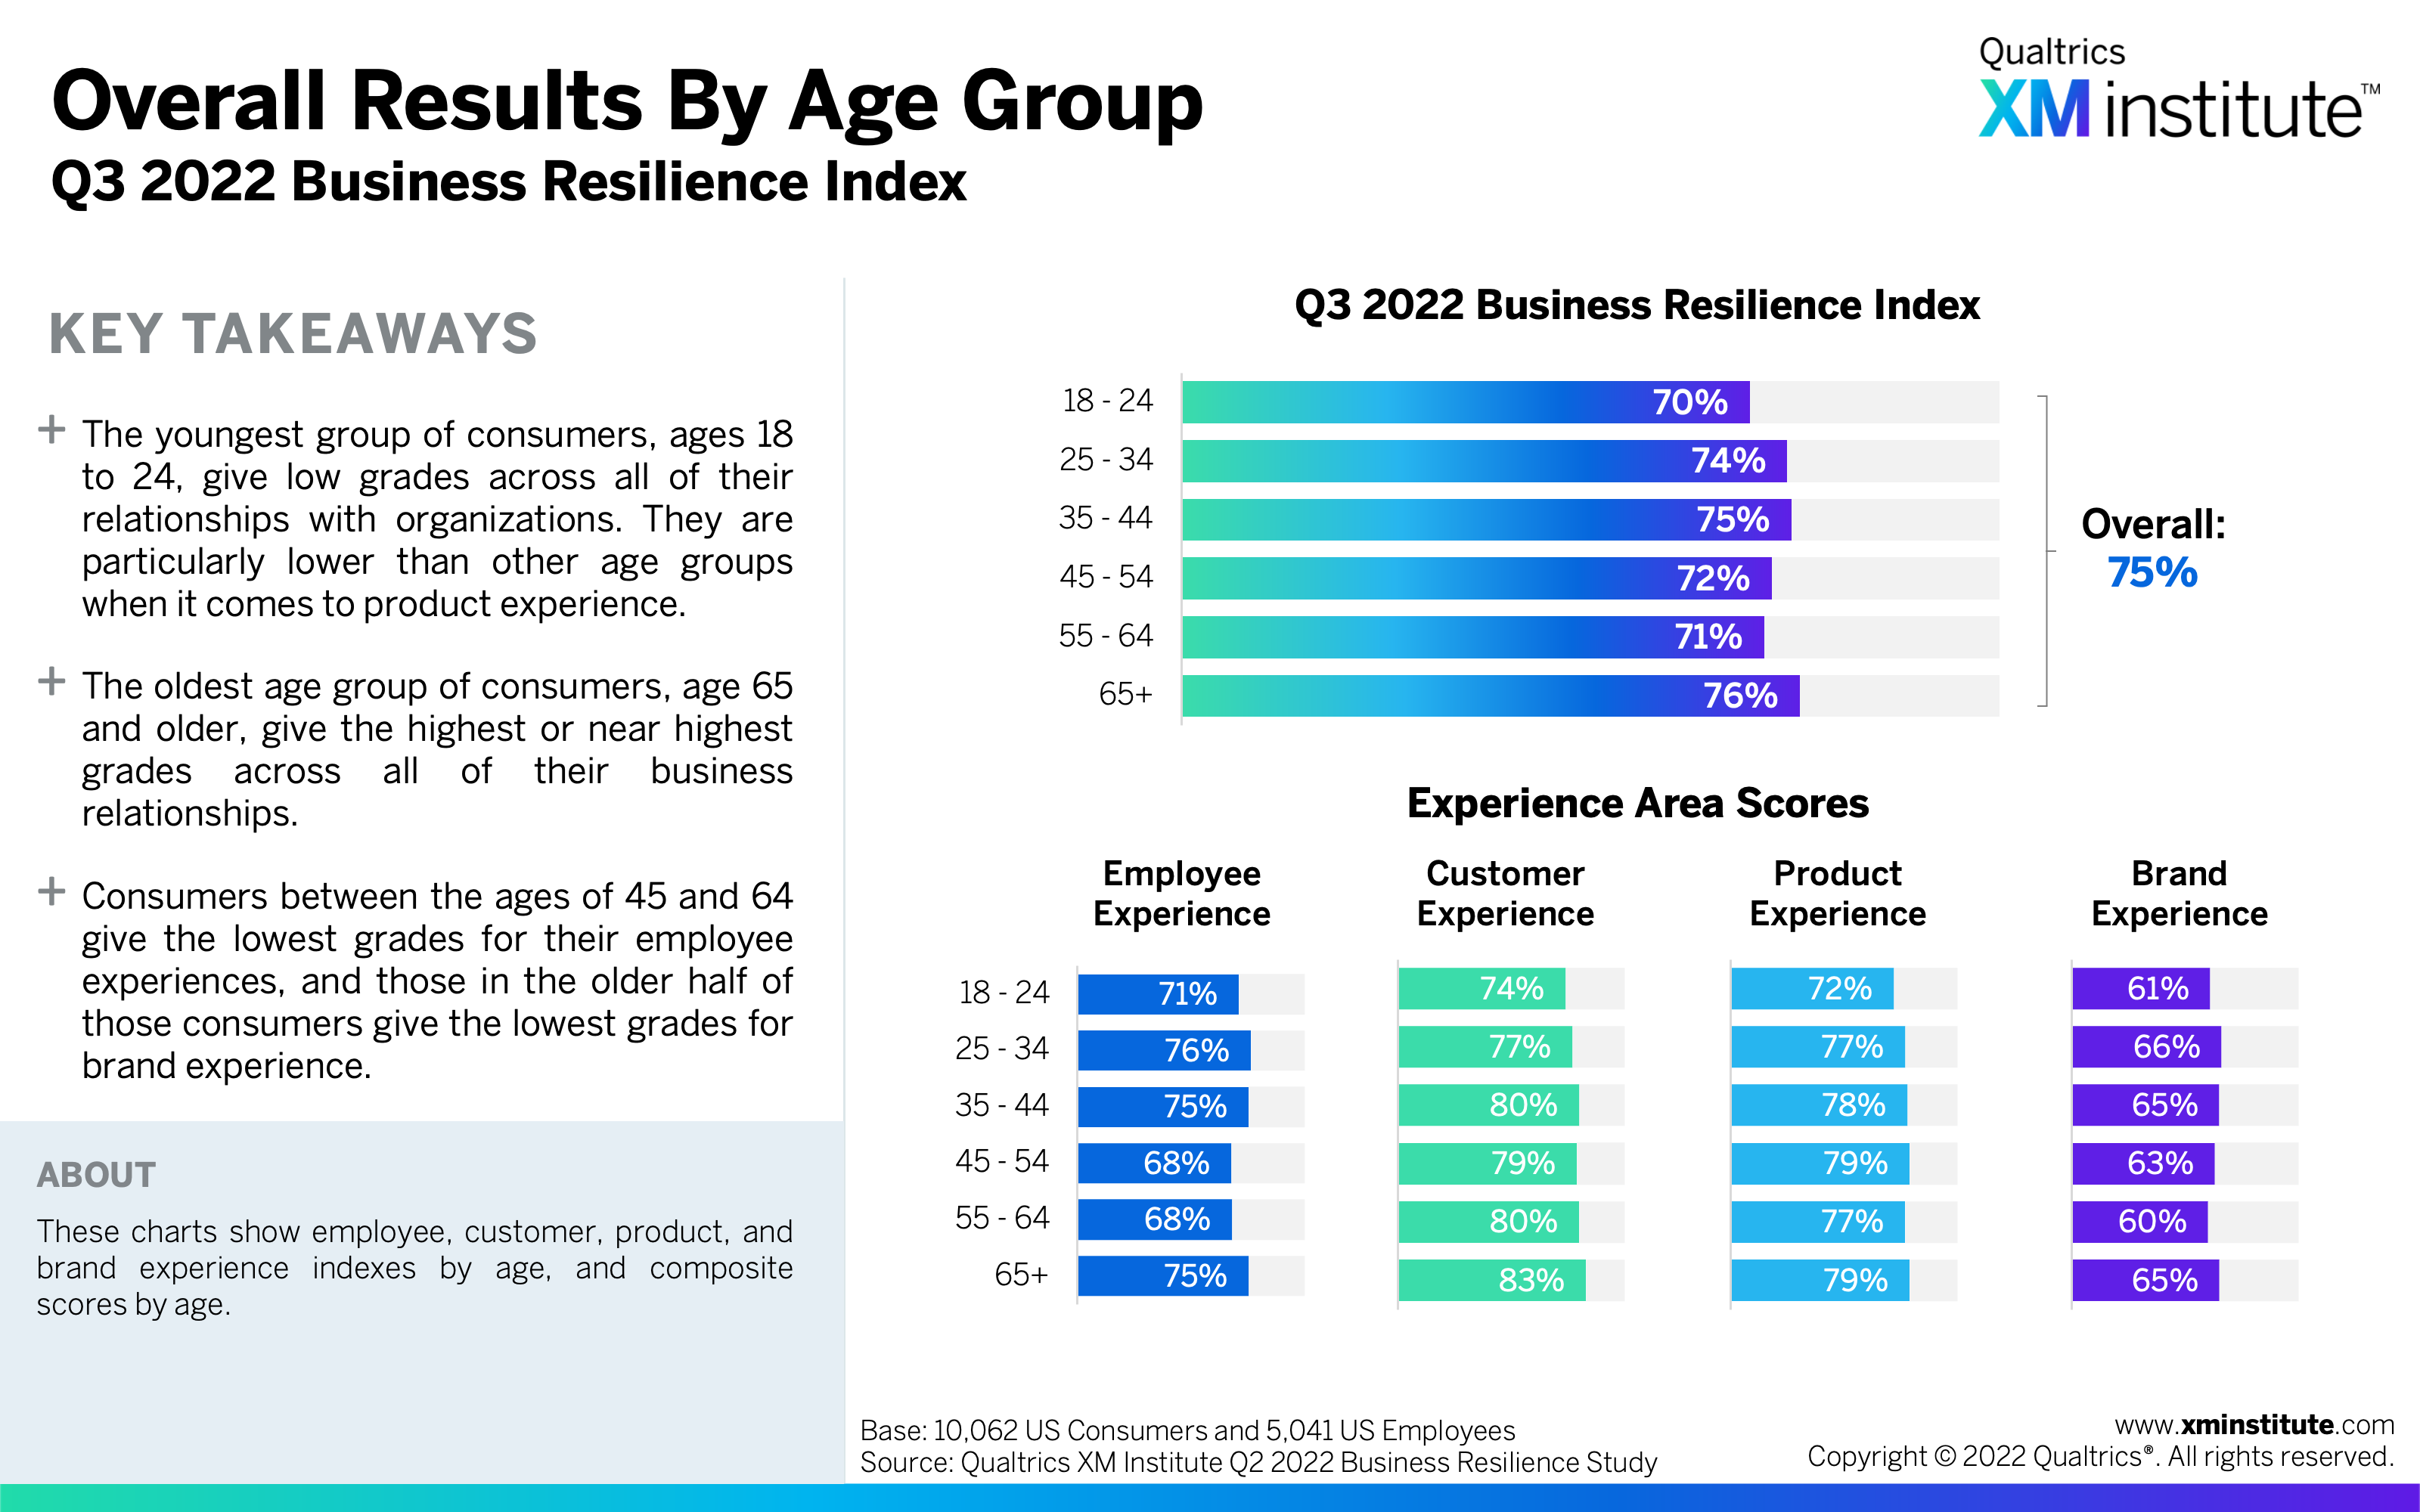
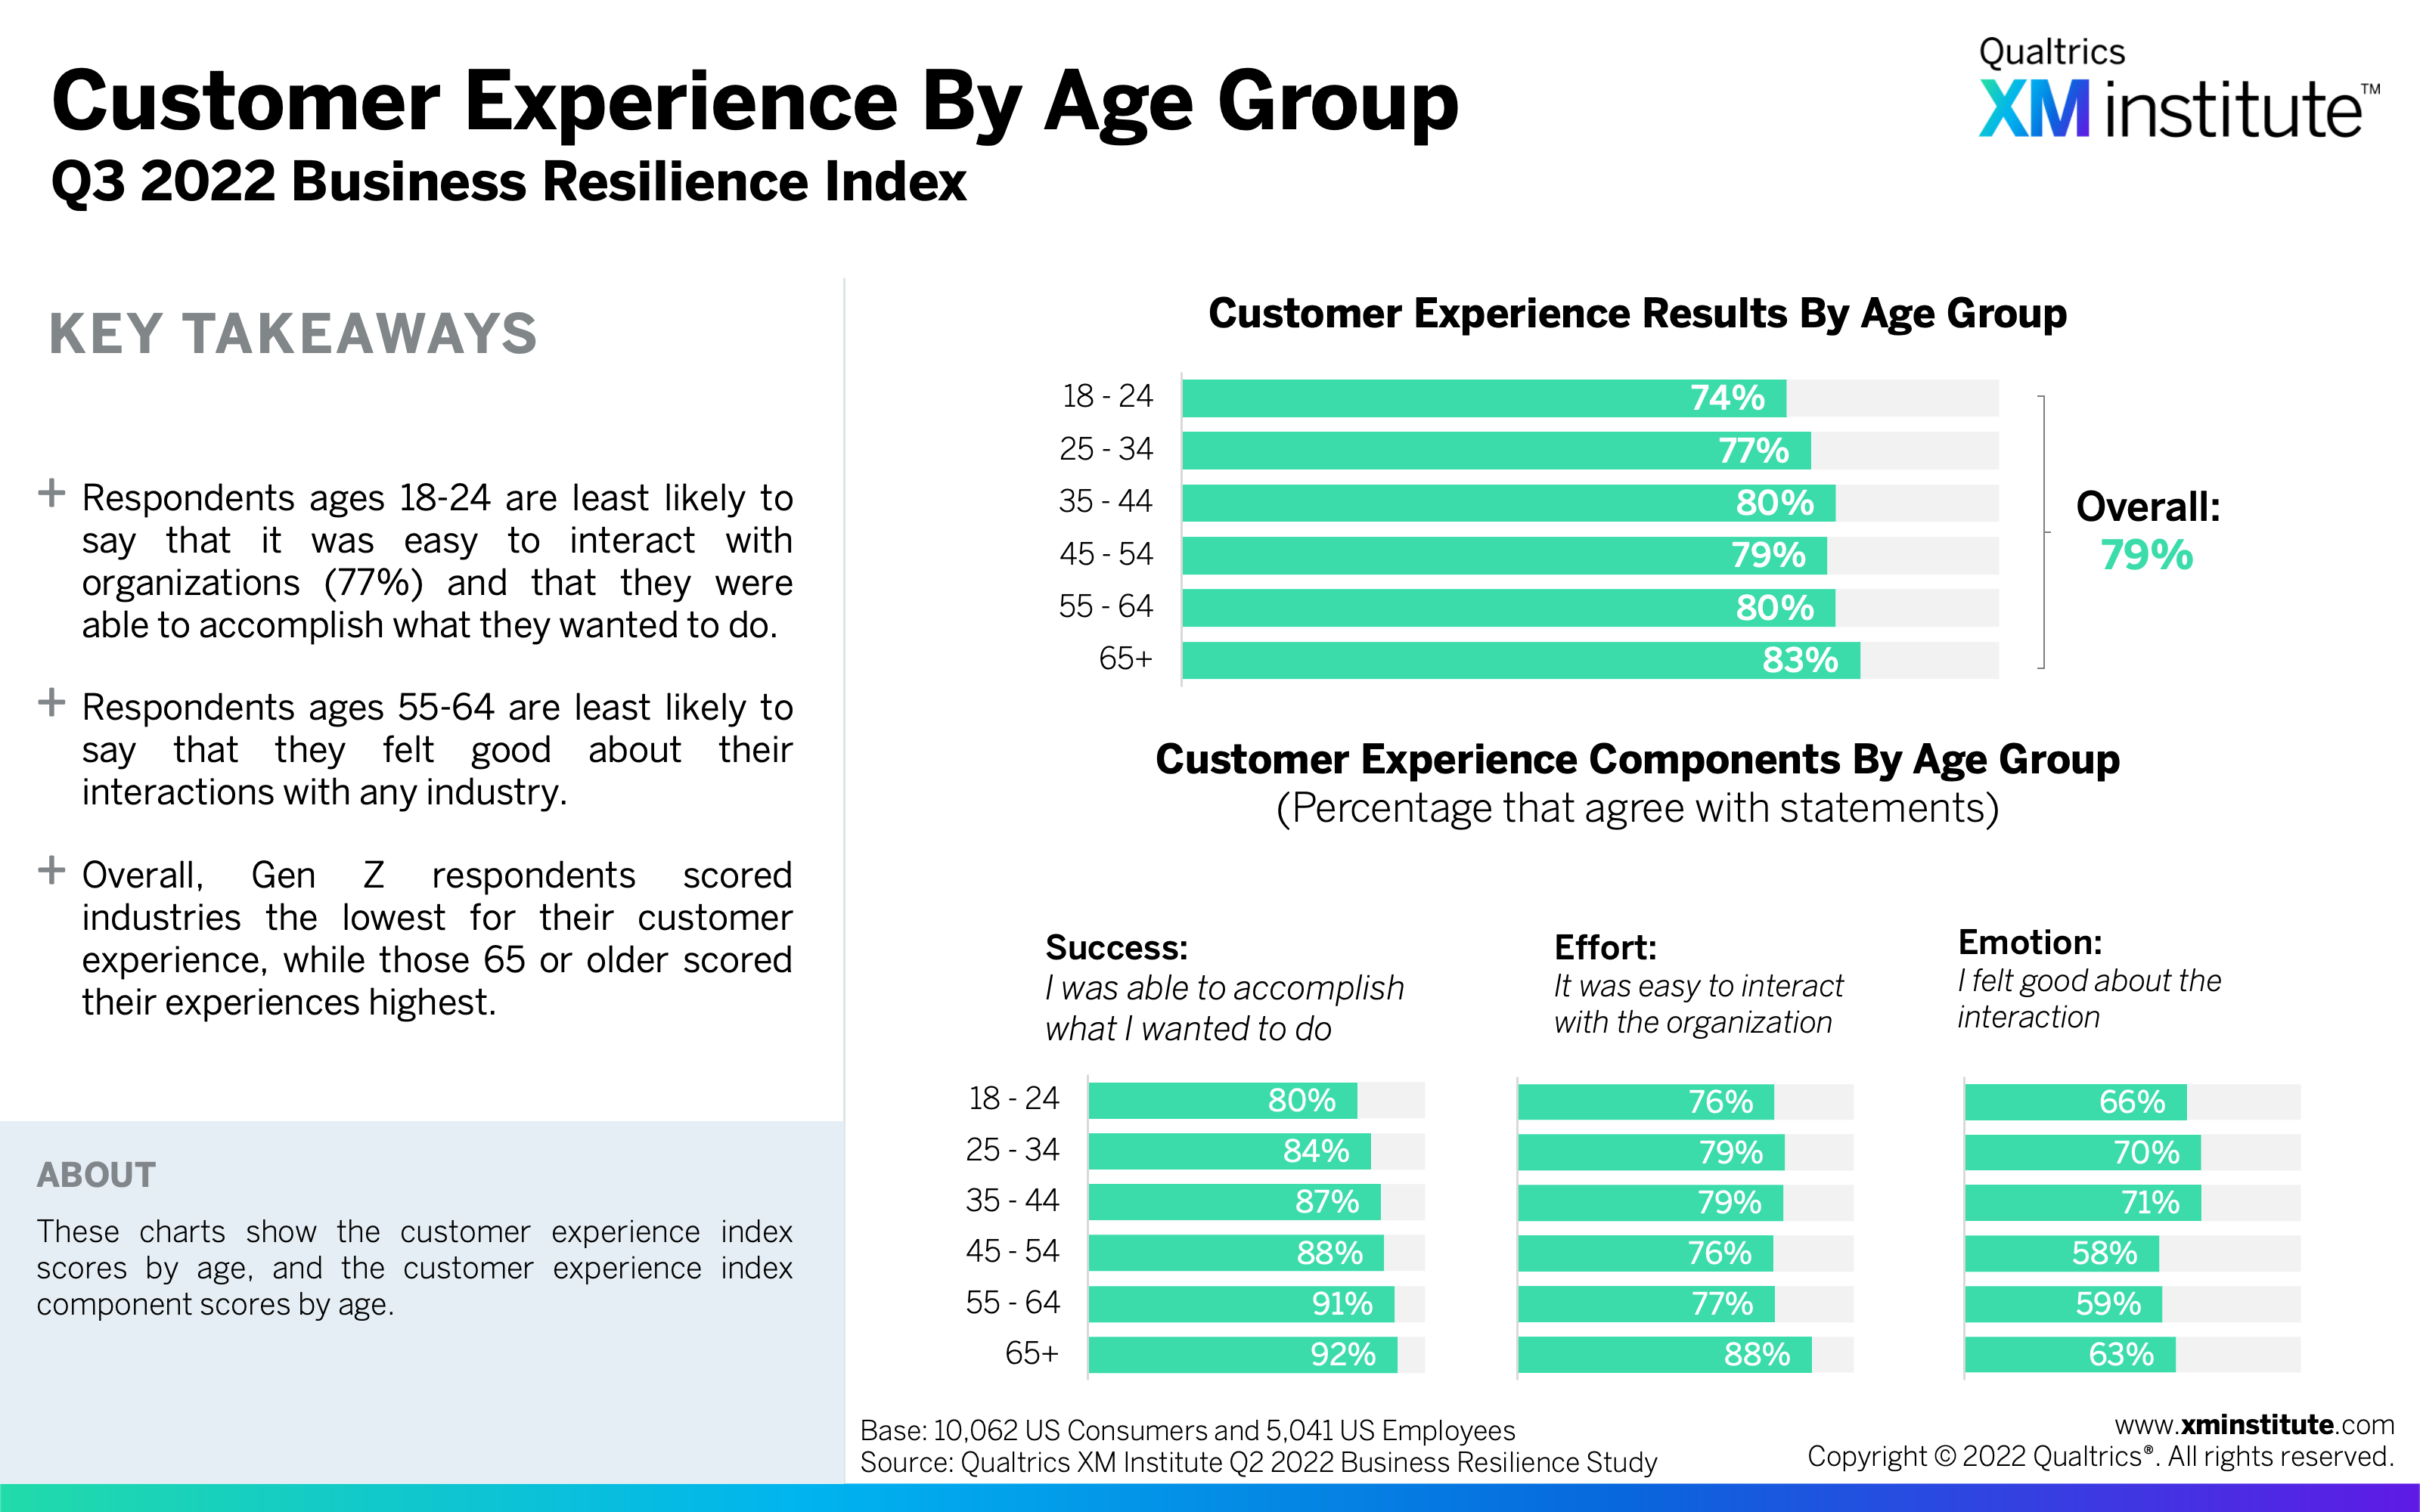
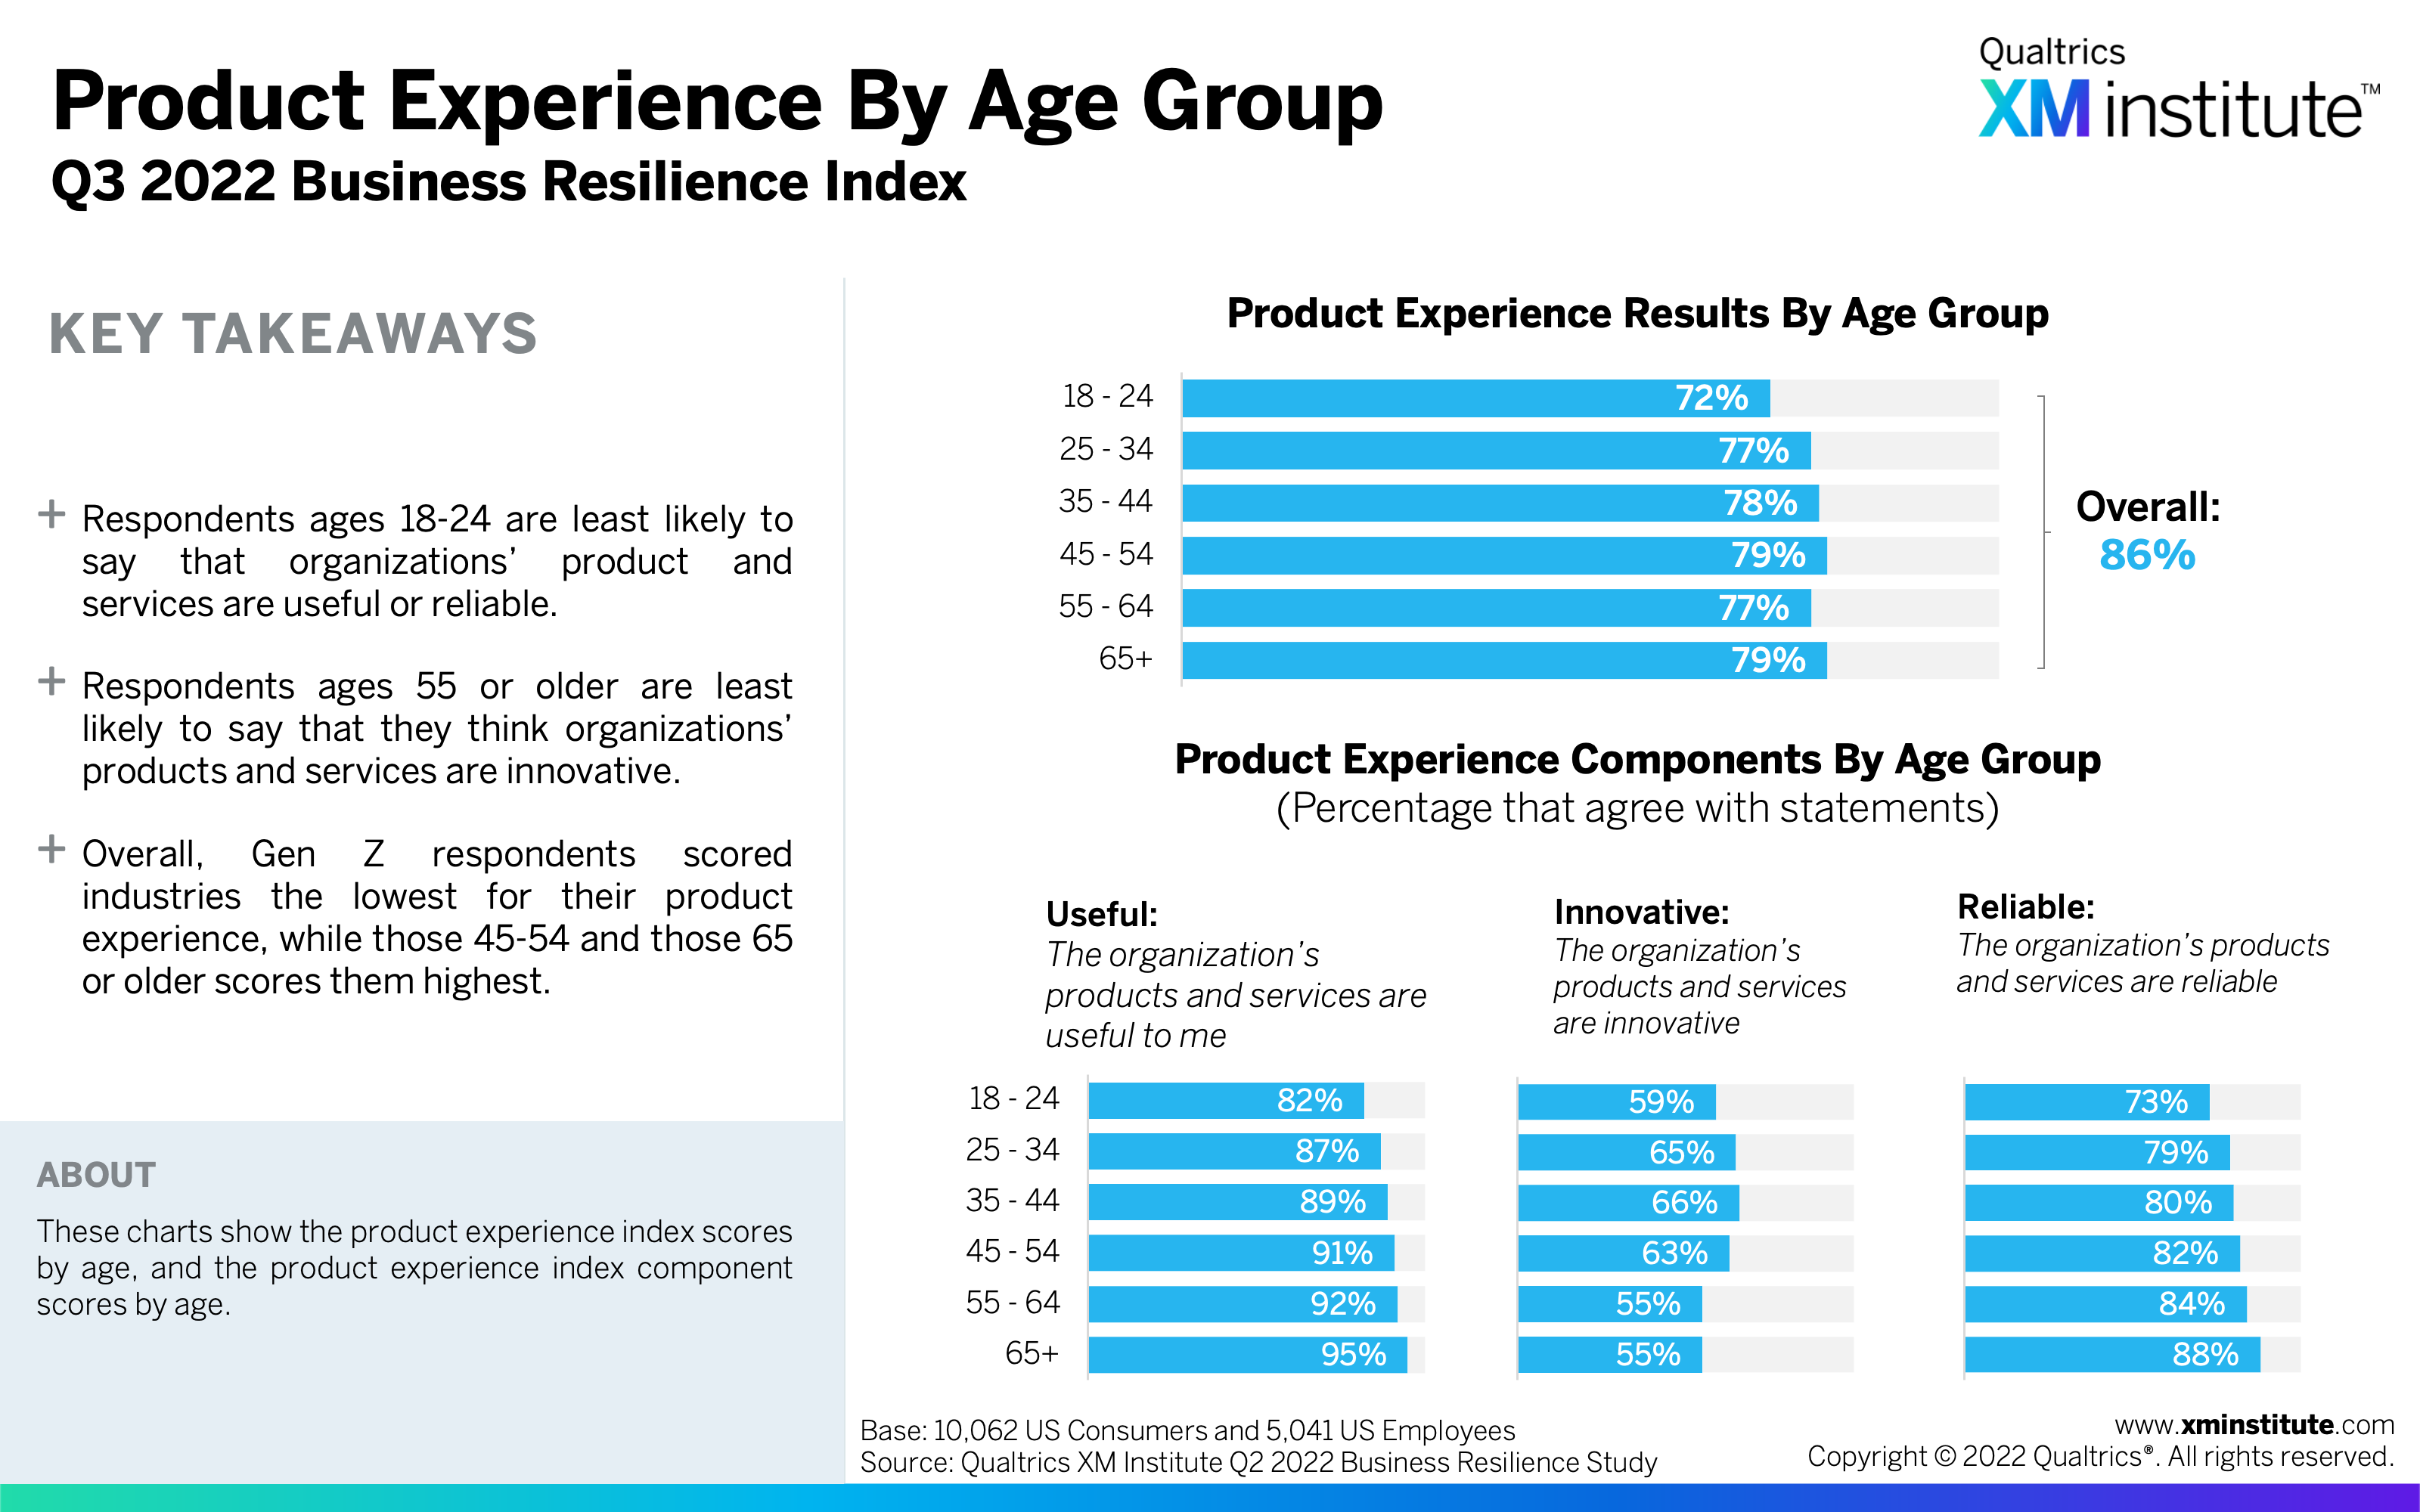
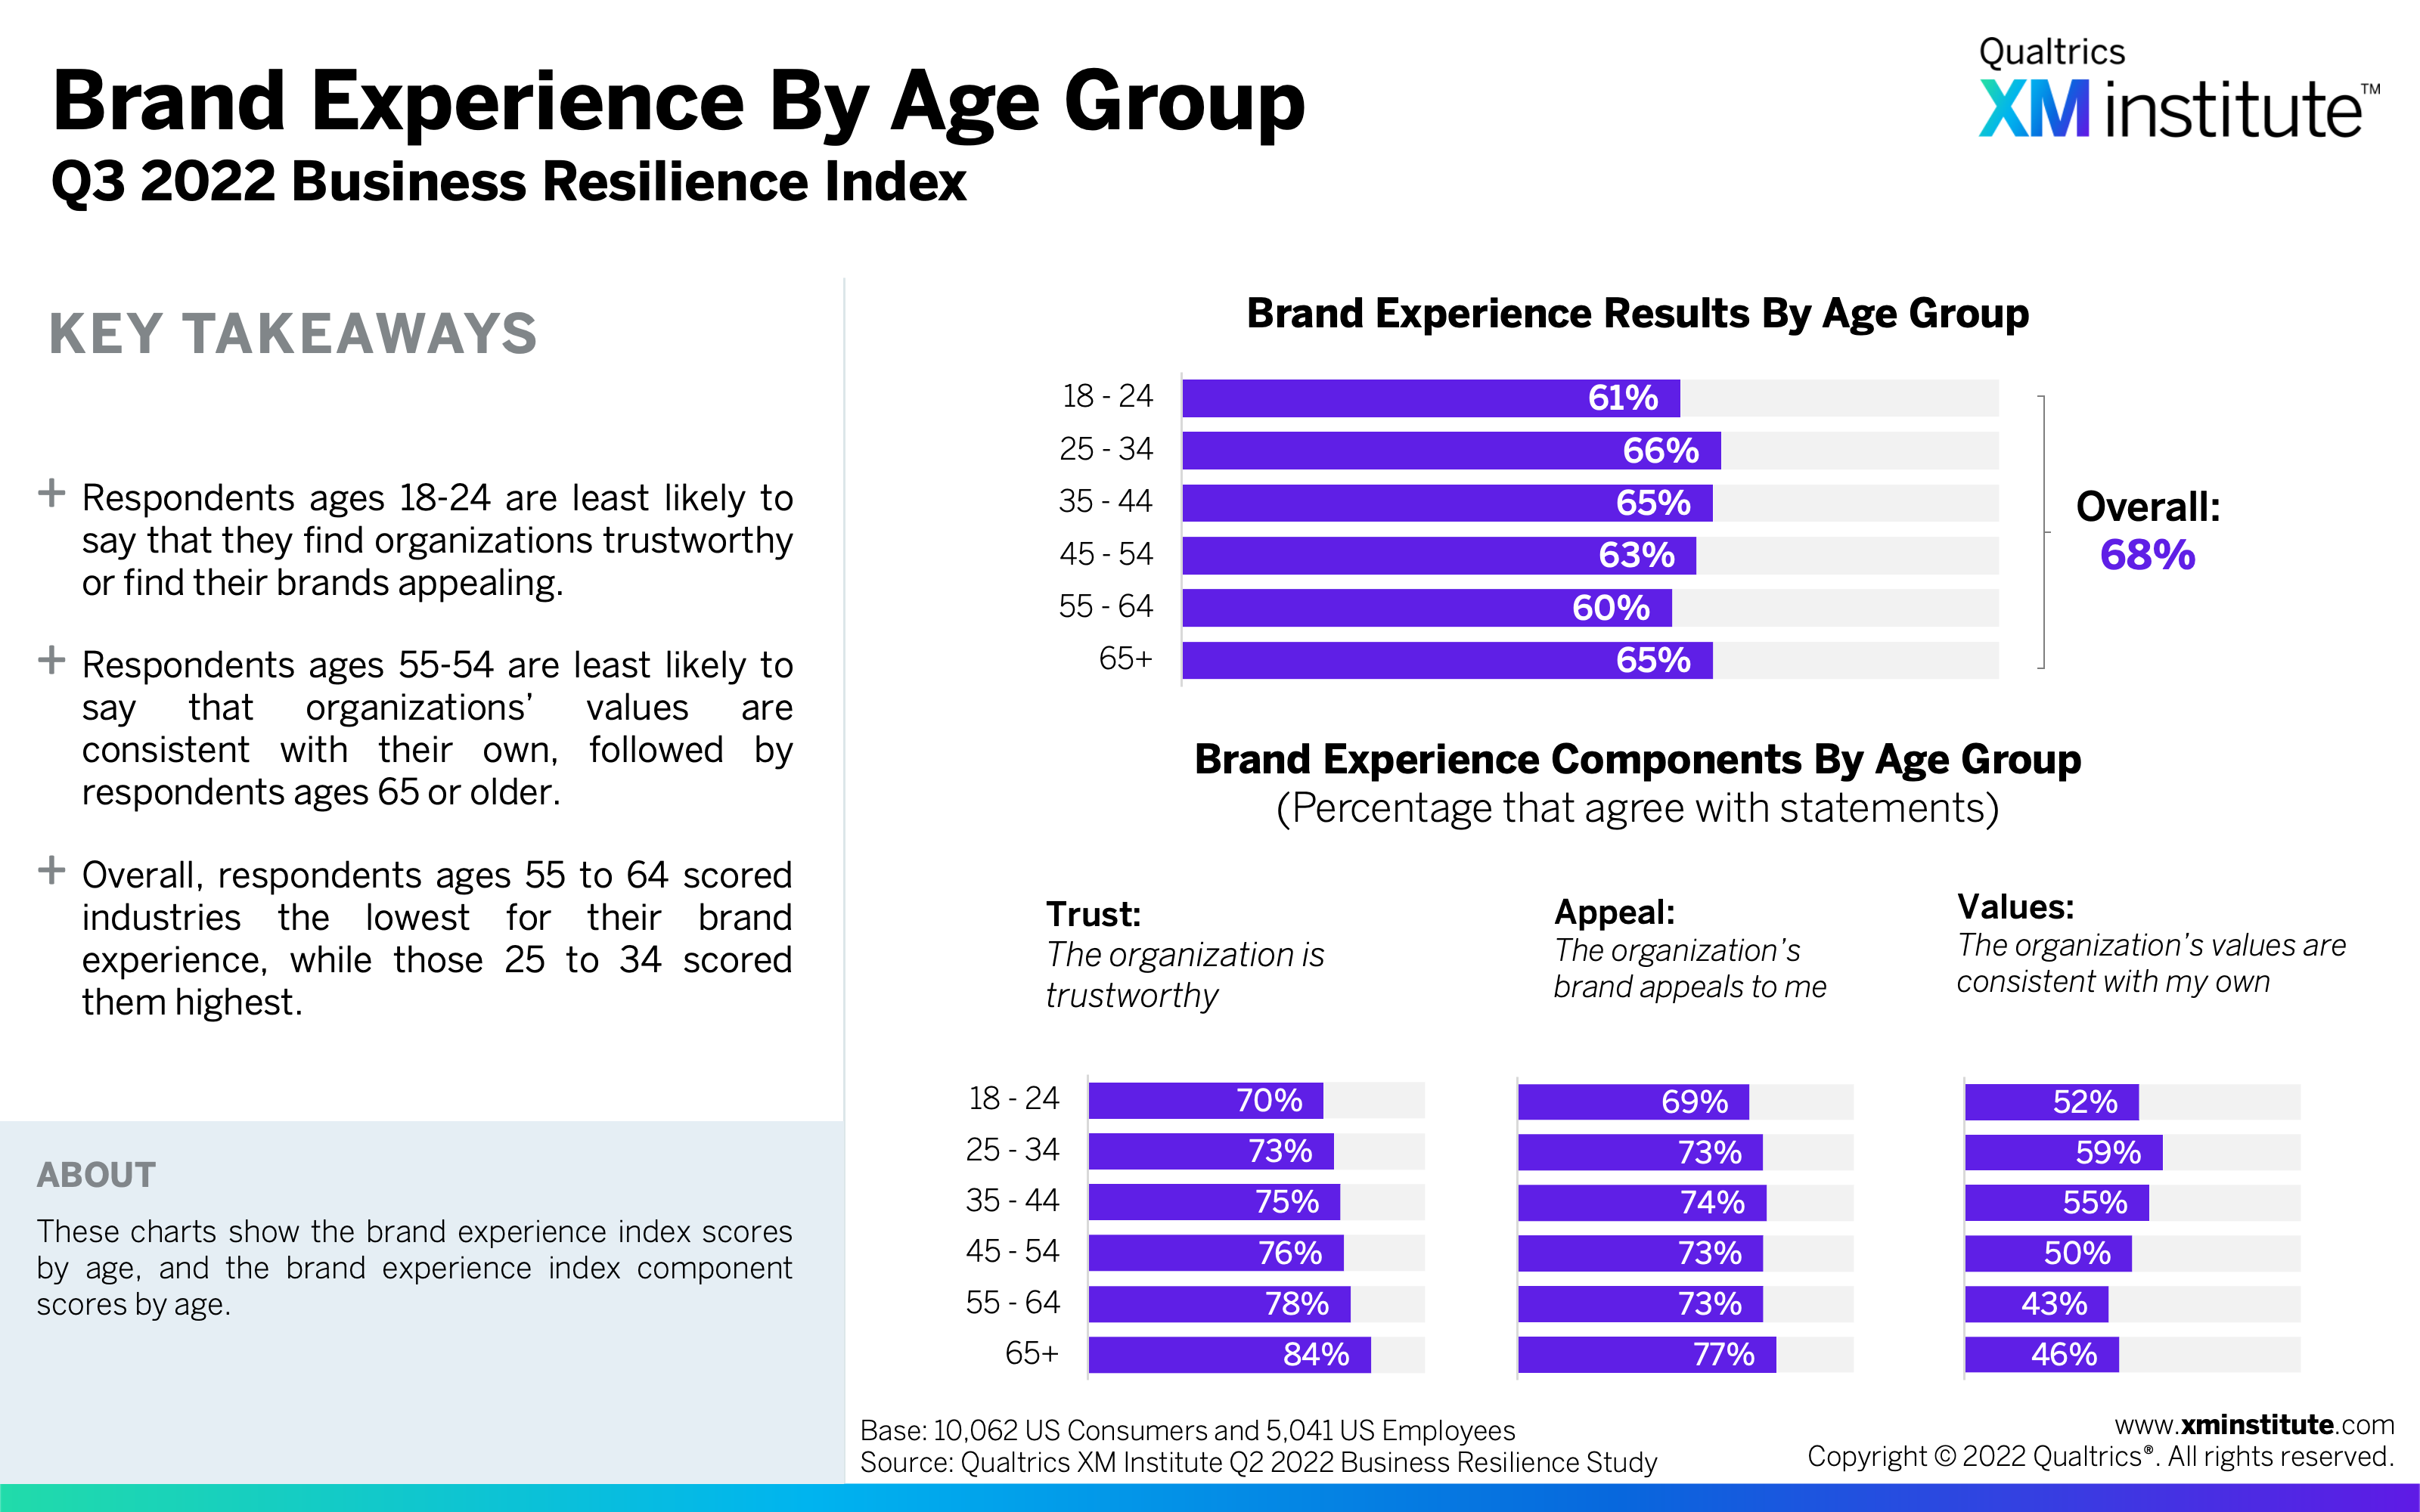
- Gen Z consumers scored all experience areas the lowest. The youngest group of consumers (18 to 24) gave low grades across all of their relationships with organizations. Their scores were particularly low compared with other age groups when it comes to product experience.
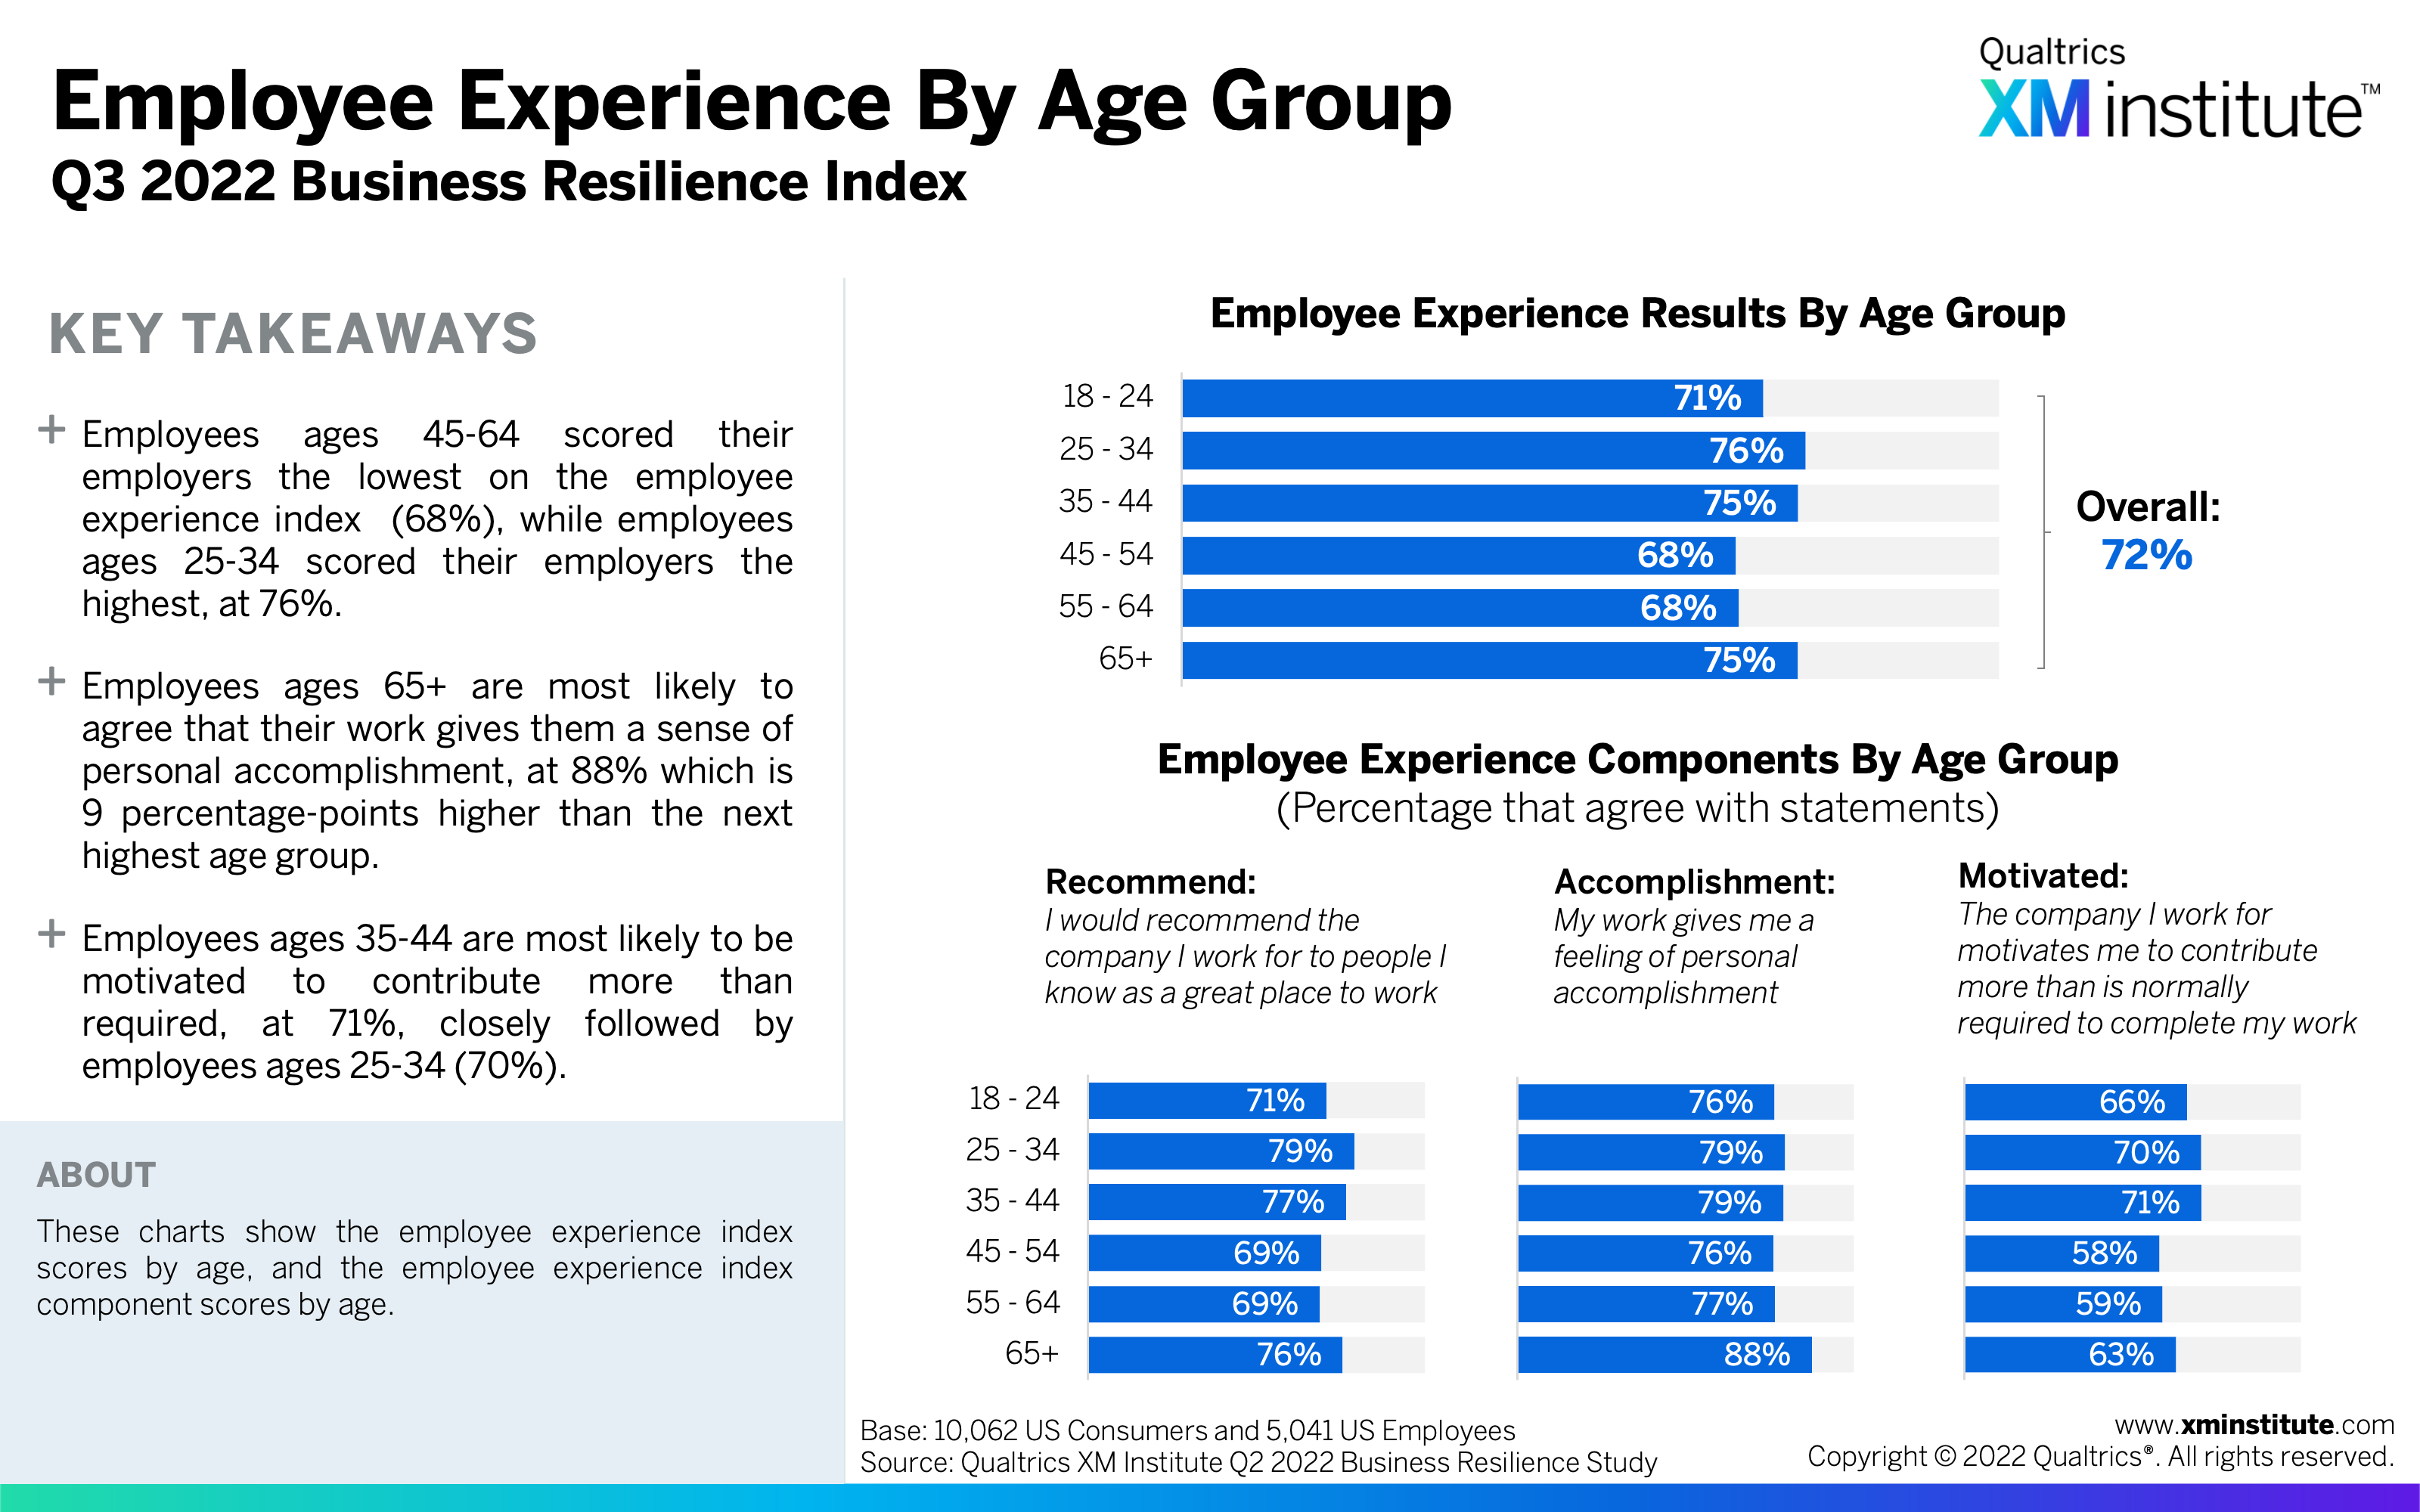
- 45- to 64-year olds gave the lowest employee experience scores. This group gave by far the lowest employee experience scores overall and for each of the three employee experience component scores.
Figures
Here are the figures in this Data Snapshot:
- Overall Results
- Overall Results By Age Group
- Employee Experience by Age Group
- Employee Experience by Job Level
- Employee Experience by Job Industry
- Customer Experience by Industry
- Customer Experience by Industry (Top 10)
- Customer Experience by Industry (Bottom 10)
- Customer Experience by Age Group
- Product Experience by Industry
- Product Experience by Industry (Top 10)
- Product Experience by Industry (Bottom 10)
- Product Experience by Age Group
- Brand Experience by Industry
- Brand Experience by Industry (Top 10)
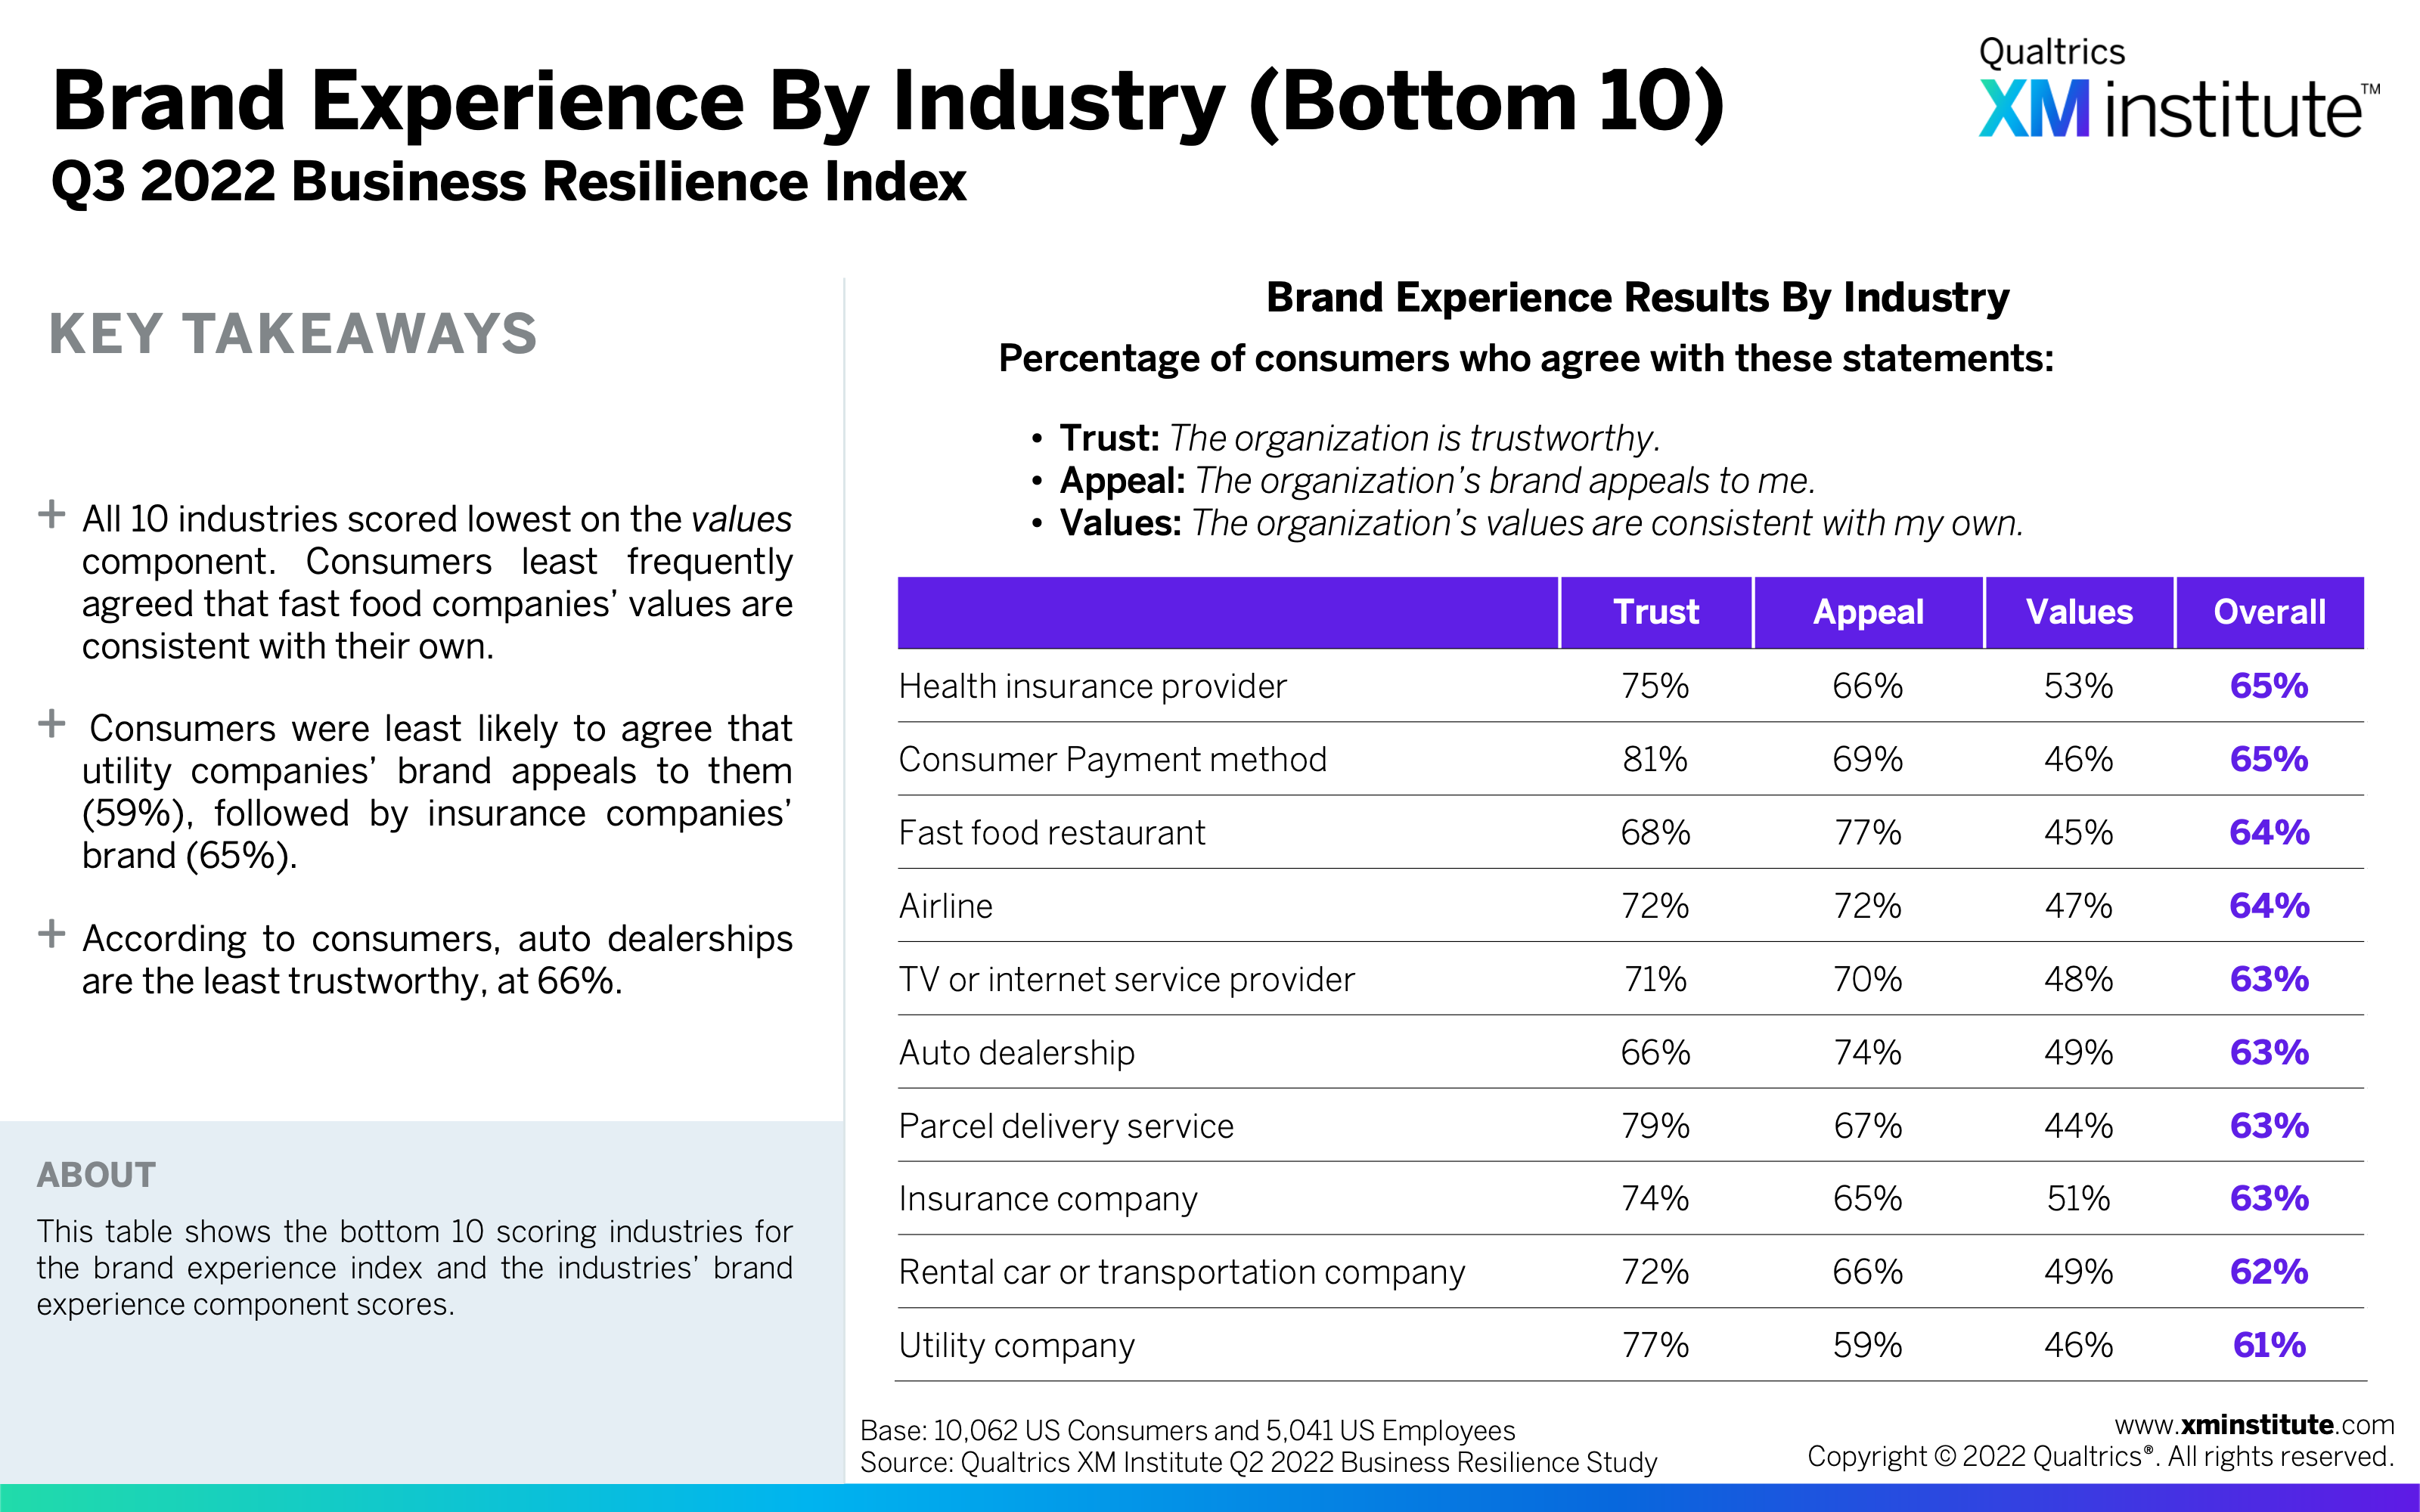
- Brand Experience by Industry (Bottom 10)
- Brand Experience by Age Group
- Questions Used
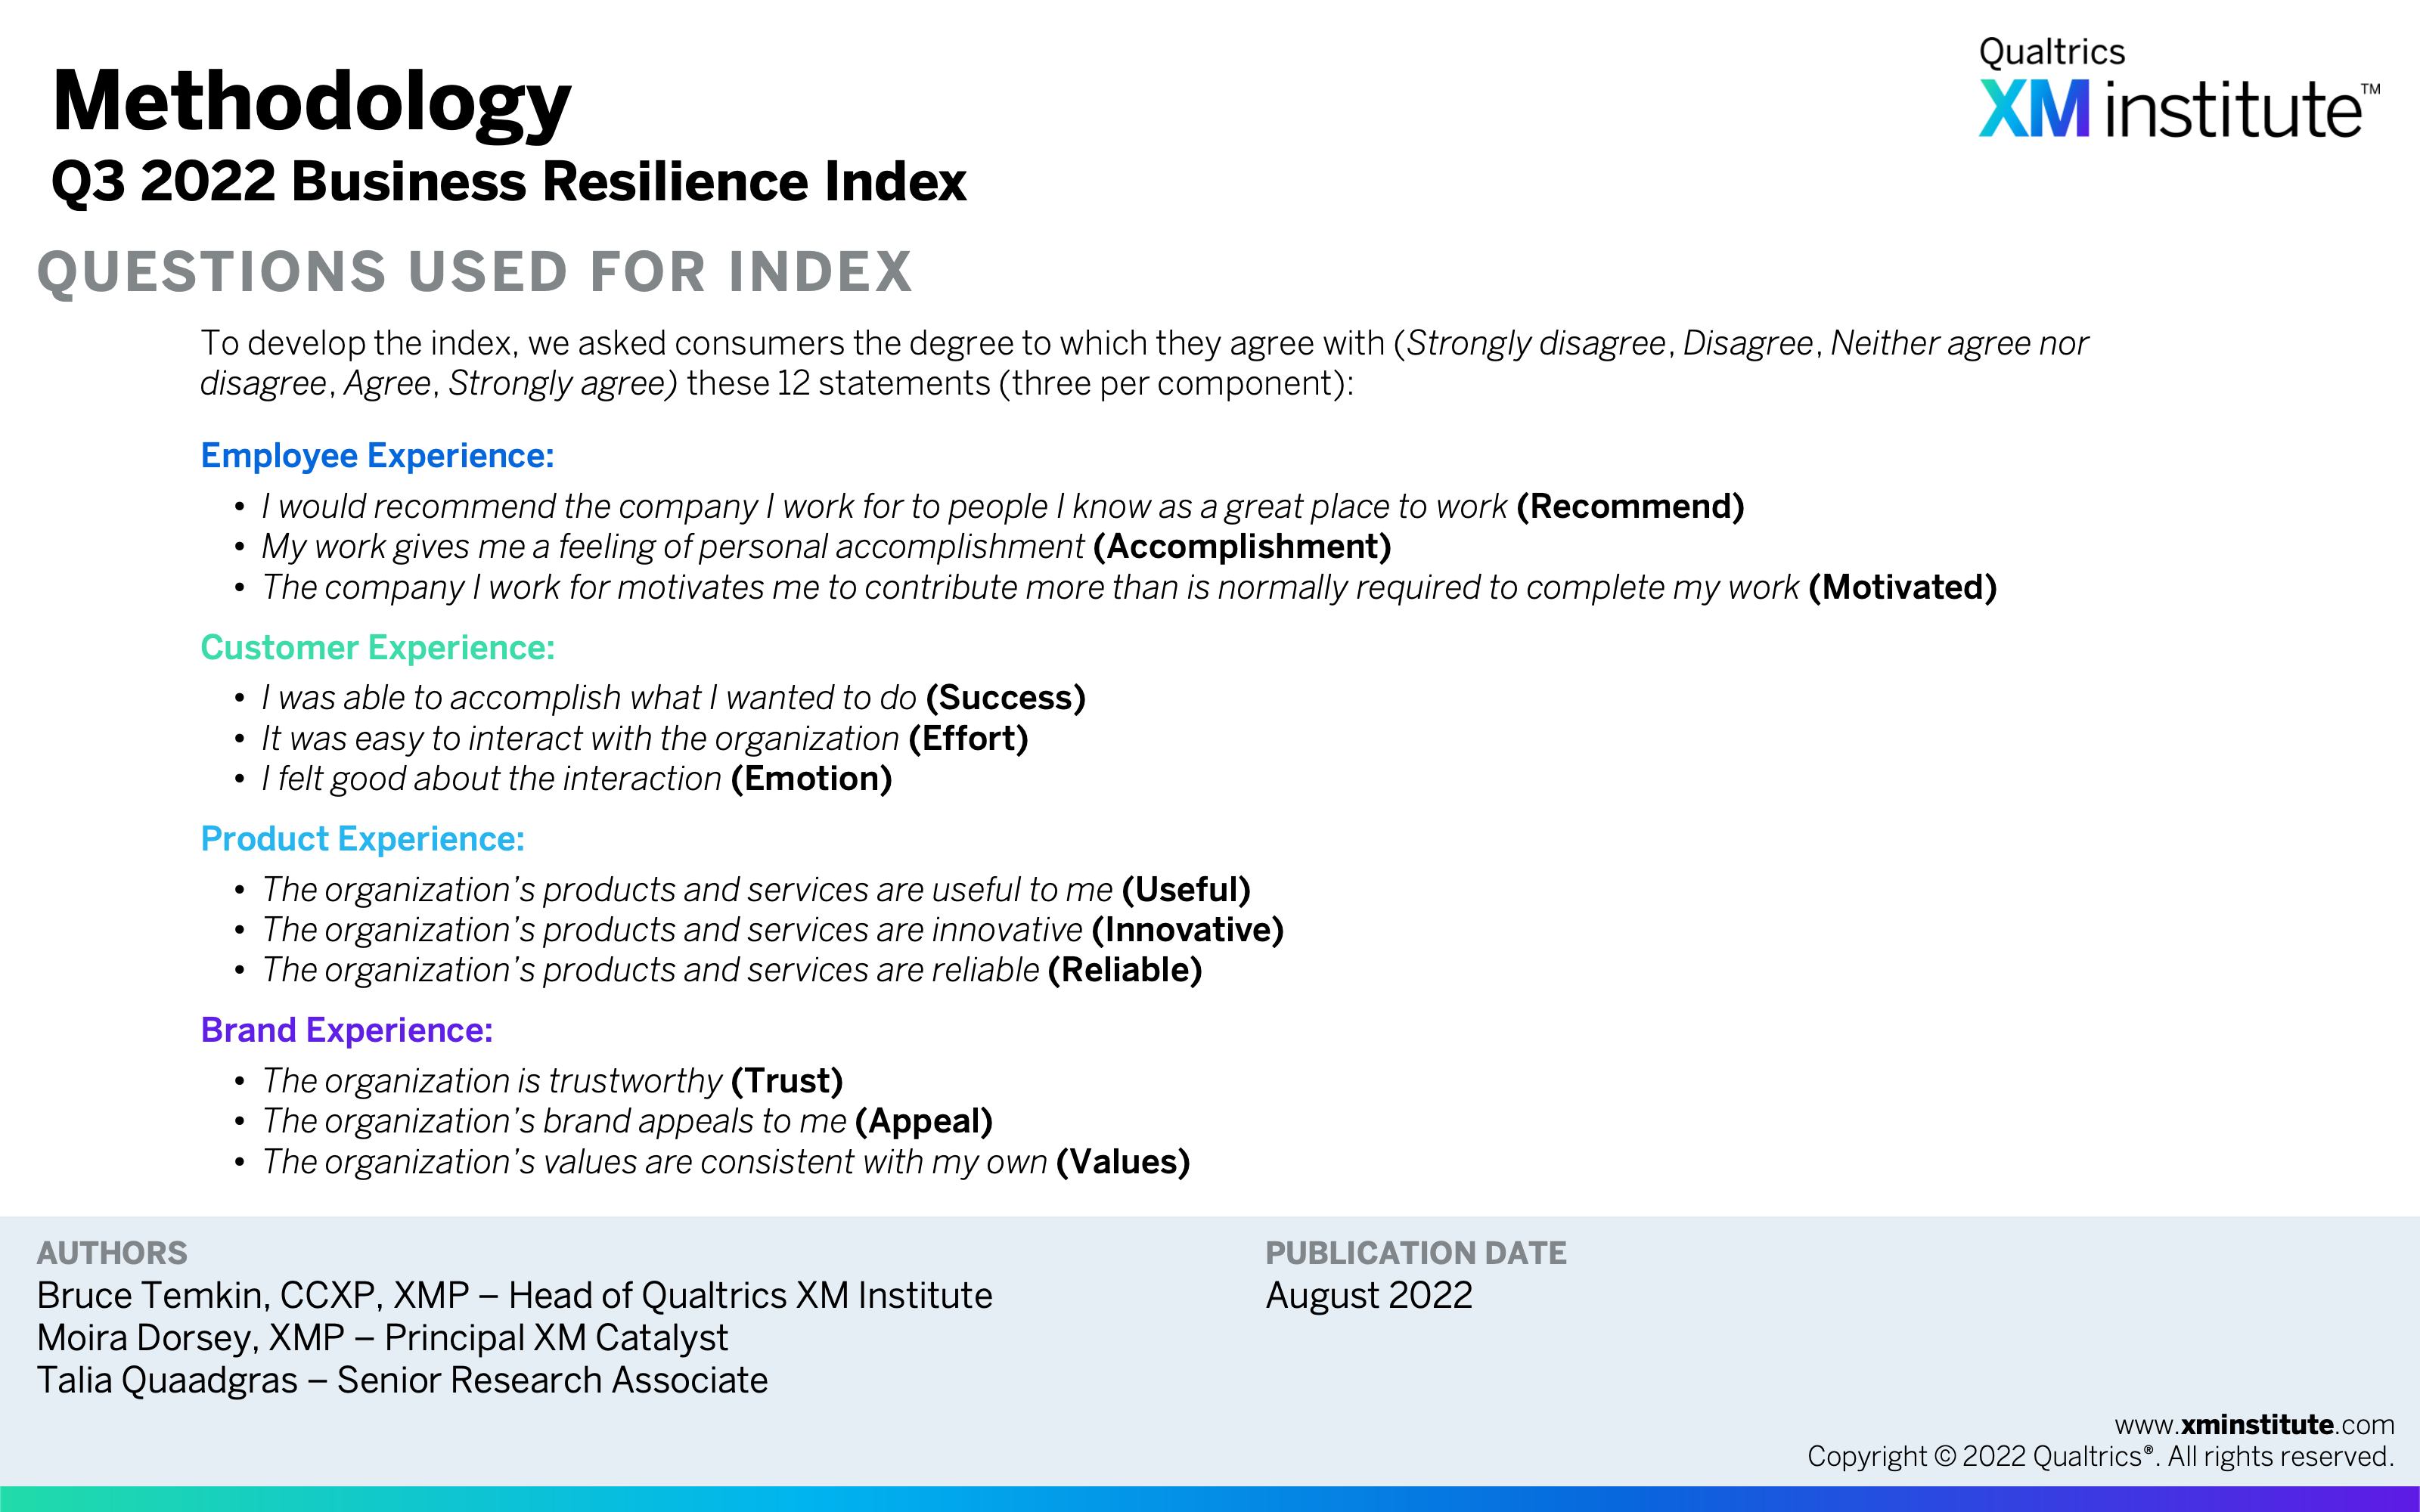
- Methodology