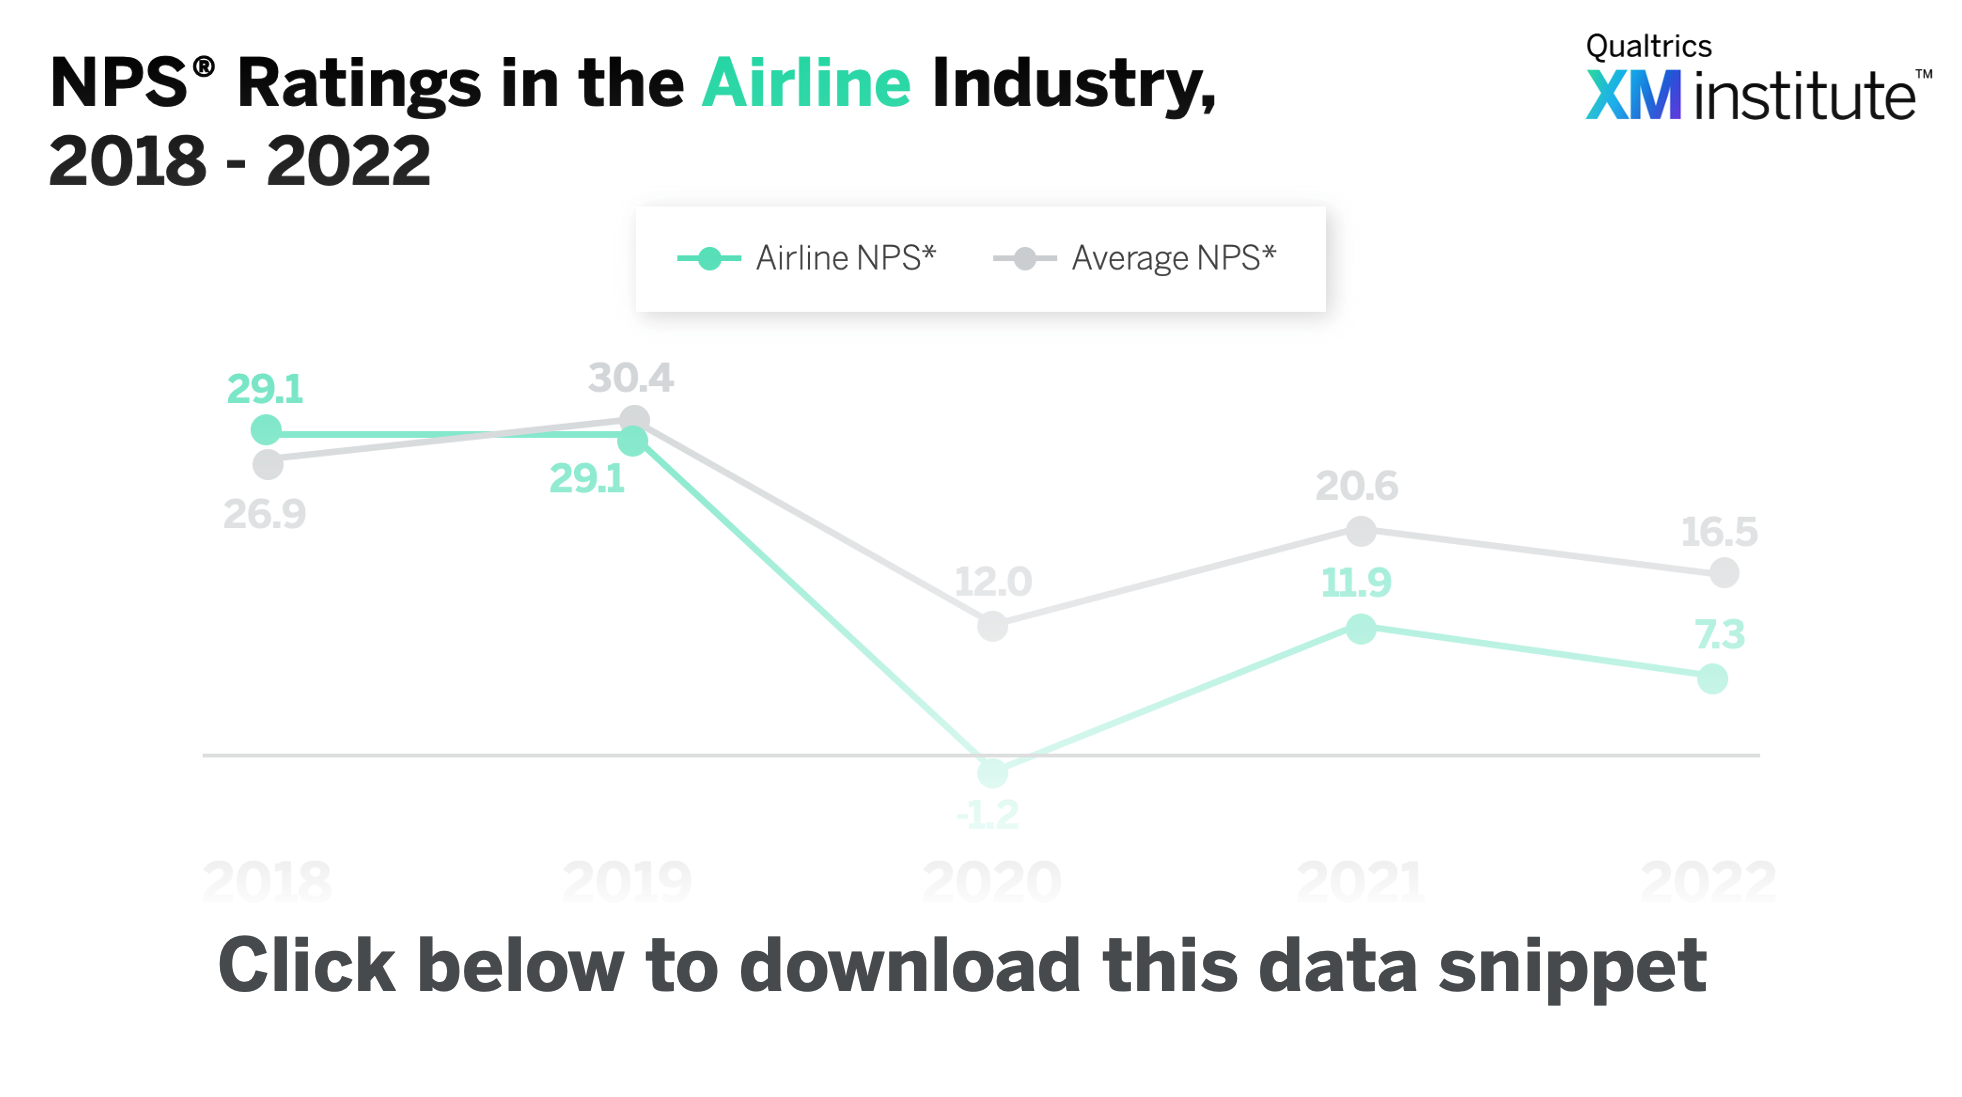
As part of our annual U.S. consumer benchmark study, we asked respondents to evaluate companies across multiple measures of customer experience, including Net Promoter Score (NPS)* – a popular customer experience metric organizations use to track and increase the likelihood of customers recommending their business.
These Data Snippets show how NPS ratings have trended over the past five years for 20 different industries. Use the insights in these Data Snippets to assess how your organization’s NPS compares to the average within and across industries and to track the effect the COVID-19 pandemic had on this core CX metric.
Here is some additional information about the methodology behind each of the included U.S. consumer benchmark studies:
- 2018: This U.S. consumer benchmark study surveyed 10,000 consumers across 342 companies and 20 industries.
- 2019: This U.S. consumer benchmark study surveyed 10,000 consumers across 294 companies and 20 industries.
- 2020: This U.S. consumer benchmark study surveyed 10,000 consumers across 319 companies and 20 industries. We used their responses to calculate the “XMI Customer Ratings – Consumer NPS, 2020.” For more information on changes in Net Promoter Score from 2019 to 2020, see our blog post, Net Promoter Score Collapses During Pandemic.
- 2021: This U.S. consumer benchmark study surveyed 9,056 consumers across 344 companies and 22 industries. We used their responses to calculate the “XMI Customer Ratings – Consumer NPS, 2021.” For more information on changes in Net Promoter Score from 2019 to 2021, see our blog post, Net Promoter Scores Partially Recover From 2020 Collapse.
- 2022: This U.S. consumer benchmark study surveyed 10,000 consumers across 353 companies and 22 industries. For more information on changes in Net Promoter Score from 2021 to 2022, see our blog post, 2022 U.S. Net Promoter Score Drops from 2021 Recovery.
To use this Data Snippet, download and include it in presentations. The graphic is free to use but must retain the copyright notice.
*The Ratings are calculated using the standard NPS® method. Net Promoter Score, Net Promoter, and NPS are registered trademarks of Bain & Company, Satmetrix, and Fred Reichheld.
NPS Trends: 2018 – 2022
Find the Data Snippet for each of the 20 individual industries below:


