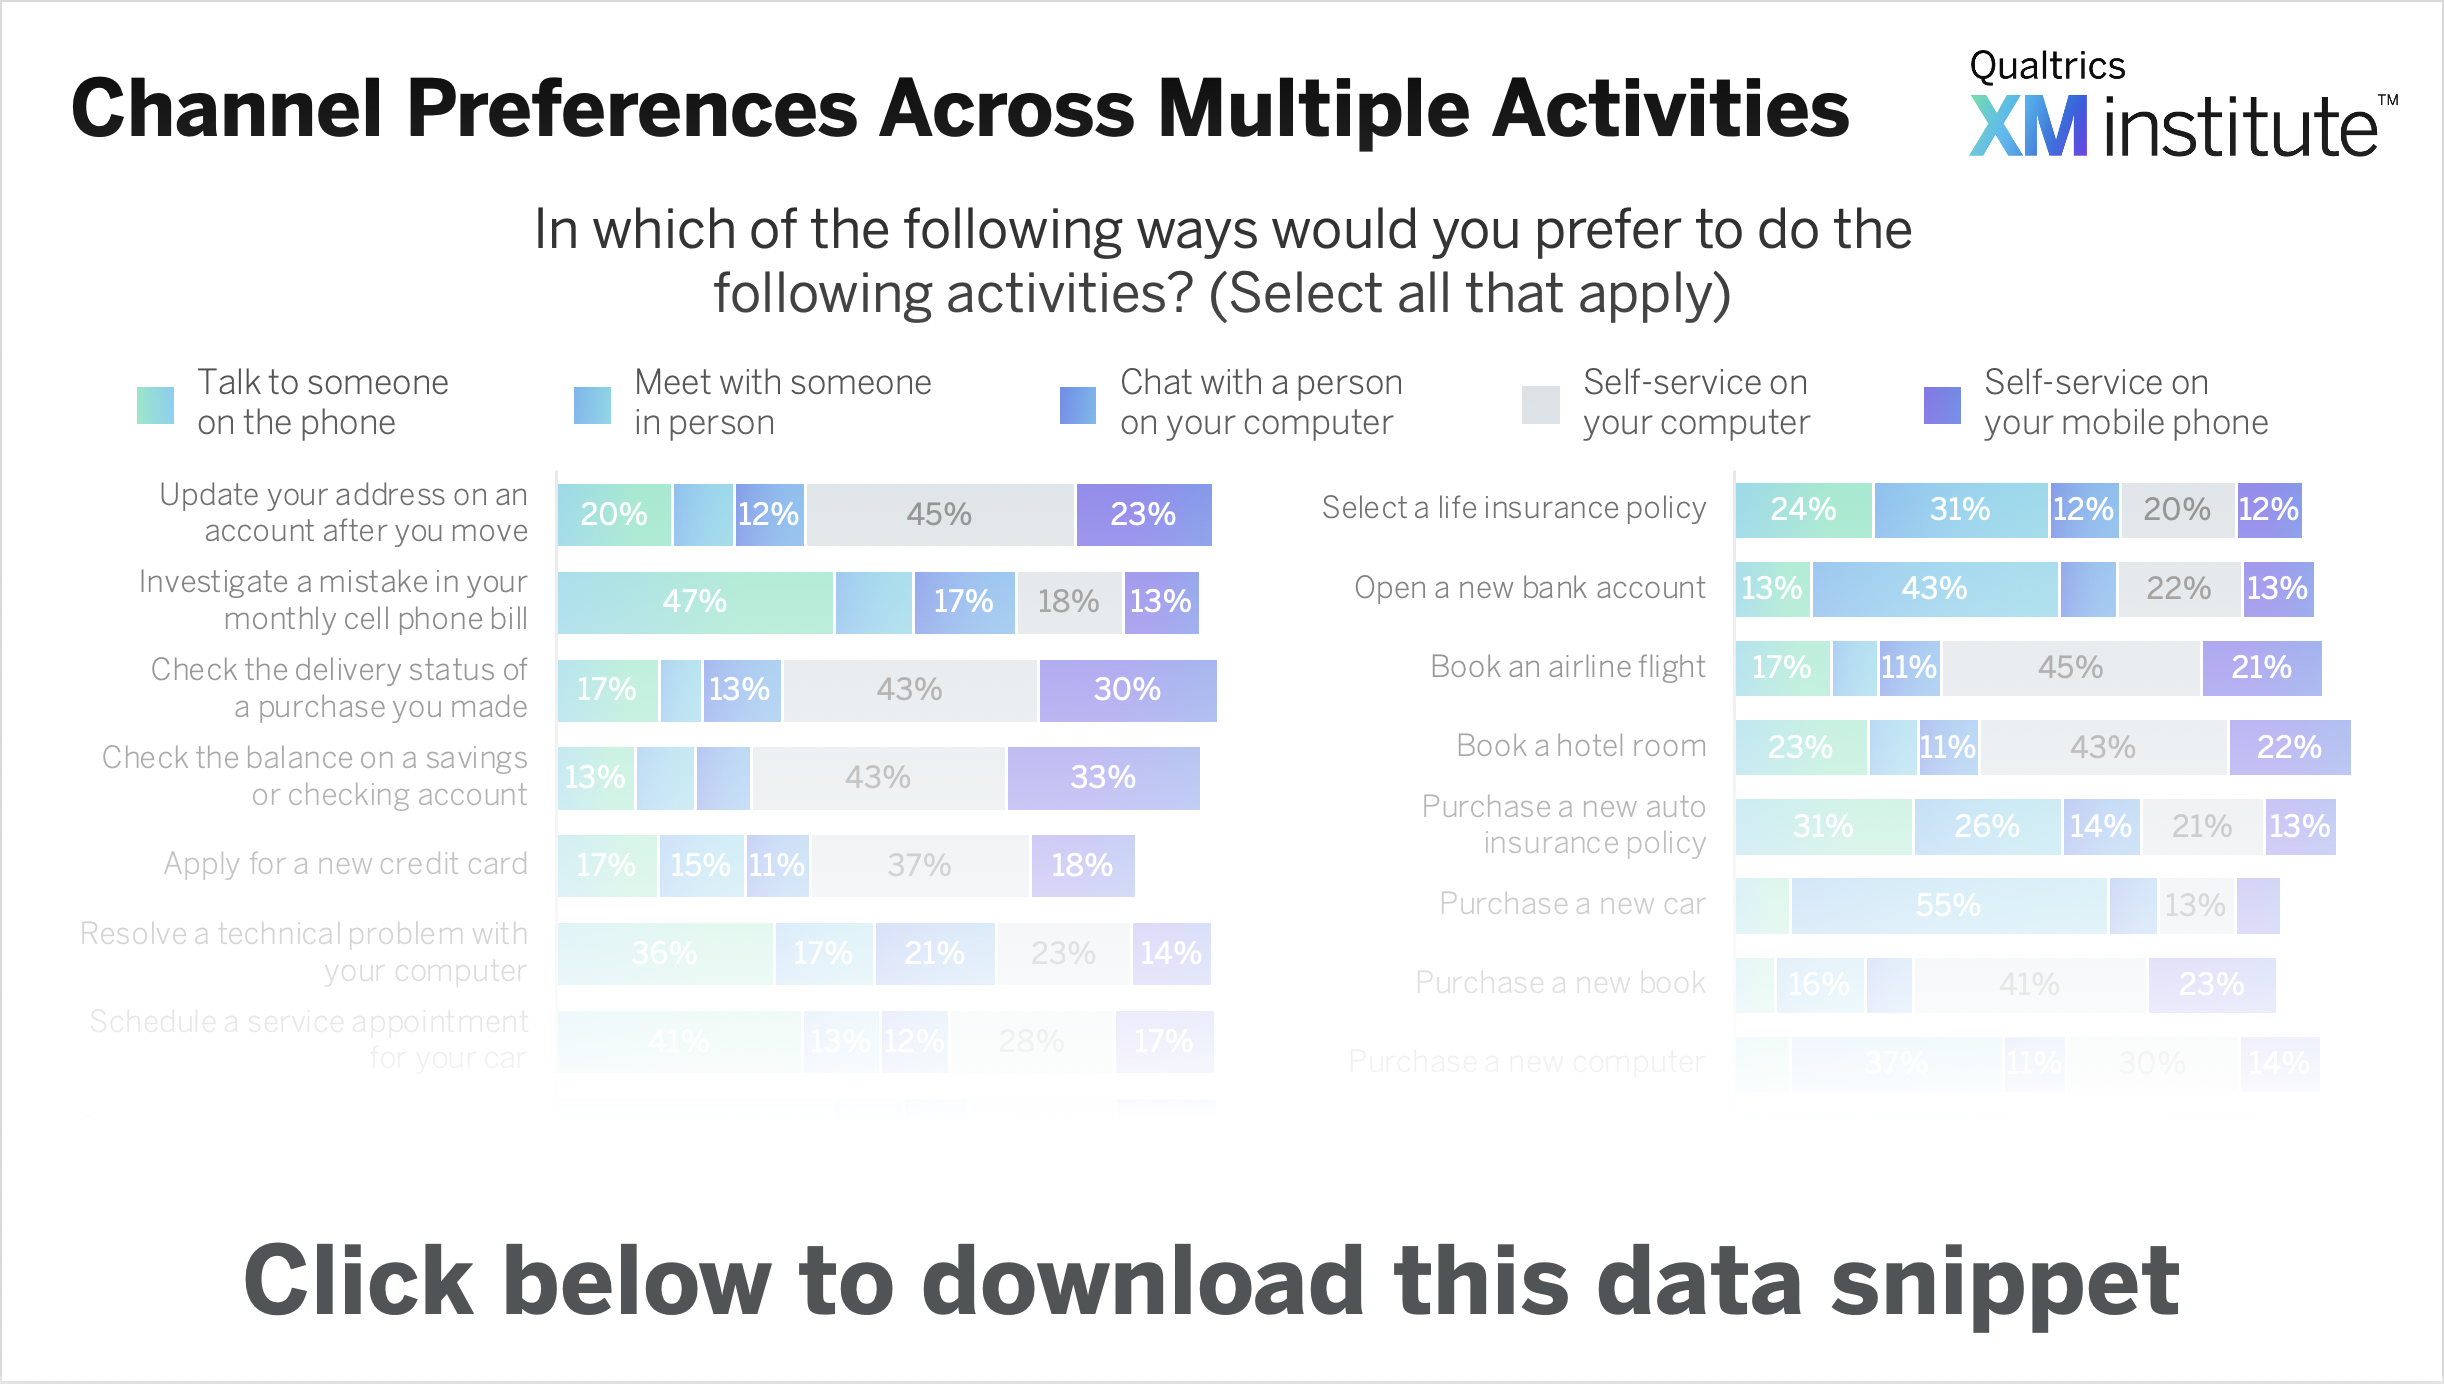
To understand how consumers prefer to complete common tasks, we examined feedback from 10,000 U.S. consumers describing their channel preferences for 18 different activities.
The data come from the Qualtrics XM Institute Q2 2020 consumer benchmark study, which surveys a representative sample of 10,000 U.S. consumers. For more information and benchmark results on consumers’ channel preferences, check out the full Channel Preferences Benchmark, 2020 Data Snapshot.
To use this Data Snippet, download and include it in presentations. The graphic is free to use but must retain the copyright notice.