It’s hard to keep up with everything that Temkin Group published in 2017, so we put together a couple of infographics to highlight some of the key data insights. The initial infographic examined CX efforts and ROI.
In this infographic, we examine 12 factoids on CX ratings, people, and leadership. Below the infographic you’ll find links to download the graphic, along with links to the referenced content.
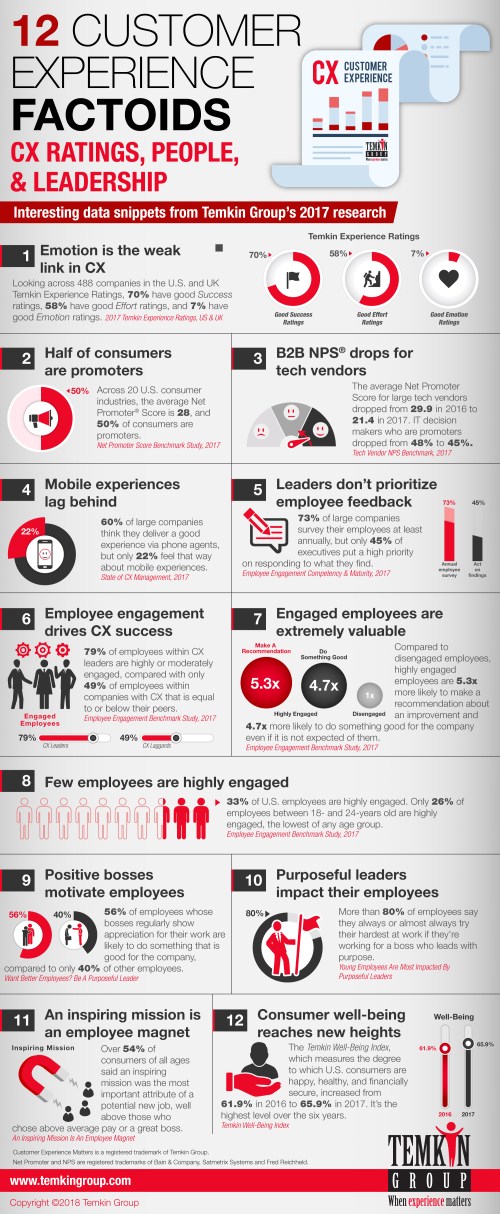
Here are links to the research referenced in the infographic:
- 2017 Temkin Experience Ratings, U.S.
- 2017 Temkin Experience Ratings, UK
- 2017 Temkin Emotion Ratings, U.S. & UK
- Net Promoter Benchmark Study, 2017
- Tech Vendor NPS Benchmark (B2B), 2017
- State of CX Management, 2017
- Employee Engagement Competency & Maturity, 2017
- Employee Engagement Benchmark Study, 2017
- Want Better Employees? Be A Purposeful Leader
- Young Employees Are Most Impacted By Purposeful Leaders
- An Inspiring Mission Is An Employee Magnet
- 2017 Temkin Well-Being Index
This blog post was originally published by Temkin Group prior to its acquisition by Qualtrics in October 2018.
Categories :
Customer Experience (CX), Employee Experience (EX)