Qualtrics XM Institute (and previously Temkin Group) has been tracking Net Promoter® Scores (NPS®) in the U.S. since 2012. So we decided to take a look at the changes we’ve seen over the previous decade. The data comes from consumer studies that we’ve run in Q2 or Q3 each year, with sample sizes of 8,000 to 10,000 U.S. consumers.
NPS is not an absolute measurement, as it reflects consumers’ attitudes towards a company relative to their expectations and perceived alternatives. We would not expect NPS to organically grow or decline over time, as both expectations and alternatives are always evolving. So the shifts in NPS at an aggregate level often reflect some prevailing attitude shifts, which we will examine in this post.
We’ve added and adjusted some of the different industry groupings, but there are 18 industries that have remained relatively the same throughout the 10 years. So we used an average of those industries as a key component to this analysis.
NPS Changes Across Industries
We examined the 10-year changes in NPS across 18 industries that we’ve tracked for 10 years and four others that have been more recently added.
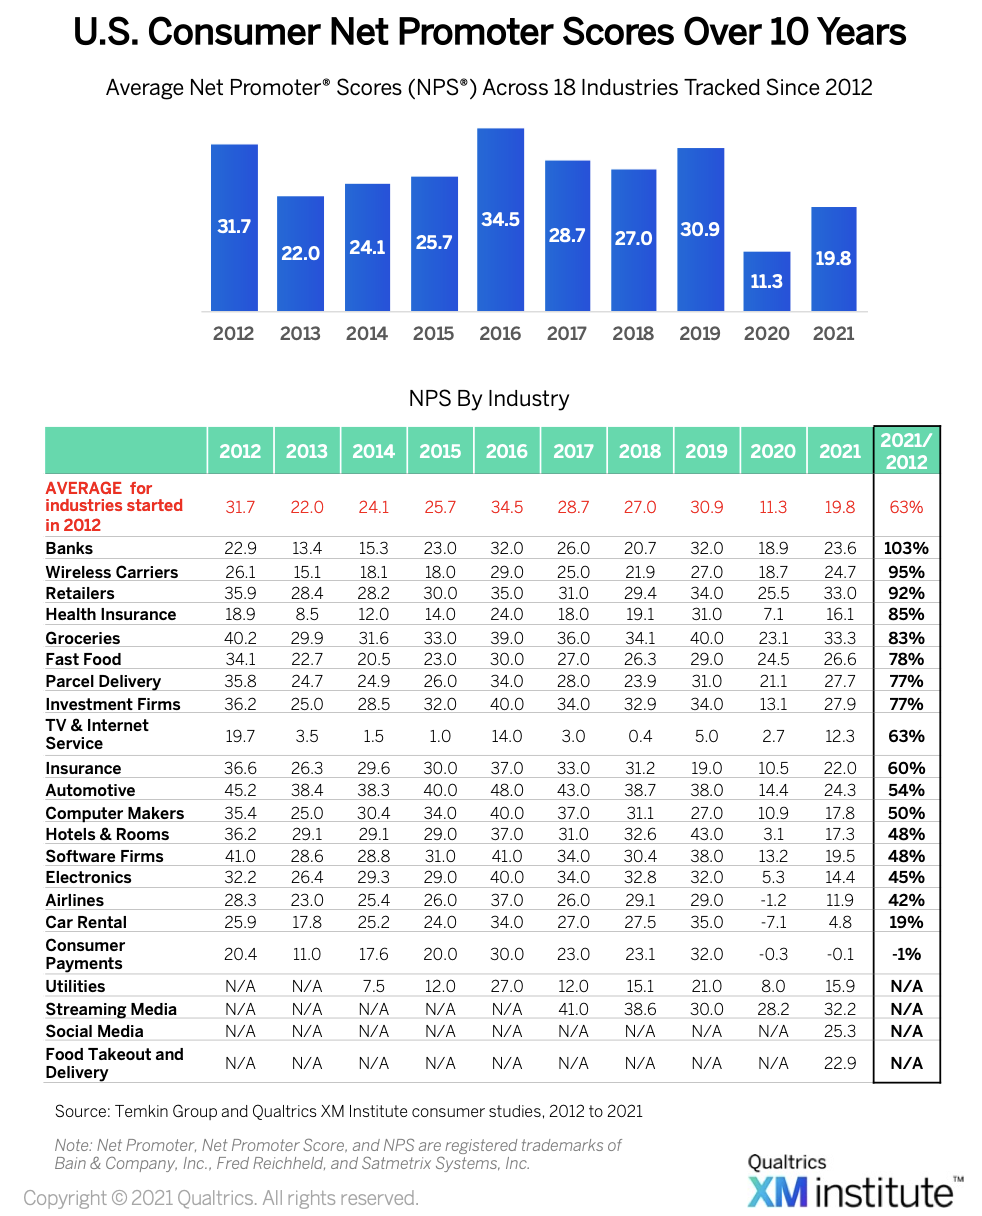
As you can see in the chart below:
- Average NPS dropped from 31.7 to 19.8. In 2012, the average NPS was 31.7, but it is nearly 12 points lower in 2021. The average NPS across industries hit a high of 34.5 in 2016, and also crossed over 30 in 2012 and 2019. NPS hit its low point of 11.3 in 2020.
- Banks, wireless carriers, and retailers made strong 10-year relative gains. The average NPS in 2021 dropped to 63% of the 2012 level. Eight industries are above that level, led by banks, wireless carriers, and retailers, which are all above 90% of their 2012 scores. Banks are the only industry with a 2021 NPS that is higher than its 2012 NPS, which is still below its high of 32 which banks hit in 2016 and 2019.
- Consumer payments and car rentals have fallen behind. Two industries fell well below the rest in 2021 when compared with 2012, consumer payments (19% of 2012) and car rentals (-1% of 2012).
- 2020 was a horrible year. As COVID jarred every aspect of people’s lives, NPS collapsed in 2020, hitting an all-time average low of 11.3. Fourteen of the eighteen industries earned their lowest scores in the decade.
- 2019 was a banner year for health plans and consumer payments. Prior to COVID, NPS was on the rise. In 2019, eight of the industries had NPS above their 2012 levels. Two industries earned the highest levels of NPS relative to 2012 that we have found in 10 years: health plans (164%) and consumer industries (156%).
NPS Versus Other Economic Indicators
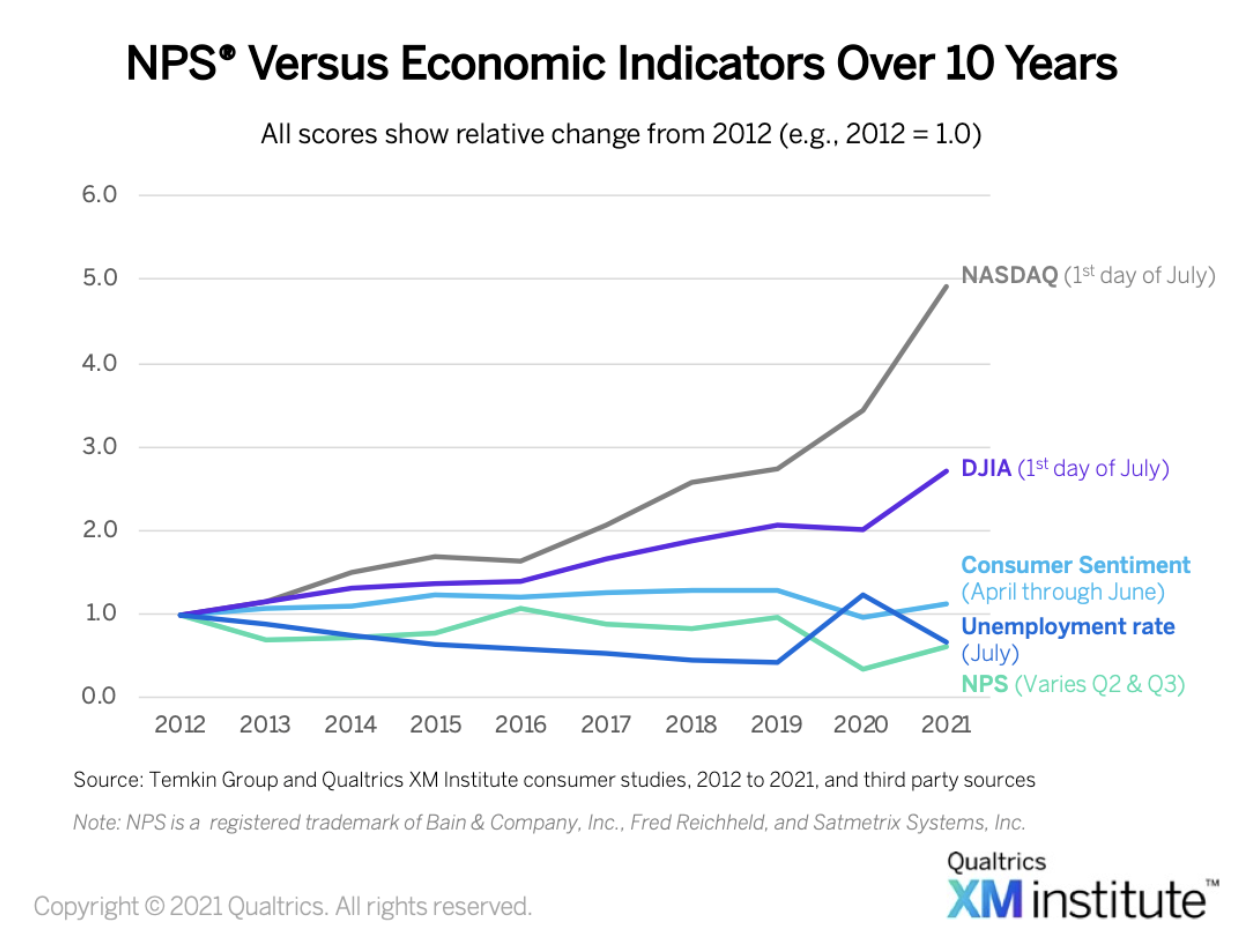
NPS has dipped and recovered a few times over the decade, which made us wonder how it relates to other economic indicators in the U.S. So we took a look at changes relative to 2012 for NPS (which we have collected in Q2 or Q3 of each year) and these other indexes:
- NASDAQ composite index, the closing level on the first trading day in July
- Dow Jones Industrial Average (DJIA), the closing level on the first trading day in July
- University of Michigan’s Consumer Sentiment Index, for the period of April through June
- Unemployment rate, seasonally adjusted for July
To analyze these different measures together, we normalized the data by creating an index from their 2012 baseline levels (2012 equals 1.0). As you can see in the chart below:
- A lot changed in 2016. Prior to 2016, consumer sentiment and NASDAQ were in lockstep and they both moved in almost the opposite direction of NPS. After 2016, both the NASDAQ and DJIA became seemingly unleashed, growing with little connection to any of the other indices.
- And then came 2020. As COVID threw a curveball into everything in 2020 (except NASDAQ), NPS moved in the same direction as consumer sentiment but was even more volatile. And while unemployment had been on a steady decline and disengaged from the movement of the other measures, between 2019 and 2021 NPS has started to track in the opposite direction of unemployment.
The bottom line: It’s been a wild decade for NPS (and for consumers).
Note: Net Promoter, Net Promoter Score, and NPS are registered trademarks of Bain & Company, Inc., Fred Reichheld, and Satmetrix Systems, Inc.
Bruce Temkin, XMP, CCXP, is the Head of Qualtrics XM Institute