There’s been a lot of discussion in the press about “The Great Resignation,” pointing to the large numbers of employees who are likely to switch jobs. XM Institute’s recently completed Q3 2021 consumer benchmark study confirms that environment, as we found that 52% of U.S. employees are at least somewhat likely to look for a new job over the next six months.
72.4 Million Potential Job Seekers in the U.S.
When we extrapolate our findings for job-seeking across age groups in the U.S. population, we estimate that 72.4 million U.S. employees are at least somewhat likely to look for a new job within the next six months, while 44.5 million are very likely. The largest group of job-seekers are between the ages of 25- and 34-years old, and 55% of the total job seekers are between the ages of 25 and 44. Here are the number of employees who are at least somewhat likely to look for a new job broken down by age ranges:
- 18 to 24 years: 12.4 million
- 25 to 34 years: 22.1 million
- 35 to 44 years: 17.0 million
- 45 to 54 years: 11.9 million
- 55 to 64 years: 7.0 million
- 65 to 74 years: 1.8 million
- 75 years or older: 0.3 million
Job Seeking Changes Between 2019 and 2021
To understand how this job seeking has changed since the pandemic, we compared our Q3 2021 consumer benchmark study of 5,000+ U.S. full-time employees with a similar study that we conducted in Q1 2019. The methodology has changed a little across the two studies (as I describe at the bottom of this post), but there’s a lot to learn by analyzing the data across employee segments.
On average, we see a 14 %-point increase in employees who are looking for a new job in the next six months from 38% in Q1 2019: 38% to 52% in Q3 2021. While the methodology change may limit the accuracy of the exact comparison between years, the underlying details provide a rich set of insights about what’s happening.
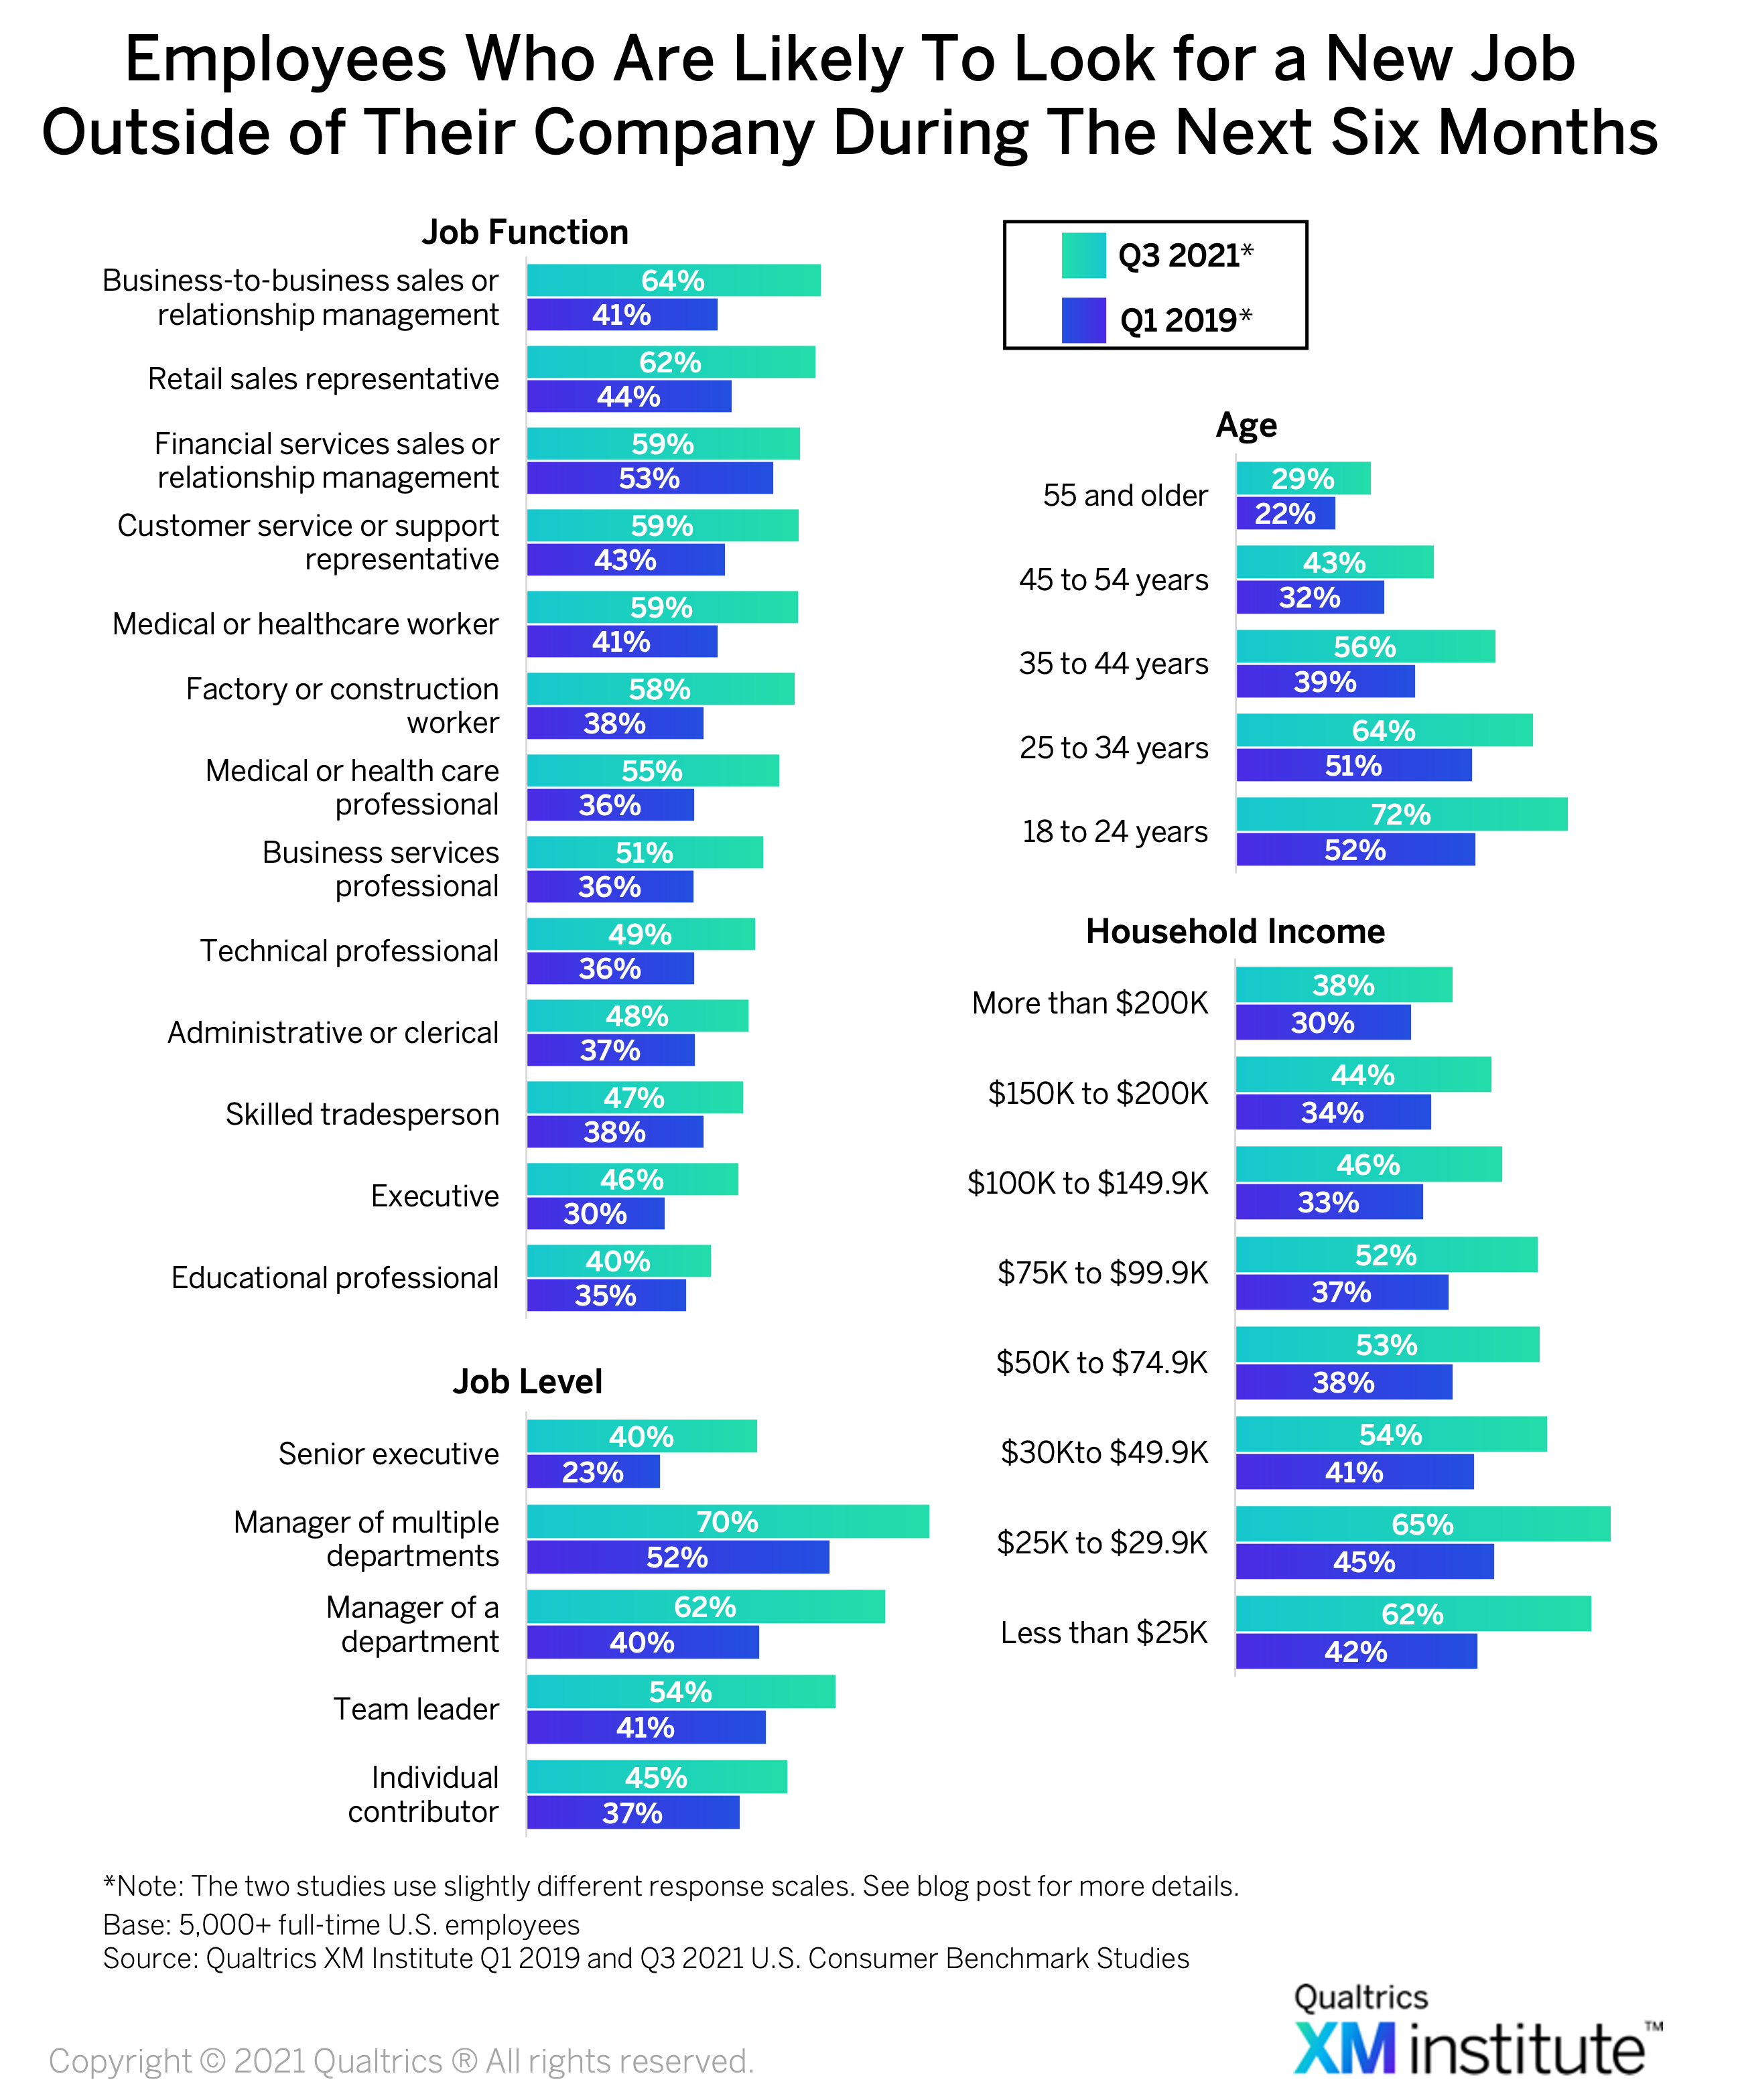
As you can see in the chart above:
- B2B salespeople are most on the move. The most active job seekers are B2B salespeople, as 64% are likely to look for a new job over the next six months. This is also the area that has had the largest increase since 2019 (23 %-points, 53% overall). Three other job functions experienced an increase of at least 50%: Executives (55%), factory workers (51%), and medical professionals (50%).
- Educational and financial services professionals are the most stable. Only 40% of educational professionals are likely to look for a new job, the lowest of any function (executives held this spot in 2019). While all job functions experienced a bump in job seekers, only two increased less than 20%, financial service professionals (11% increase) and educational professionals (15%).
- Senior managers are the most active job seekers. Managers of a department (62%) or multiple departments (72%) are the groups most likely to look for a new job. When compared to 2019, department managers looking for a new job increased the most in absolute quantity (22 %-points). Although only 40% of senior executives are likely to look for a job right now, that represents a 72% increase from 2019.
- Job seeking inversely correlates with age. Our data from both 2019 and this year shows that the level of job-seeking is highest with the youngest group and decreases in each of the subsequent age categories. The 35- to 44-year-olds increased their job-searching by 45%, the highest increase across any age group.
- Job seeking now inversely correlates with income. More than 60% of employees in households that earn $30,000 or less are likely to look for a new job, and that level declines with each subsequently higher income level. This connection between income and job searching has become more defined than it was in 2019. Over the last two years, consumers in the two lowest income categories have increased their job-seeking by 46%, compared with those at the top of the income pyramid who have only increased their job-seeking by 24%.
Get Ready for “The Great Onboarding”
Our analysis confirms that there will be a lot of people looking for new jobs during the upcoming year. However, they won’t only be leaving their current employer. They’ll also be joining new organizations. So this situation represents both a risk and an opportunity for organizations. Here are a few recommendations as you navigate the Yin and Yang of this environment:
- Retain your strongest employees. The data shows that lots of people will be leaving, so you can’t save everyone. Focus your retention efforts on critical roles and critical people, making sure that they feel appreciated, engaged, and inspired by their future opportunities in your organization.
- Build a strong employment brand. How do candidates view your organization? Make sure that your organization is viewed as a desirable employer. This requires offering competitive compensation and benefits packages, a desirable work environment, strong employee engagement (to drive referenceability), and a clear and compelling vision that inspires candidates to join in.
- Recruit the best of the best. Rather than overly focusing on the many employees who may be leaving, turn your attention to hiring new employees that will propel your organization. This is an opportunity to upgrade your workforce. Make sure you have a strong recruiting process that finds the right people and provides a superior candidate experience.
- Revamp your onboarding. With so much anticipated turnover, it’s critical for organizations to improve the efficiency and effectiveness of their onboarding efforts. This is a key area of focus that often goes under-resourced and under-designed but likely needs immediate attention across many firms. It’s time to dedicate resources to accelerate the process of turning new employees into highly productive employees.
Discussion of Methodology
The two studies we discuss in this post are both based on online surveys of 10,000 U.S. consumers with quotas set to mirror the U.S. census data for age, income, gender, ethnicity, and region. We identified a subset of those consumers who are full-time employees (more than 5,000 in each of the studies) and asked them: How likely are you to look for a new job outside of their company during the next six months? However, we offered different response scales in each of the studies as follows:
- Q1 2019. In 2019, we offered respondents a seven-point scale from 1 (not likely) to 7 (very likely), and we counted the percentage of employees who selected either 5, 6, or 7.
- Q3 2021. This year, we offered respondents five labeled options (Not at all likely, Slightly likely, Somewhat likely, Very likely, and Extremely likely) and we counted the percentage of employees who selected somewhat, very, or extremely likely.
It is very tricky to compare data across different scales, so I don’t think this is a perfect comparison for the overall level of changes between 2019 and 2021. However, it is a very strong mechanism for examining what’s happening right now and for comparing the relative shifts across different employee segments as I’ve discussed above.
The bottom line: Prepare to retain, lose, and onboard a lot of employees
Bruce Temkin, XMP, CCXP, is the Head of Qualtrics XM Institute