Tomorrow I will join millions of Americans in celebrating Thanksgiving. Many of us will spend the day with our families devouring turkey, stuffing, and other savory dishes while watching football games. It’s also a great time to actually give thanks.
I have a lot to appreciate; a wonderful family, a great group of friends, a thriving business, an amazing Temkin Group team, and the world’s best clients. As we know from the positive psychology movement, the act of appreciation creates happiness—and all of that makes me very happy.
Given the holiday, I decided to dig into Temkin Group’s Q3 2016 Consumer Benchmark Study and see who’s happy. I analyzed which of the 10,000 U.S. consumers in our study agree with the statement “I am typically happy.”
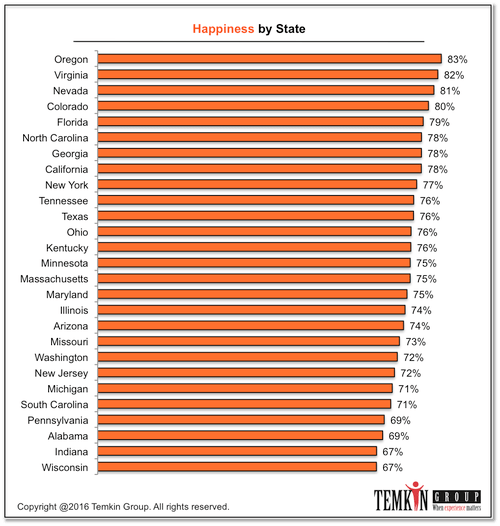
This first chart shows data from the 27 states where we had at least 100 respondents. As you can see, happiness ranges from a high of 83% in Oregon down to a low of 67% in Wisconsin and Indiana.
The next set of charts show the level of happiness across different demographic segments:
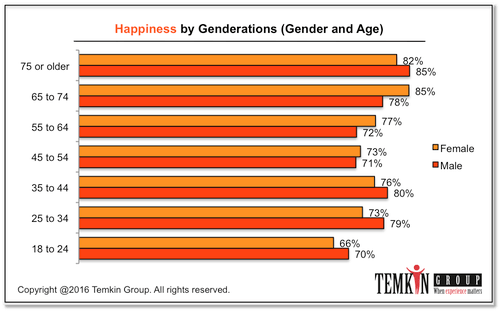
- Genderations: The happiest females are 75 and older, while 65- to 74-year-old males are the happiest (85% say that they are typically happy). 18- to 24-year-olds are the least happy, followed closely by 45- to 54-year-olds. Between the ages of 18 and 44, males are happier than females. Females are happier between 45- and 74-years-old.
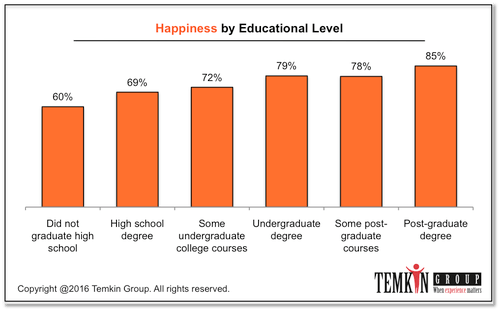
- Education: As the level of education increases, so does happiness. Eighty-five percent of those with an advanced degree are happy, compared with only 60% of those who did not graduate high school.
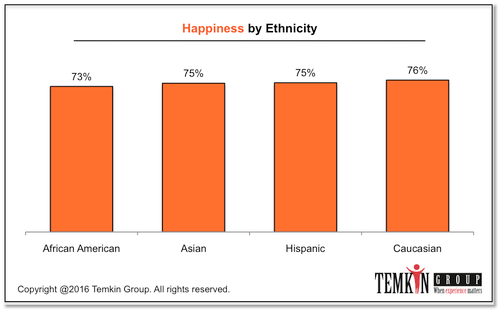
- Ethnicity: There’s little variation in happiness across ethnic groups. Caucasians are the happiest (73%), but only three points above African Americans (73%).
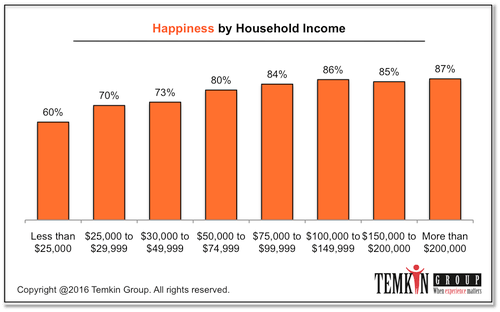
- Income: Only 60% of consumers making less than $25,000 per year are happy. Happiness rises with income until consumers’ household income hits about $100,000, after which happiness plateaus around 86%.
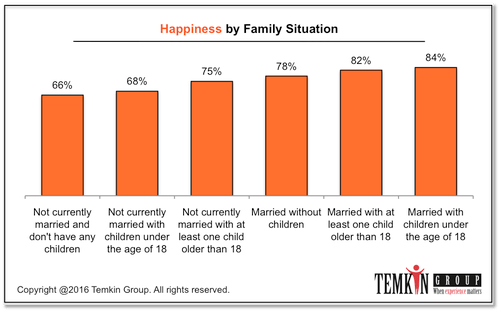
- Family: Married people are happier. Eighty-four percent of those who are married with young children are happy, followed by married people with older children and with no children at all. The least happy people are those who are not married and do not have kids; only 66% are happy.
The bottom line: Happiness rises with age, education, income, and marriage.
This blog post was originally published by Temkin Group prior to its acquisition by Qualtrics in October 2018.