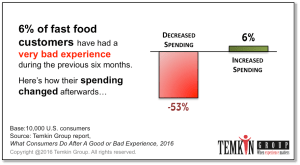
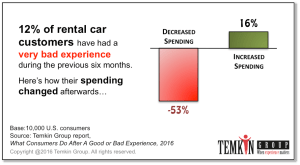
Can a single bad experience cost a company money? You bet! As a matter of fact, 53% of consumers reported a cut in spending at fast food restaurants and rental car agencies after they’ve had a very bad experience. Those are the highest levels across the 20 industries we examined. At the bottom of this post we’ve assembled a number of industry-specific data charts that you can download and use.
In the report, What Consumers Do After a Good or Bad Experience, 2016, we analyzed how 10,000 U.S. consumers changed their spending after having a bad experience with hundreds of companies.
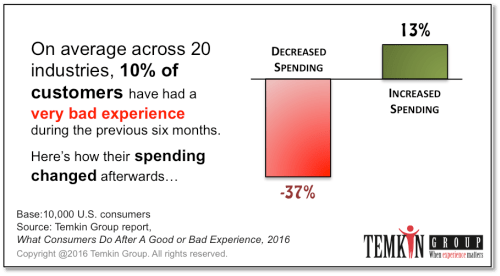
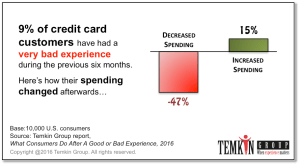
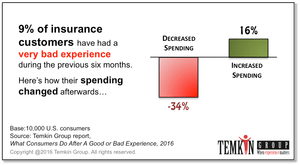
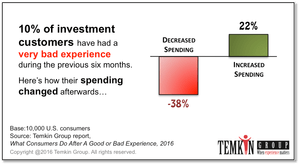
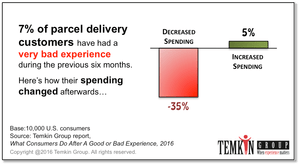
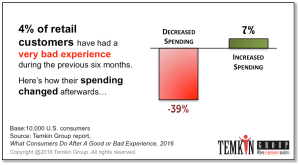
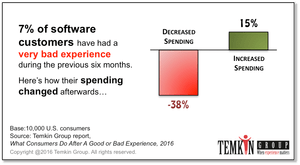
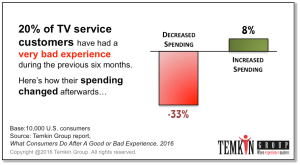
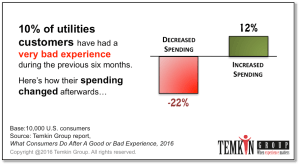
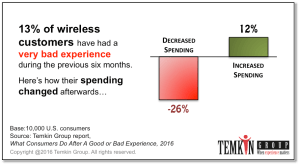
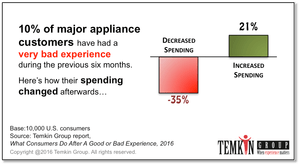
On average across all industries, 10% of consumers have had a very bad experience in the previous six months. After that experience, 37% of consumers cut back on their spending. As a result, 3,7% of revenues are at risk after a very bad experience (10% x 37%). This at-risk revenue ranges from a high of 6.5% for rental cars down to a low of 1.6% for supermarkets and retailers.
Bad Experience and Spending Change Charts for 20 Industries
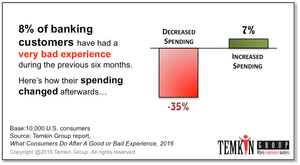
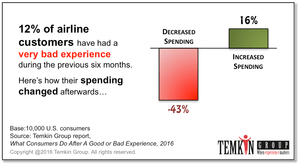
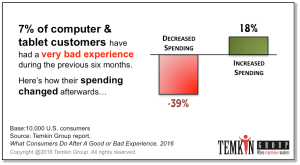
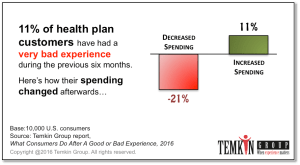
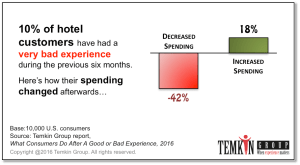
If you’re looking for good data for your industry, we’ve put together these 20 industry charts. Feel free to use them within your presentations in accordance with our citation policy.
For example, here’s some draft copy you might use, together with your industry’s chart, in your company’s internal or external blog:
At [Your Company’s Name], we work hard to improve our Customer Experience, and this industry chart from Temkin Group shows why even one bad experience can cost us lost sales.

This blog post was originally published by Temkin Group prior to its acquisition by Qualtrics in October 2018.